
Market Overview
| Study Period | 2020 - 2031 |
|---|---|
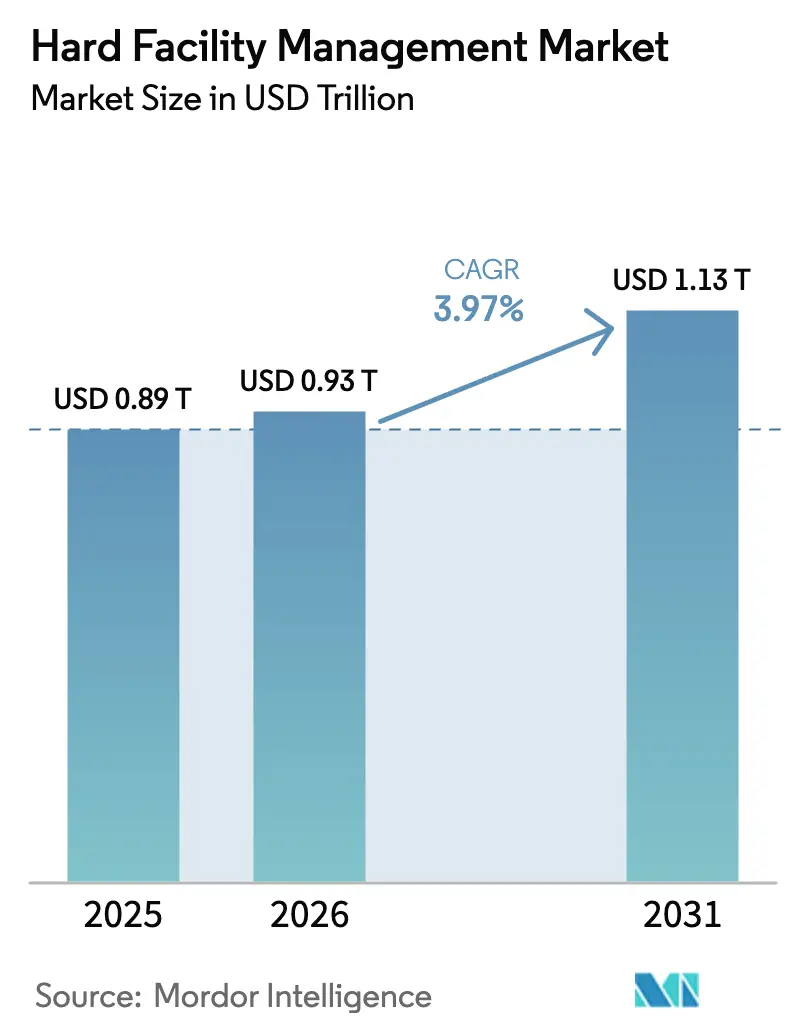
| Market Size (2026) | USD 0.93 Trillion |
| Market Size (2031) | USD 1.13 Trillion |
| Growth Rate (2026 - 2031) | 3.97 % |
| Fastest Growing Market | Middle East |
| Largest Market | North America |
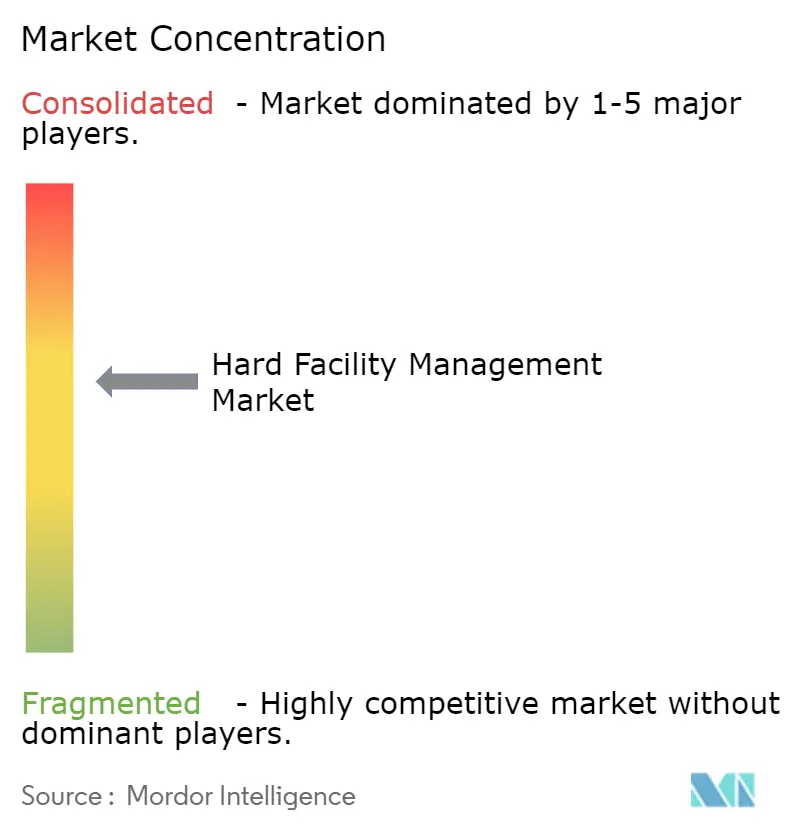
| Market Concentration | Medium |
Major Players *Disclaimer: Major Players sorted in no particular order Image © Mordor Intelligence. Reuse requires attribution under CC BY 4.0. | |
Hard Facility Management Market Analysis by Mordor Intelligence
The hard facility management market size is expected to increase from USD 890 billion in 2025 to USD 930 billion in 2026 and reach USD 1.13 trillion by 2031, growing at a CAGR of 3.97% over 2026-2031. Rapid migration from reactive toward predictive maintenance, expanding decarbonization mandates, and the rise of integrated outsourcing are reshaping cost structures and service mixes. Spending is shifting toward data-rich asset stewardship that merges building-automation data with cloud analytics, while multi-year contracts hedge labor‐cost volatility and guarantee uptime for mission-critical facilities. Private-equity roll-ups are injecting capital for digital platforms, accelerating adoption of AI-powered work-order routing, and widening the gap between technology-enabled leaders and single-trade specialists. Uptime guarantees in data centers exceeding 99.982% are redefining service quality thresholds and pressuring generalist contractors to deepen engineering capabilities.
Key Report Takeaways
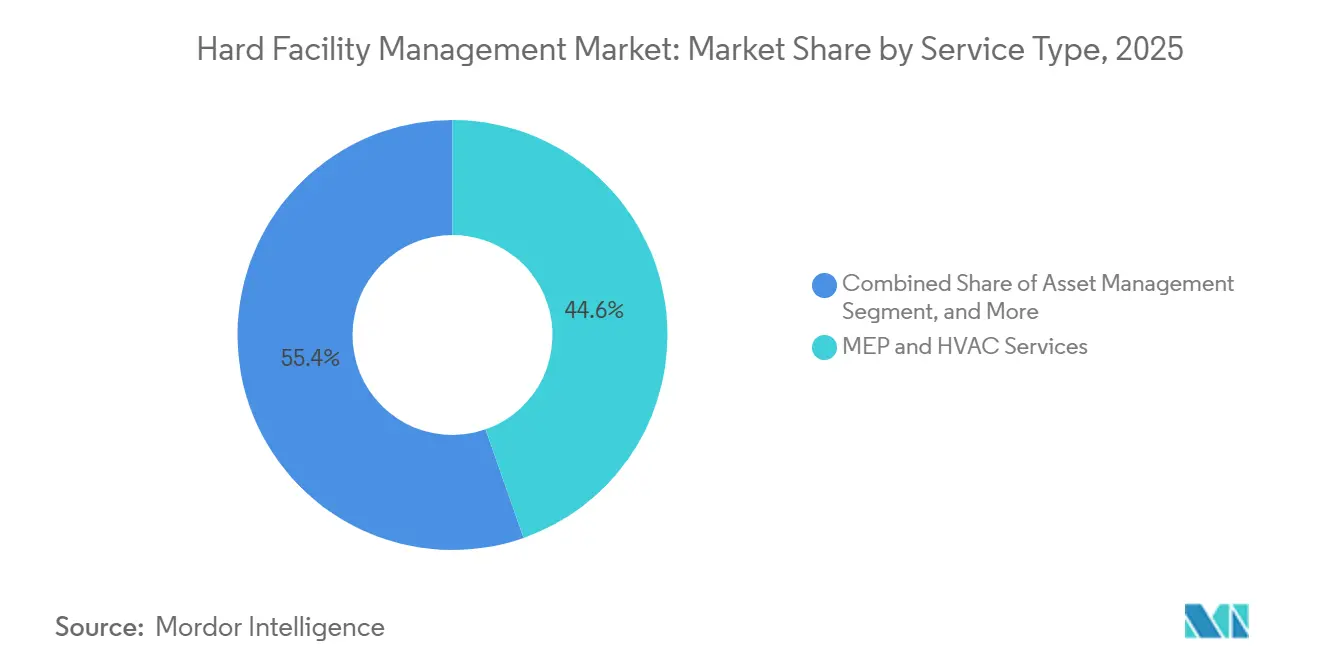
- By service type, MEP and HVAC services led with 44.63% of the hard facility management market share in 2025.
- By service type, asset management is projected to advance at a 4.32% CAGR through 2031.
- By offering type, outsourced delivery models held 58.71% of 2025 revenue and are forecast to expand at a 4.19% CAGR to 2031.
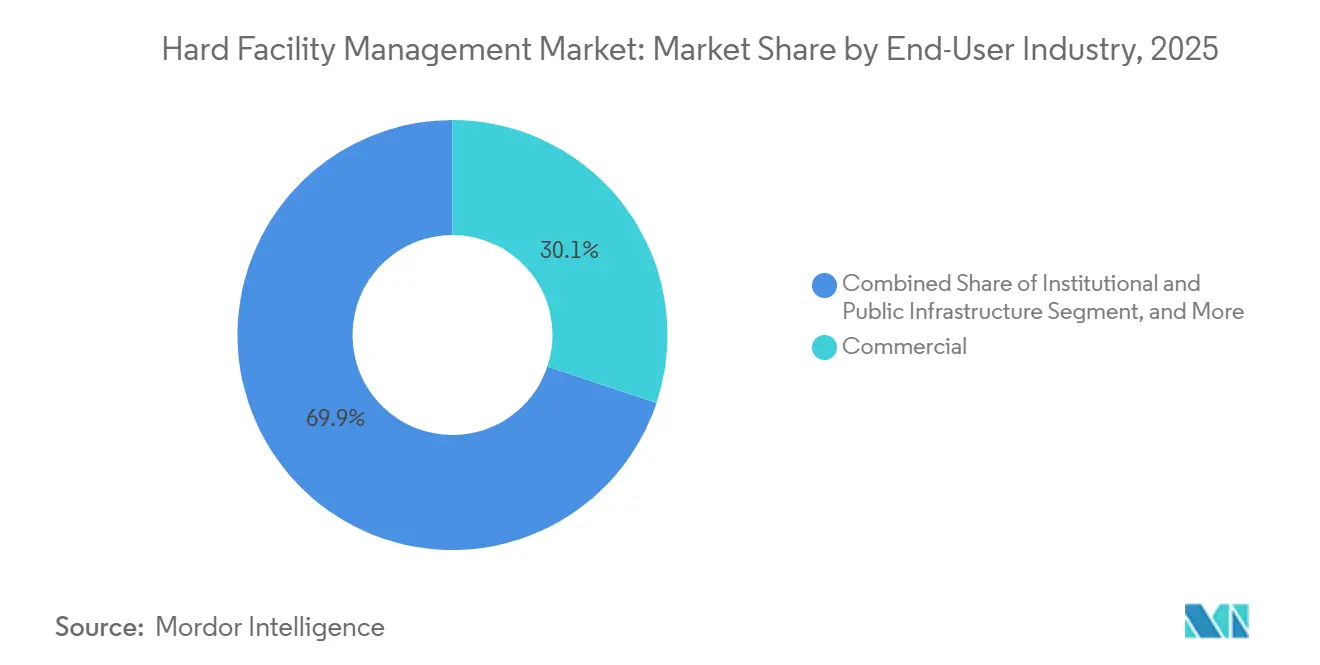
- By end-user, commercial real estate commanded 30.12% demand in 2025, while healthcare is set to grow at a 5.07% CAGR through 2031.
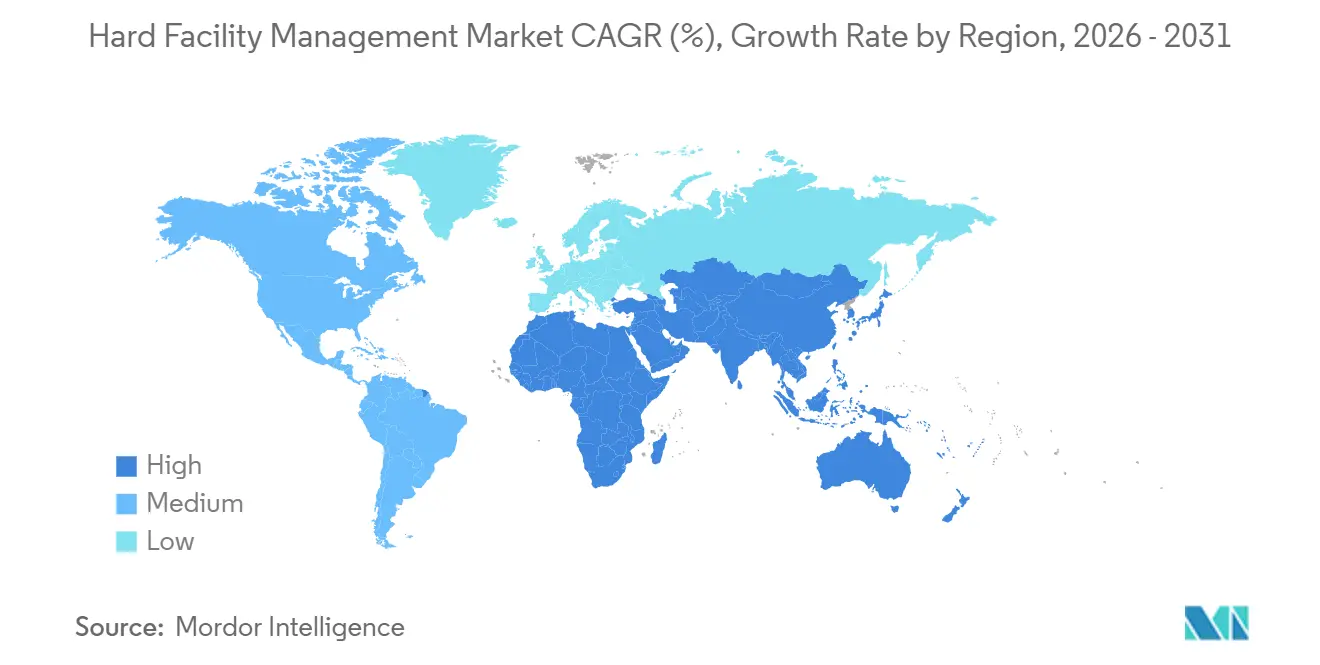
- By geography, North America accounted for 37.28% revenue in 2025; the Middle East is positioned for the fastest regional growth at 5.81% CAGR to 2031.
Note: Market size and forecast figures in this report are generated using Mordor Intelligence’s proprietary estimation framework, updated with the latest available data and insights as of 2026.
Market Trends and Insights
Drivers Impact Analysis of Hard Facility Management Market*
| Driver | (~) % Impact on CAGR Forecast | Geographic Relevance | Impact Timeline |
|---|---|---|---|
| AI-Enabled Predictive Maintenance Platforms | +0.9% | Global, early uptake in North America and Europe | Medium term (2-4 years) |
| Decarbonization Mandates Driving HVAC and Energy Retrofits | +1.2% | Europe and North America, spreading to Asia-Pacific | Long term (≥4 years) |
| Integrated Hard-Soft FM Outsourcing to Reduce Lifecycle Cost | +0.7% | Global, strong in commercial and healthcare sectors | Medium term (2-4 years) |
| Data-Driven FM Procurement and Cost-Inflation Hedging | +0.5% | Global, notably North America and Europe | Short term (≤2 years) |
| Resilience Upgrades for Climate-Related Extreme Weather Events | +0.6% | North America, Middle East, Asia-Pacific coastal | Long term (≥4 years) |
| Private-Equity Roll-Ups Accelerating Hard-FM Tech Adoption | +0.4% | North America and Europe | Short term (≤2 years) |
| Source: Mordor Intelligence | |||
AI-Enabled Predictive Maintenance Platforms Drive Operational Transformation
Machine-learning models now analyze vibration, temperature, and power-draw data from HVAC chillers, boilers, and switchgear to flag anomalies weeks before a failure occurs, converting unplanned downtime into scheduled interventions. ABM Industries deployed the approach at an Ingredion site in 2025, avoiding compressor outages and saving USD 1.2 million annually.[1] Building owners are embedding uptime clauses in service agreements, pushing providers to invest in sensor networks and data scientists. The shift favors large, capital-rich operators that can absorb upfront digital costs, accelerating consolidation. Predictive contracts also tighten supplier relationships because analytics platforms benchmark asset health against manufacturer data, compelling joint optimization of parts inventory and warranty coverage. As a result, the hard facility management market is moving toward outcome-based pricing tied to mean-time-between-failure metrics.
Decarbonization Mandates Accelerate HVAC and Energy Retrofit Investments
California’s 2025 code now requires heat pumps in new commercial builds, and the EU’s revised directive mandates zero-emission status for new structures by 2030, forcing rapid electrification of heating and ventilation.[2] Demand has spiked for variable-refrigerant-flow systems, ground-source heat pumps, and high-performance façades that cut thermal bridging. Facility managers wrestle with securing retrofit capital that may exceed traditional contract horizons, amplifying interest in energy-service-company style agreements that spread repayment over savings. Procurement teams face lengthy lead times for compressors and inverters, a bottleneck that expands the role of integrated FM providers with sourcing leverage. Compliance frameworks such as ISO 50001 are now prerequisites for public tenders, raising entry barriers for smaller contractors and increasing the strategic importance of decarbonization credentials within the hard facility management market.
Integrated Hard-Soft FM Outsourcing Reduces Lifecycle Costs
Companies are bundling MEP, fire safety, and structural repairs with cleaning, security, and catering to secure end-to-end accountability. ISS reported 5.8% organic revenue growth in Q3-2025 due to integrated deals that cross-sell technical trades into its legacy soft-service base.[3] Bundling lets owners negotiate lifecycle guarantees rather than task-level rates, transferring risk to providers that must harmonize disparate labor pools and technology stacks. The model is thriving in healthcare, where infection control depends on synchronized asset performance and environmental services. Providers scaling too quickly face integration risk, highlighted by rising churn where labor scheduling systems and computerized maintenance management systems are not fully aligned. Nonetheless, the trend continues to expand the hard facility management market because integrated contracts often extend to seven-year tenures, encouraging deeper capital investment in predictive tools.
Data-Driven FM Procurement Enables Cost-Inflation Hedging Strategies
SourceBlue’s Q3-2025 MEP Cost Index reached 233, underlining spare-parts price hikes that have spurred data-centric procurement.[4] Large providers aggregate spend across portfolios, using predictive models to time buy-outs for switchgear and chillers before commodity run-ups. Contracts now feature escalation caps tied to producer-price indices, transferring inflation risk to suppliers. Analytics also expose duplicate vendors, enabling strategic sourcing and volume rebates. Regional contractors lacking scale find themselves squeezed because they cannot leverage similar buying power or hedging instruments. Performance-based agreements that share energy-savings gains with providers are proliferating, further aligning incentives and embedding data analytics deep within the hard facility management market.
Restraints Impact Analysis of Hard Facility Management Market*
| Restraint | (~) % Impact on CAGR Forecast | Geographic Relevance | Impact Timeline |
|---|---|---|---|
| Skilled-Trades Labor Shortages and Aging Workforce | -0.8% | Global, acute in North America and Europe | Long term (≥4 years) |
| Volatile Input Prices for Critical MEP Spare Parts | -0.6% | Global, regional supply-chain dependencies | Medium term (2-4 years) |
| Cyber-Security Vulnerabilities in Connected BMS | -0.3% | Global, digitally advanced markets | Short term (≤2 years) |
| Short Contract Tenures Limiting ROI on Hard-FM Capex | -0.4% | Global, especially commercial real estate | Medium term (2-4 years) |
| Source: Mordor Intelligence | |||
Skilled-Trades Labor Shortages Constrain Service Delivery Capacity
The Associated General Contractors of America revealed a 439,000-worker shortfall in the United States for 2025 projects, with 68% of technicians aged 45 plus and retirement outpacing apprenticeship intake. Wage inflation passed 6% annually, eroding fixed-price margins. Specialized roles in building-automation programming and fire-alarm integration face the steepest gaps because certification pathways are lengthy and vendor-specific. Immigration curbs intensify the squeeze in North America and Europe. Higher pay alone has not resolved the scarcity, prompting providers to invest in augmented-reality training and remote expert support to stretch scarce talent. Persistent shortages limit the capacity of the hard facility management market to absorb surging retrofit demand.
Volatile Input Prices for Critical MEP Spare Parts Increase Operational Costs
The International Energy Agency reported transformer costs climbed 75% between 2019 and 2025 on copper and steel inflation. Lead times for specialized switchgear now exceed 52 weeks, obliging providers to stock costly inventory or negotiate consignment deals. Fixed-price contracts signed prior to 2024 are underwater as suppliers refuse mid-term repricing. Some operators have adopted index-linked clauses, but clients often resist, leading to contract terminations. Commodity hedging is emerging as a core competency, and multi-regional sourcing strategies are spreading risk across suppliers. Elevated replacement costs compress profit margins and slow project schedules across the hard facility management market.
*Our forecasts treat driver/restraint impacts as directional, not additive. The impact forecasts reflect baseline growth, mix effects, and variable interactions.
Hard Facility Management Market Segment Analysis
By Service Type:
MEP Dominance Meets Asset-Management DisruptionMEP and HVAC services claimed 44.63% of 2025 revenue, underscoring their role as the backbone of the hard facility management market size at facility level. Data-center power densities jumping toward 100 kW per rack accelerate demand for liquid cooling, redundant feeds, and precision controls. Quarterly inspections mandated by Joint Commission in healthcare sustain fire-safety work, while façade and structural repair volumes are event-driven, rising after climate events.
The rise of computerized maintenance management systems is elevating asset management, the fastest-growing service line at 4.32% CAGR. Platforms capture run-time data from chillers, pumps, and emergency power systems, calculate remaining useful life, and auto-schedule tasks. This convergence blurs distinctions between trades because analytics pull MEP telemetry into strategic planning. Smaller HVAC-only shops face consolidation pressure as owners pursue integrated bundles that cut administrative effort. Wireless smoke detectors and cloud alarms, recognized in NFPA 72-2025, further digitize inspection routines. Overall, the segment’s transition from break-fix to outcome-oriented service is a defining current for the hard facility management market.

By Offering Type:
Outsourcing Gains as Capex Constraints MountOutsourced models held 58.71% of 2025 revenue, confirming that organizations prefer variable expense structures and specialist expertise. Integrated facility management contracts dominate healthcare and institutional bidding because they guarantee lifecycle cost ceilings. Bundled hard-FM agreements appeal to commercial landlords operating multisite portfolios that require service uniformity.
In-house teams, representing 41.29% in 2025, struggle to recruit trades, making external providers more attractive when contracts stretch to seven years and cover capital upgrades. Private-equity backed platforms court in-house operators with hybrid staff-placement models that blend onsite control with centralized procurement muscle. As a result, the hard facility management market size tied to outsourcing is set to widen its advantage through 2031. Performance-based clauses that align provider remuneration with uptime or energy savings deepen collaboration and anchor long-term partnerships.
By End-User Industry:
Healthcare Outpaces Aging Commercial StockCommercial real estate delivered 30.12% of 2025 spending, led by office, retail, and mixed-use properties requesting standardized MEP and façade care. Yet healthcare is accelerating at a 5.07% CAGR, steered by demographic aging and infection-control imperatives that boost HVAC filtration and asset redundancy. Predictive sensors in operating suites now monitor particulate loads and temperature drift, triggering proactive filter changes that avoid surgical delays.
Institutional investors flood data centers, logistics warehouses, and senior-living facilities, each imposing distinct service intensity. Public infrastructure, constrained by budgets, anchors baseline demand through compliance frameworks such as ISO 14001. Vendors with clinical engineering capabilities are expanding fastest, while hospitality contractors pivot toward guest-experience metrics that embed FM ratings into customer satisfaction dashboards. These diverse needs reinforce segmentation depth within the hard facility management market, opening niches for specialist entrants even as integrated majors scale.
Geography Analysis
North America Hard Facility Management Market
North America retained 37.28% of 2025 revenue because of vast legacy building stock and regulatory momentum around electrification. Federal incentives and state codes encourage retrofit cycles, especially in California where compulsory heat pumps now set design baselines. U.S. data-center clusters in Virginia and Texas amplify demand for high-density power and water-efficient cooling. Canada’s infrastructure renewals concur with P3 models that embed FM guarantees, binding long-term revenue.
Europe Hard Facility Management Market
Europe’s trajectory is dominated by the revised directive setting zero-emission goals for new buildings by 2030, which channels capital into HVAC electrification and envelope upgrades. Germany earmarked EUR 14 billion (USD 15.9 billion) for energy efficiency, subsidizing FM-led retrofits. Compliance with EPC classes A and B is reshaping procurement criteria, shunting preference toward providers with decarbonization roadmaps verified under ISO 50001.
MEA, APAC and South America Hard Facility Management Market
The Middle East carries the fastest CAGR at 5.81% as Saudi Vision 2030 mega projects including NEOM and the Red Sea resort city demand climate-adapted HVAC and energy management. UAE directives under the Dubai 2040 master plan push smart-building integration and LEED Gold certifications. High ambient temperatures necessitate chiller plants with thermal storage and materials rated for 50 °C summers, intensifying per-square-foot spend. Asia-Pacific growth is propelled by China’s automation mandate for large commercial builds and India’s Smart Cities Mission, while South America and Africa progress in pockets as urbanization lures multinational occupiers. Across regions, regulatory energy targets, climatic extremes, and smart-city programs expand addressable volumes within the hard facility management market.
Regulatory Landscape
Hard facility management is shaped by building-safety rules, energy-performance mandates, and management-system standards that increasingly influence how owners procure and audit technical services. In 2026, standardization activity accelerated: ISO 41002:2026 (published June 2026) added updated international guidance for FM organizational development, while ISO/DIS 41001 entered a revision ballot phase (as of April 2026), strengthening the role of auditable FM management systems in global tenders.
Country and city-level requirements are also tightening operational compliance. In China, GB/T 47134-2026 was issued on January 28, 2026 and implemented on May 1, 2026, formalizing guidance for FM strategy development and pushing owners toward more structured asset-planning and vendor governance. In the Middle East, Dubai Law No. (3) of 2026 introduced a Quality and Safety Certificate requirement for buildings under Dubai Municipality enforcement with a one-year compliance deadline, which raises the value of documented inspections, maintenance records, and certified technical contractors within hard FM scopes.
Value Chain Analysis
The hard facility management value chain starts with upstream OEMs and component suppliers for HVAC, electrical, controls, and fire systems, followed by distributors and specialist subcontractors that supply parts, tools, and certified labor for service delivery. Core service providers, including in-house teams, single-trade contractors, bundled providers, and integrated FM platforms, plan and execute preventive and corrective work, increasingly using IoT sensors, computerized maintenance management systems, and AI-enabled dispatch to manage mixed workforces across direct engineers and third-party vendor networks. Asset data and compliance documentation are becoming a parallel stream, as providers maintain digital building databases to support inspection regimes and energy programs.
Downstream, building owners and occupiers across commercial real estate, healthcare, industrial/process, and data centers contract for outcome-led performance such as uptime, safety compliance, and energy efficiency, often through multi-year integrated agreements. This extends the chain into adjacent services like portfolio governance, lease administration, and workplace operations under a single delivery model, as shown by JLL being selected for expanded global services by Rolls-Royce. As procurement shifts toward lifecycle accountability, providers with scale gain leverage in sourcing constrained MEP spares and standardizing procedures across regions, while smaller single-trade firms operate as certified local execution partners within larger prime-contractor ecosystems.
Competitive Landscape
The hard facility management market exhibits moderate concentration: the ten largest providers command roughly 35-40% of global revenue, leaving a fragmented field of regional and single-trade firms. Private-equity sponsors such as Blackstone, KKR, and Apollo spent 2025 aggregating mid-market operators and funding digital upgrades. CBRE posted USD 8.7 billion Q3-2025 revenue, citing Global Workplace Solutions as its growth engine after embedding predictive analytics and occupancy sensing. ISS, registering 5.8% organic expansion, leveraged integrated contracts to cross-sell hard FM into its soft portfolio. Sodexo’s onsite services contributed EUR 22.6 billion (USD 25.5 billion) in fiscal 2025, with hard FM near 30% of mix.
Data-center specialism constitutes a profit pool because liquid cooling and 99.982% uptime exceed the competences of generalist firms. New SaaS entrants offering asset-management portals can disintermediate full-service providers by letting owners orchestrate multiple contractors in-house. Cyber-security credentials now influence bids, especially where IEC 62443 compliance is stipulated; suppliers presenting third-party audits gain edge in healthcare and government verticals.
Patent filings for predictive-maintenance algorithms and digital-twin environments are rising, yet interoperability challenges hinder lock-in. Culture clashes during roll-up integrations risk service quality dips, giving incumbents a differentiation opportunity through proven global processes. Margin pressure from labor costs sparks innovation in mobile workforce management and augmented reality support, a critical lever as the hard facility management market scales digital intensity.
Hard Facility Management Industry Leaders
-
CB Richard Ellis (CBRE.)
-
Sodexo Facilities Management Services
-
Jones Lang LaSalle Incorporated
-
Johnson Controls International plc.
-
Cushman & Wakefield
- *Disclaimer: Major Players sorted in no particular order
Hard Facility Management Market Companies Covered in this Report
- CBRE Group, Inc.
- ISS A/S
- Sodexo S.A.
- EMCOR Group, Inc.
- Mitie Group plc
- ABM Industries Incorporated
- Aramark Corporation
- Apleona GmbH
- GDI Integrated Facility Services Inc.
- OCS Group Limited
- Atalian Holding Development and Strategy
- Compass Group PLC
- Cushman and Wakefield plc
- Jones Lang LaSalle Incorporated
- Bouygues Energies and Services S.A.S.
- Dussmann Stiftung and Co. KGaA
- SBFM Limited
- BGIS Global Integrated Solutions, Inc.
- Al Shafar United for Facilities Management LLC
- Serco Group plc
Market Opportunities and Future Outlook
A clear whitespace sits at the intersection of critical infrastructure operations and data-driven hard FM, where owners are purchasing higher assurance and measurable outcomes. Large providers are showing stronger momentum in these lines of business. For example, CBRE cited an increase in building operations and experience and a sharp step-up in critical infrastructure services in early 2026, pointing to customer willingness to pay for power, cooling, and reliability capabilities beyond traditional MEP maintenance. This environment rewards specialist engineering depth, including electrical reliability, liquid cooling, and controls, alongside standardized processes that can be repeated across multi-site portfolios.
Digital productivity and compliance-led operating models also open demand for providers that can industrialize field execution. AI-enabled dispatch and optimization, including higher technician wrench time and lower drive distance, supports the business case for platform investment and for outcome-based contracts tied to uptime or energy. Compliance pull-through is further expanding the addressable scope, given Dubai Law No. (3) of 2026, which introduced mandatory building quality and safety certification with Dubai Municipality enforcement and a one-year compliance timeline, increasing demand for documented inspections, asset lifecycle records, and certified maintenance programs. With standardization through ISO/TC 267 and the release of ISO 41002:2026, procurement is moving toward more auditable FM governance, creating room for providers that can package hard FM delivery alongside management-system documentation and cybersecurity-ready building system integration.
Recent Industry Developments in Hard Facility Management Market
- July 2026: Sodexo awarded a global contract to deliver food services for Meta across more than 130 locations in over 30 countries. The deal expands high value FM exposure into major tech campuses and reflects appetite for integrated services with media and tech tenants. The engagement strengthens Sodexo's diversified portfolio and supports cross-selling across large scale corporate campuses.
- May 2026: JLL selected by Airbus to provide facilities management services for a 4.3 million square foot U.S. real estate portfolio. The arrangement expands high reliability industrial and government adjacent FM capabilities in the United States. It also creates potential cross selling opportunities into adjacent corporate and aerospace segments.
- May 2026: Sodexo awarded a seven year contract to manage facilities for Rio Tinto in Australia, including accommodation, cleaning, and building maintenance for Pilbara region sites. The contract extends mining sector presence in remote Australia and reinforces multi site, multi service revenue. It signals continued demand for integrated facilities management in remote, resource-rich regions.
Hard Facility Management Market Report Scope and Research Methodology
Market Definition and Coverage
This market covers paid services that keep building and site infrastructure running safely and reliably, mainly through maintenance, repair, testing, and compliance work on core systems such as HVAC, electrical, plumbing, elevators, and fire and life safety.
Scope exclusions: Soft services (such as cleaning, catering, and security) and pure construction or equipment manufacturing revenue are excluded.
Segments Covered in This Report
- By Service Type
- Asset Management
- MEP and HVAC Services
- Fire Systems and Safety
- Other Hard FM Services
- By Offering Type
- In-House FM
- Outsourced FM
- Single Facility Management
- Bundled Facility Management
- Integrated Facility Management
- By End-User Industry
- Commercial
- Hospitality
- Institutional and Public Infrastructure
- Healthcare
- Industrial and Process Sector
- Other End-User Industries
- By Geography
- North America
- United States
- Canada
- Mexico
- Europe
- United Kingdom
- Germany
- France
- Italy
- Rest of Europe
- Asia-Pacific
- China
- Japan
- India
- South Korea
- Rest of Asia
- Middle East
- Israel
- Saudi Arabia
- United Arab Emirates
- Turkey
- Rest of Middle East
- Africa
- South Africa
- Egypt
- Rest of Africa
- South America
- Brazil
- Argentina
- Rest of South America
- North America
Data Sources, Market Sizing, and Validation
Desk Research
We start by mapping the installed base that drives hard service demand, then we layer in how spending typically flows through outsourced contracts versus in-house teams. Public data is used to anchor the model, such as U.S. Bureau of Labor Statistics series on employment and wages, U.S. Energy Information Administration data on building energy use, Eurostat construction and services statistics, and International Energy Agency publications on buildings and efficiency.
To keep assumptions grounded, we also refer to sources such as building code and safety bodies (for inspection and compliance cycles), national statistics offices (nonresidential floor area and construction output), and reputable association and public-infrastructure sites that track building operations priorities. Company filings, annual reports, and investor presentations are reviewed to understand service mix and how contract scope is packaged, and a paid subscription for company financials, news, patents, and shipment-level trade checks is used selectively where it improves consistency. This list is illustrative only, and many other sources are referenced for data collection, validation, and clarification.
Primary Interviews and Surveys
Primary discussions are used to validate what is counted as hard services on real contracts, and to confirm typical pricing logic and the frequency of planned maintenance, testing, and emergency call-outs. We speak with facility owners, service providers, subcontractors, and procurement and operations leaders across major regions so desk inputs can be corrected for local labor conditions, regulation, and outsourcing maturity.
Distribution of primary research fieldwork respondents
| Company type | Respondent position | Region |
|---|---|---|
| Top tier: 30% | CXOs: 12% | APAC: 41% |
| Mid tier: 55% | Functional/Unit leaders: 31% | EMEA: 32% |
| Smaller Players: 15% | Managers: 57% | Americas: 27% |
Market-Sizing & Forecasting
Sizing is built from a top-down demand pool that reconstructs annual hard FM spend from the commercial and industrial building stock, the equipment intensity of those assets, and the share of work that is outsourced into service contracts. Once that demand pool is set, it is cross-checked using selective bottom-up approximations, such as sampled contract values from public tenders, channel checks on typical annual maintenance packages, and sampled price per visit multiplied by service volumes.
Key model inputs include the nonresidential and industrial installed base, labor rates and technician availability, planned maintenance and statutory inspection cycles (for elevators and fire and life safety), HVAC and MEP retrofit activity, and energy-efficiency and decarbonization programs that change service scope over time. Forecasting relies on scenario analysis, supported by expert expectations for outsourcing penetration, wage inflation, and energy-related retrofit intensity, which are then translated into value growth by region. Where coverage gaps exist in smaller countries or niche asset classes, proxy ratios are applied from comparable markets and then adjusted through interview feedback.
Data Validation & Update Cycle
Outputs are checked against independent signals like construction output trends, services employment and wage movement, and public-sector tender activity, and then large variances are re-opened for review. Assumptions are examined step by step, and unusual jumps are traced back to a specific driver such as outsourcing share, price changes, or a one-time retrofit cycle.
Before sign-off, another analyst reviews the model logic and the final totals for internal consistency across regions and time. Reports are refreshed annually, and interim updates are made when material events shift labor costs, regulation, or outsourcing behavior. Right before delivery, a fresh pass is completed so clients receive the latest updated view.
Mordor Intelligence's Hard Facility Management Market Estimate Compared With Other Published Estimates
Published market values for hard facility management often do not match because each publisher groups services differently and uses different assumptions for outsourced share, labor inflation, and how multi-service contracts are counted. The other big driver is the year and currency timing used for conversion, which can move the reported value even when the underlying demand story is similar.
Some estimates fold broader facility management spend into the number by including soft services or adjacent construction-linked work. In Mordor Intelligence, only hard services tied to operating and maintaining core building systems are counted, and the totals are then checked against building-stock signals and contract pricing patterns to keep the model tied to recurring service demand.
Benchmark comparison
| Source | Market Size | Gaps in Research Methodology |
|---|---|---|
| Mordor Intelligence | USD 0.89 T (2025) | |
| Trade Journal A | USD 0.68 T (2025) | Often reflects outsourced hard services only, which can understate total spend when in-house maintenance labor and materials are excluded or treated as operating cost outside the market. |
| Industry Portal B | USD 0.03 T (2025) | Likely narrows scope to software-enabled FM systems or a limited service subset, and it typically applies generic growth rates without checking against building stock, inspection cycles, or service frequency. |
The spread in the table mainly comes from whether in-house hard maintenance is counted, and whether the scope stays focused on core systems work versus adjacent categories. When scope is kept consistent and inputs are tied to building stock, service cycles, and realistic pricing, the resulting market size is easier to track and repeat year to year.
Key Questions Answered in the Report
What is the forecast value for global hard facility management spending by 2031?
The hard facility management market is projected to reach USD 1.13 trillion by 2031.
Which service category currently generates the largest revenue?
MEP and HVAC services led with 44.63% of 2025 revenue.
Why is healthcare the fastest-growing end-user segment?
Aging demographics and stringent infection-control standards drive a 5.07% CAGR for healthcare through 2031.
How fast is the Middle East market expanding?
Fueled by mega projects under Saudi Vision 2030, the region is advancing at a 5.81% CAGR to 2031.
What role do predictive analytics play in facility management contracts?
Predictive platforms enable uptime guarantees, shift risk to providers, and underpin outcome-based pricing models.