Market Overview
| Study Period | 2020 - 2031 |
|---|---|
| Forecast Data Period | 2026 - 2031 |
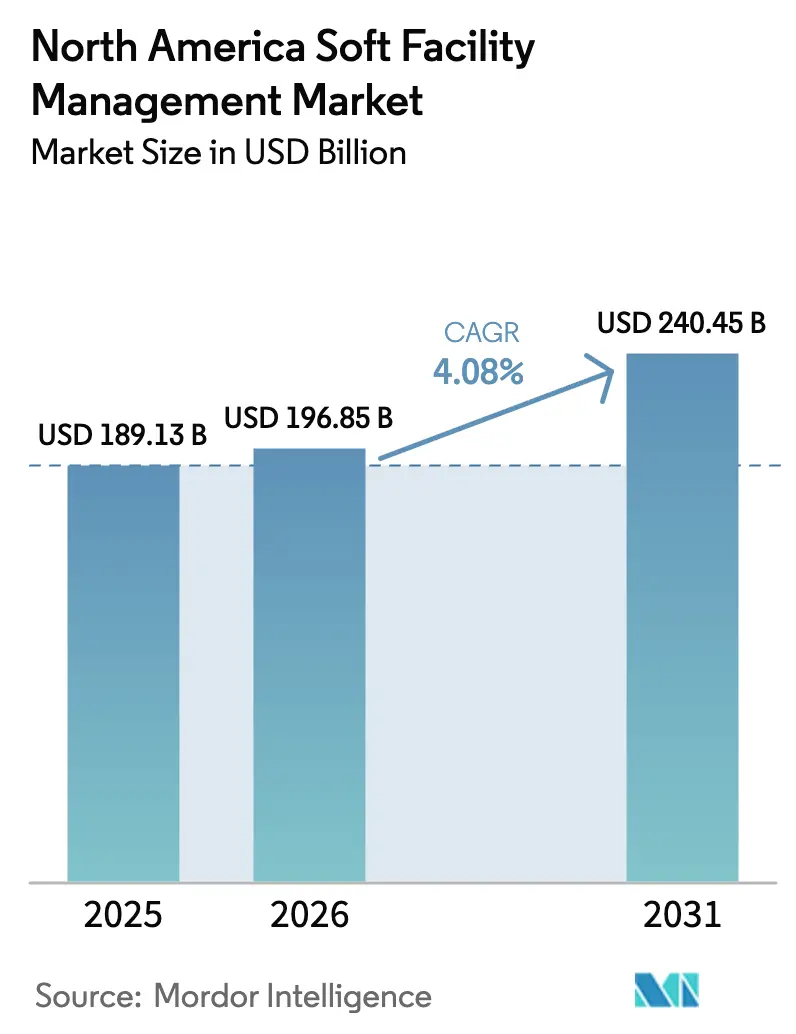
| Base Year Market Size (2025) | USD 189.13 Billion |
| Market Size (2026) | USD 196.85 Billion |
| Market Size (2031) | USD 240.45 Billion |
| Growth Rate (2026 - 2031) | 4.08% CAGR |
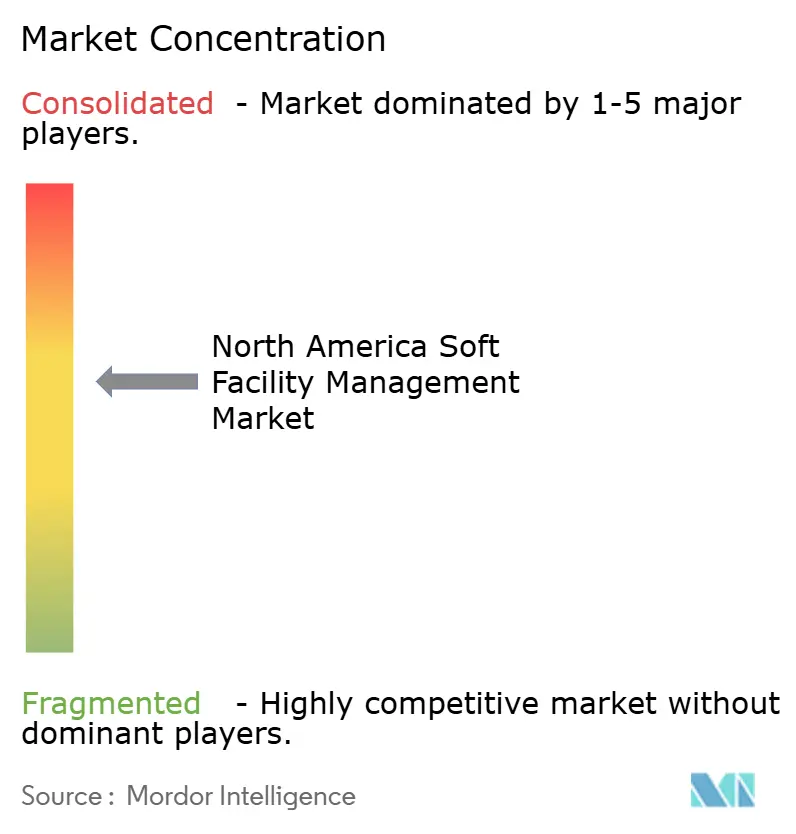
| Market Concentration | Medium |
Major Players *Disclaimer: Major Players sorted in no particular order Image © Mordor Intelligence. Reuse requires attribution under CC BY 4.0. | |
North America Soft Facility Management Market Analysis by Mordor Intelligence
The North America Soft Facility Management Market size was valued at USD 189.13 billion in 2025 and is estimated to grow from USD 196.85 billion in 2026 to reach USD 240.45 billion by 2031, at a CAGR of 4.08% during the forecast period (2026-2031), illustrating steady headroom for vendors that can pair labor-intensive services with digital oversight. Hybrid work schedules, mega-project completions, and wellness-oriented retrofit programs are reinforcing contract demand, while cost-inflation concerns are accelerating the pivot from in-house teams to outsourced, performance-priced agreements. Buyers now judge proposals on total cost per cleanable square foot, verified through Internet of Things dashboards, rather than on hourly labor rates. Integrators able to prove double-digit reductions in labor hours through robotics or AI work-order routing are winning multi-year enterprise deals. Regulatory complexity linked to prevailing-wage rules, PFAS bans, and cybersecurity directives continues to favor suppliers with dedicated compliance staff and the ability to de-risk clients from litigation exposure.
Key Report Takeaways
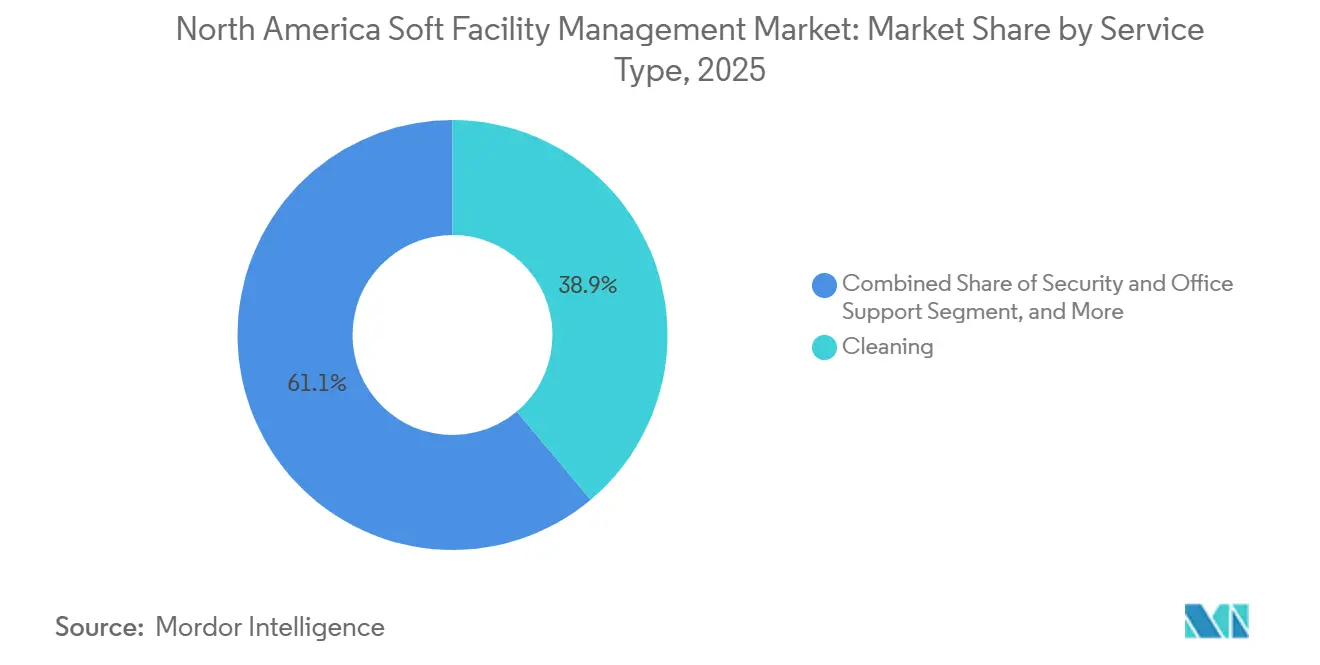
- By service type, cleaning captured 38.89% revenue share in 2025, while security and office support are advancing at a 5.76% CAGR through 2031.
- By offering type, outsourced delivery commanded 65.44% of the North America soft facility management market share in 2025, and integrated models are projected to expand at a 5.23% CAGR to 2031.
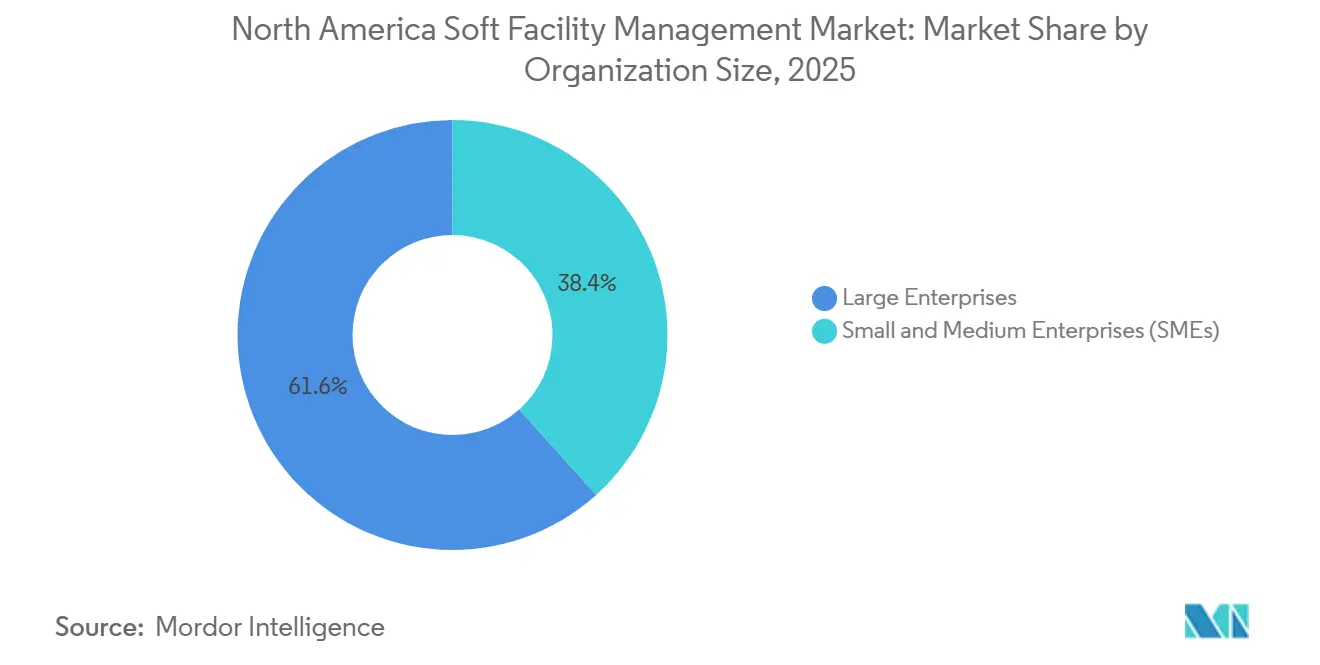
- By organization size, large enterprises contributed 61.65% of 2025 revenue, whereas small and medium enterprises are projected to grow at a 5.38% CAGR through 2031.
- By end-user industry, the commercial segment held 34.56% of the North America soft facility management market size in 2025 and is expected to accelerate at a 5.63% CAGR up to 2031.
- By country, the United States represented 78.43% of regional revenue in 2025, yet Mexico is on track for a 6.02% CAGR, the fastest within the forecast window.
Note: Market size and forecast figures in this report are generated using Mordor Intelligence’s proprietary estimation framework, updated with the latest available data and insights as of January 2026.
North America Soft Facility Management Market Trends and Insights
Drivers Impact Analysis*
| Driver | (~) % Impact on CAGR Forecast | Geographic Relevance | Impact Timeline |
|---|---|---|---|
| Growth of Mega Construction Projects | +1.2% | United States and Canada, New York, Texas, Ontario | Medium term (2-4 years) |
| Rising Outsourcing Trend Across CRE | +1.0% | Major United States metros | Short term (≤ 2 years) |
| Increasing Healthcare Infrastructure Investment | +0.7% | United States and Canada | Long term (≥ 4 years) |
| Adoption of Integrated Facility Management Platforms | +0.9% | United States and Canada | Medium term (2-4 years) |
| Demand for WELL and Fitwel Certified Workspaces | +0.6% | United States core markets, Canada, Mexico | Short term (≤ 2 years) |
| Proliferation of Tenant Experience Apps | +0.5% | United States office corridors, emerging in Canada | Short term (≤ 2 years) |
| Source: Mordor Intelligence | |||
Growth of Mega Construction Projects in North America
Mega builds valued above USD 1 billion are embedding soft-service mobilization into the critical path, guaranteeing revenue before occupancy. Examples include the Gordie Howe International Bridge and the Gateway Hudson Tunnel, both of which executed integrated cleaning and security bids months ahead of handover, shortening traditional sales cycles.[1]Associated Builders and Contractors, “Construction Backlog Indicator,” abc.org Early award of these contracts forces vendors to scale recruitment, equipment leasing, and safety training rapidly but locks in predictable cash flows for 5-plus years. The backlog indicator for non-residential projects hit 9.2 months in early 2025, the highest since 2019, signaling a robust future pipeline. Contractors with hazardous-material certifications and confined-space experience are favored for underground rail and bridge assets, segments less vulnerable to residential real-estate cycles. Over the medium term, substantial completions scheduled between 2026 and 2028 will convert capex into recurring service revenue, supporting above-average regional growth.
Rising Outsourcing Trend Across Commercial Real Estate
Corporate landlords and occupiers continue divesting non-core janitorial and security staff in favor of variable-cost contracts that flex with fluctuating occupancy. Integrated contracts now account for roughly one-fifth of outsourced spend, up from 15% in 2020, highlighting the speed of adoption. Portfolio consolidation simplifies invoice reconciliation, trims procurement headcount, and raises switching barriers, which explains why tenant-retention rates improved eight percentage points in buildings offering concierge-style services. The trend is strongest in Class A towers where amenity arms races intensify, but even suburban landlords are experimenting with performance pricing to defend net operating income as leases roll.
Increasing Healthcare Infrastructure Investment
Record allocations for hospital expansions and rural clinic upgrades are creating a long tail of sterile-cleaning, food service, and security opportunities. United States federal stimulus allowed many nonprofit systems to modernize ancillary buildings, while Canada’s Infrastructure Bank financed new medical campuses, locking in decades-long maintenance obligations. Terminal-clean protocols, isolation-room servicing, and linen sterilization command margins 20-35% above standard rates yet require rigorous infection-control training. Contractors investing in Centers for Disease Control and Prevention certification programs are gaining preferred-bidder status, especially where unionized in-house teams face recruitment droughts. As medical campuses become community hubs with retail and research facilities, bundled soft-service contracts covering environmental services, patient transport, and concierge desks will enlarge ticket sizes beyond traditional janitorial scopes.
Adoption of Integrated Facility Management Platforms
Digital platforms such as IBM TRIRIGA and Oracle Cloud are reshaping procurement criteria, inserting cybersecurity and API interoperability alongside price and staffing plans.[2]U.S. Cybersecurity and Infrastructure Security Agency, “Securing Building Automation Systems,” cisa.gov A 2024 Deloitte poll found platform adopters cut cleaning labor hours by 14% while lifting tenant-satisfaction scores by 11 points, validating subscription fees that can exceed USD 200,000 annually. Real-time restroom traffic sensors and waste-bin fill-level monitors enable supervisors to dispatch crews on demand, trimming idle time and over-service. Vendors that finance software deployment and mobile training inside master agreements are squeezing out smaller operators that rely on paper checklists. However, ransomware threats targeting building-automation system credentials mean clients expect audited cyber controls, prompting integrators to hire IT security teams and carry cyber-liability insurance, costs that are increasingly considered standard overhead in bids.
Restraints Impact Analysis*
| Restraint | (~) % Impact on CAGR Forecast | Geographic Relevance | Impact Timeline |
|---|---|---|---|
| Rising Labor Costs and High Employee Turnover | -0.8% | North America-wide, acute in high-cost metros | Short term (≤ 2 years) |
| Heightened Cybersecurity Risks for FM Platforms | -0.3% | United States and Canada, enterprise portfolios | Medium term (2-4 years) |
| PFAS Chemical Regulations | -0.5% | United States and Canada | Medium term (2-4 years) |
| Insurance Premium Inflation for On-site Contractors | -0.4% | North America-wide, especially high-risk verticals | Short term (≤ 2 years) |
| Source: Mordor Intelligence | |||
Rising Labor Costs and High Employee Turnover in the Janitorial Workforce
Median janitorial wages rose 19.1% from 2019 to 2025, outpacing overall wage inflation and squeezing margins for contractors operating on 6-10% net profits.[3]U.S. Bureau of Labor Statistics, “Occupational Employment and Wages, May 2025,” bls.gov High-cost metros like New York and San Francisco report turnover exceeding 75%, forcing agencies to spend USD 1,200-1,800 in onboarding costs per replacement. Many bidders now insert annual price-escalator clauses pegged to the consumer price index plus one percentage point to hedge unexpected wage hikes. Robotics helps but requires hefty capital outlays and maintenance programs, limiting penetration to large footprints where utilization justifies investment. Staffing strain can jeopardize service-level compliance, exposing vendors to financial penalties and contract termination, making labor availability the most immediate brake on growth.
PFAS Chemical Regulations Restricting Cleaning Formulations
The April 2024 EPA decision classifying certain PFAS compounds as hazardous substances triggered sweeping product reformulations that lifted material costs by 8-12% and shortened finish lifecycles. State laws in Maine and California further fragmented compliance, complicating national procurement. Fifty-plus brands revised floor finishes and carpet protectants, yet many replacements lack the durability of legacy chemistries, necessitating more frequent reapplication and pushing labor hours higher. Contractors must now maintain chemical-traceability logs and incident-response plans, tasks that small firms struggle to fund. Over the medium term, suppliers with in-house environmental-health teams are likely to absorb market share from independents unable to shoulder the reporting burden.
*Our forecasts treat driver/restraint impacts as directional, not additive. The impact forecasts reflect baseline growth, mix effects, and variable interactions.
Segment Analysis
By Service Type: Security Outpaces Traditional Cleaning Growth
Security and office support services are set to expand at 5.76% annually through 2031, exceeding the overall North America soft facility management market average. Demand is fueled by hybrid work models that require frictionless access control, visitor vetting, and concierge desks woven into workplace-experience apps. Cleaning, still the backbone at 38.89% of 2025 revenue, faces slower expansion as motion sensors and optimized routing cut labor-minutes per restroom. The North America soft facility management market size attached to security roles is slated to reach double-digit billions by 2031 as enterprises prioritize physical-cyber convergence hiring.
Landlords increasingly combine guard posts, package handling, and workspace reservations into a single reception function, boosting per-square-foot service fees. Catering resumes its pre-pandemic importance on corporate campuses, where subsidized food programs lifted on-site attendance by up to 18 percentage points in 2025. Landscaping, pest control, and waste management remain fragmented but are being wrapped into bundled master agreements that simplify compliance and reporting. Integrated reception, mailroom, and security contracts also provide a gateway for vendors to upsell event management and emergency preparedness training, deepening wallet share.


By Offering Type: Integrated Models Gain Despite Outsourced Dominance
Outsourced arrangements captured 65.44% of market spending in 2025 and are projected to rise at a 5.23% CAGR, emphasizing the appetite to convert fixed payrolls into variable costs. Within this pool, integrated facility management contracts are the fastest-moving slice, a reflection of procurement’s determination to cut vendor lists and insert real-time analytics into service delivery. In contrast, in-house programs cling to 34.56%, largely in sectors bound by security-clearance mandates or infection-control protocols.
North America soft facility management market share for integrated packages is poised to jump as procurement teams embed performance dashboards into contracts, letting them sanction or reward suppliers in near real time. Single-service deals are losing favor because coordination friction now outweighs marginal price discounts. Bundled but non-integrated packages serve as a bridge for mid-size enterprises experimenting with outsourcing; many flow into fully integrated renewals after pilot phases validate savings.
By Organization Size: SMEs Accelerate Outsourcing Adoption
Large enterprises held 61.65% of 2025 revenue, leveraging multinational scale to drive vendor consolidation and ESG-reporting harmonization. Small and medium enterprises, however, are racing ahead at 5.38% annual growth thanks to subscription-style packages priced between USD 2,000 and USD 8,000 per month. Digital dashboards once reserved for Fortune 500 portfolios are now embedded in off-the-shelf SME offerings, slashing coordination burdens that previously deterred outsourcing.
Franchise networks such as Jani-King and Vanguard Cleaning Systems are critical catalysts, extending professional branding and standardized protocols into tertiary metros at price points local janitorial shops struggle to match. The North America soft facility management market size for SMEs is still modest in absolute terms, yet the segment’s velocity signals a structural shift that could rebalance revenue distribution by the late 2020s. Meanwhile, large enterprises continue to push pilots for robotics and AI-powered task routing, aiming to neutralize wage inflation and cement multi-year cost visibility.
By End-User Industry: Commercial Segment Leads Across Metrics
Commercial buildings, spanning information technology campuses, retail flagships, and fulfillment centers, accounted for 34.56% of 2025 spending and are projected to grow at 5.63% annually. Landlords treat soft services as a tangible brand differentiator rather than overhead, integrating housekeeping requests into tenant mobile apps that also manage access badges and amenity bookings. North America soft facility management market size attached to commercial facilities will therefore expand faster than hospitality or institutional segments where budgets tighten under public funding constraints.
Healthcare facilities, although smaller in revenue share, command premium pricing due to regulatory cleaning standards. Industrial sites demand safety-certified crews and represent defensible niches where price competition is muted. Hospitality growth remains hampered by labor cost spikes and occupancy swings, yet large food-service acquisitions, like Sodexo’s Centerplate purchase, suggest renewed appetite for sport and event-venue contracts where per capita spend is rising post-pandemic. Residential and leisure properties stay fragmented, serviced mainly by local operators lacking national reach.
Geography Analysis
The United States, holding 78.43% of the North America soft facility management market in 2025, continues to outspend neighbors due to its expansive commercial real estate base and entrenched outsourcing norms. New supply in Austin, Dallas, Phoenix, and Atlanta incorporates soft-service scopes directly into development budgets, ensuring immediate contract activation upon certificate of occupancy. Legacy cores like New York and Chicago counteract vacancy drag by layering wellness certifications and concierge services onto leases, defending rent premiums and retaining tenants. Regulatory heterogeneity, from PFAS rules to state-level prevailing-wage acts, imposes legal complexity that smaller vendors find costly, pushing more share toward multi-service integrators with compliance offices.
Canada contributes a smaller slice yet benefits from federal infrastructure outlays of CAD 180 billion (USD 133 billion equivalent) earmarked for public transit, green projects, and social housing. Non-residential construction investment reached CAD 95.3 billion (USD 70.5 billion) in 2024, indicating a pipeline of facilities that will demand services through 2027. Toronto and Vancouver act as beachheads for integrated facility management pilots that then filter into secondary provinces. Prevailing-wage mandates and union penetration slow adoption in government sites, but multinational tenants increasingly override local preferences to align with regional vendor programs.
Mexico is the region’s growth engine, expanding at a 6.02% CAGR as foreign direct investment in manufacturing hit USD 36 billion in 2023 and continues rising. Nuevo León, Guanajuato, and Baja California host sprawling industrial parks where global automakers and electronics giants insist on near-real-time service-level dashboards and bilingual reporting. National labor law requires generous severance packages, so outsourcing offers corporations flexibility that in-house staffing cannot match. Class A office towers in Mexico City and Guadalajara are layering WELL and LEED standards onto fit-outs, importing United States wellness expectations and creating specialized soft-service niches. Currency volatility remains a contract-pricing challenge, yet most master agreements now peg billing to United States dollars to stabilize cash flows.
Competitive Landscape
The market is moderately concentrated, with players like CBRE, ISS, Cushman and Wakefield, Sodexo, and others. Proof-of-concept pilots for robotics, AI scheduling, and sensor-driven cleaning are lengthening procurement cycles, favoring cash-rich players who can underwrite trials without immediate payback. Technology differentiation is the central battleground; operators are launching proprietary analytics suites, raising switching costs and justifying premiums over regional incumbents reliant on spreadsheets.
Vertical specialization is the second axis of competition. ABM Industries disclosed in its 2024 filing that healthcare and education clients yield operating margins 200-300 basis points above portfolio average. Integrators therefore court infectious-disease experts, confined-space teams, and bilingual supervisors to deepen credibility in regulated sectors. Mergers and targeted acquisitions, like GDI’s Ontario janitorial buyout, illustrate the roll-up strategy aimed at stitching together regional pockets of share into continental footprints.
Innovation in autonomous cleaning devices, substantiated by 127 United States patents issued in 2024 for robotic scrubbers, supports labor-scarcity mitigation. Partnerships between Brain Corp and ABM or ISS and IBM highlight a co-development model where integrators secure exclusivity windows for cutting-edge hardware and software. Compliance acumen is now a primary renewal trigger; vendors that proactively tackle PFAS reporting, cybersecurity audits, and OSHA logs maintain higher client-retention rates than price-driven competitors. As contracts consolidate and technological thresholds rise, mid-tier firms face a strategic choice to specialize deeply or court acquisition.
North America Soft Facility Management Industry Leaders
CBRE Group Inc.
Sodexo Inc.
ISS A/S
ABM Industries Inc.
Cushman & Wakefield Plc
- *Disclaimer: Major Players sorted in no particular order

Recent Industry Developments
- January 2025: CBRE announced a USD 15 million expansion of integrated facility management services in Mexico, adding 500 bilingual staff to service nearshoring manufacturers in Nuevo León and Guanajuato.
- December 2024: Sodexo finalized the acquisition of Centerplate, adding 150 North American sport and event venues to its catering portfolio.
- November 2024: ISS launched an AI-enabled work-order platform developed with IBM, now active across 200 million square feet and targeting a 14% labor-hour reduction.
- October 2024: Cushman and Wakefield secured a 5-year, USD 180 million integrated facility management mandate covering 8.5 million square feet for a Fortune 100 technology firm in the United States and Canada.


North America Soft Facility Management Market Report Scope
Soft Facility Management (Soft FM) refers to the range of people-focused, non-technical support services that help keep a building or facility clean, safe, comfortable, and pleasant for occupants. Unlike hard facility management, Soft FM does not involve the maintenance of physical infrastructure or mechanical systems.
The North America Soft Facility Management Market Report is Segmented by Service Type (Cleaning, Security and Office Support, Catering, Other Soft Services), Offering Type (In-house, Outsourced), Organisation Size (Large Enterprises, Small and Medium Enterprises), End-User Industry (Commercial, Hospitality, Institutional and Public Infrastructure, Healthcare, Industrial and Process, Residential and Leisure), and Country (United States, Canada, Mexico). The Market Forecasts are Provided in Terms of Value (USD).
By Service Type
| Cleaning |
| Security and Office Support |
| Catering |
| Other Soft Services |
By Offering Type
| In-house | |
| Outsourced | Single-service FM |
| Bundled FM | |
| Integrated FM (IFM) |
By Organisation Size
| Large Enterprises |
| Small and Medium Enterprises (SMEs) |
By End-User Industry
| Commercial (IT/Telecom, Retail, Warehouses) |
| Hospitality (Hotels, Restaurants) |
| Institutional and Public Infrastructure |
| Healthcare |
| Industrial and Process |
| Residential and Leisure |
By Country
| United States |
| Canada |
| Mexico |
| By Service Type | Cleaning | |
| Security and Office Support | ||
| Catering | ||
| Other Soft Services | ||
| By Offering Type | In-house | |
| Outsourced | Single-service FM | |
| Bundled FM | ||
| Integrated FM (IFM) | ||
| By Organisation Size | Large Enterprises | |
| Small and Medium Enterprises (SMEs) | ||
| By End-User Industry | Commercial (IT/Telecom, Retail, Warehouses) | |
| Hospitality (Hotels, Restaurants) | ||
| Institutional and Public Infrastructure | ||
| Healthcare | ||
| Industrial and Process | ||
| Residential and Leisure | ||
| By Country | United States | |
| Canada | ||
| Mexico | ||


Key Questions Answered in the Report
How large is the North America soft facility management market in 2026?
The market reached USD 196.85 billion in 2026 and is forecast to grow at a 4.08% CAGR to USD 240.45 billion by 2031.
Which service category is growing the fastest?
Security and office support services are advancing at 5.76% annually through 2031, outpacing cleaning, catering, and other sub-segments.
Why are companies shifting toward integrated facility management contracts?
Integrated contracts consolidate cleaning, security, and catering under one vendor, reduce administrative overhead by up to 30%, and provide real-time performance dashboards that help owners manage costs.
What makes Mexico the fastest-growing country market?
Nearshoring investments in automotive and electronics plants demand bilingual, compliance-ready service providers, driving a 6.02% CAGR for soft facility management in Mexico through 2031.
How are wage pressures affecting vendors?
Median janitorial wages rose 19.1% from 2019 to 2025, slicing margins and prompting contractors to adopt robotics or insert price-escalator clauses into new contracts.
What technologies are reshaping the industry?
AI-driven work-order platforms, IoT-enabled restroom and waste sensors, and autonomous floor scrubbers are reducing labor hours by double-digit percentages and becoming standard in enterprise contracts.
Page last updated on:


