Hafnium Market Size and Share
Market Overview
| Study Period | 2021 - 2031 |
|---|---|
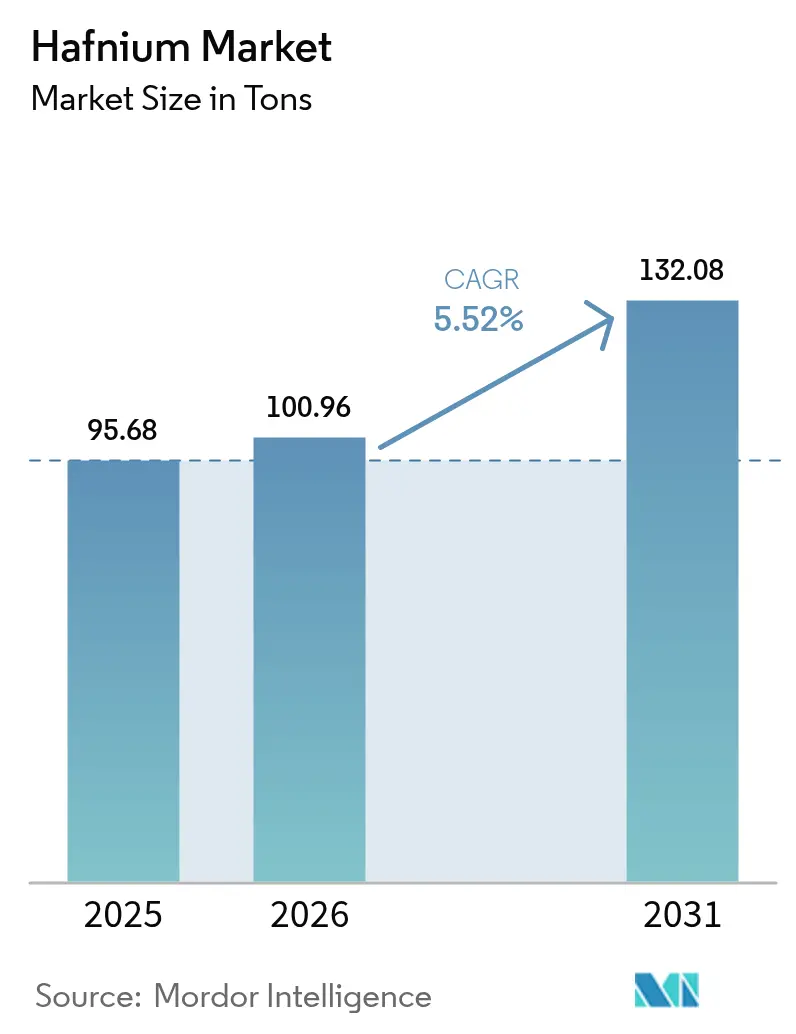
| Market Volume (2026) | 100.96 tons |
| Market Volume (2031) | 132.08 tons |
| Growth Rate (2026 - 2031) | 5.52% CAGR |
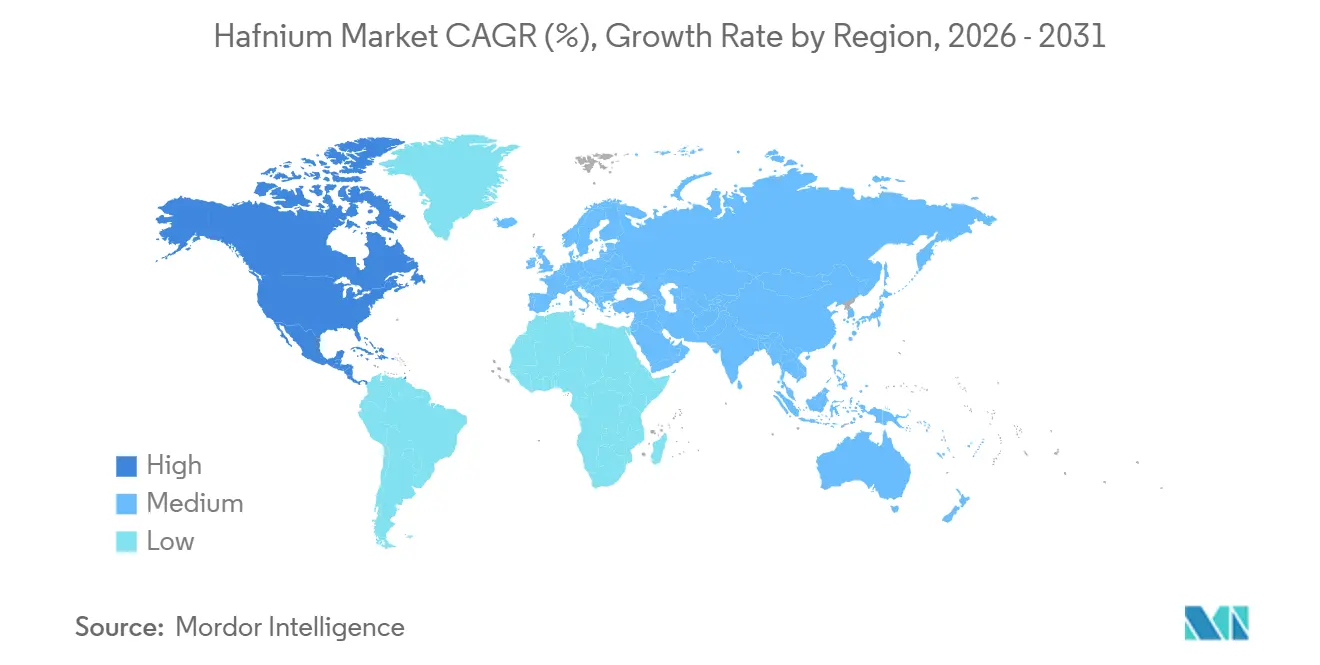
| Fastest Growing Market | North America |
| Largest Market | North America |
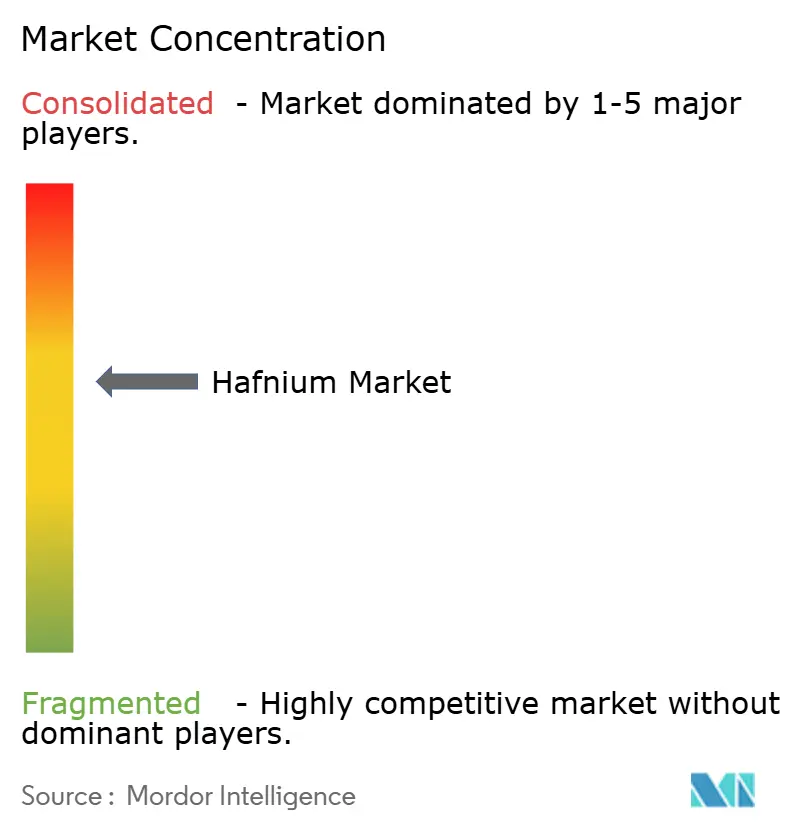
| Market Concentration | Medium |
Major Players *Disclaimer: Major Players sorted in no particular order Image © Mordor Intelligence. Reuse requires attribution under CC BY 4.0. | |
Hafnium Market Analysis by Mordor Intelligence
The Hafnium Market size was valued at 95.68 tons in 2025 and is estimated to grow from 100.96 tons in 2026 to reach 132.08 tons by 2031, at a CAGR of 5.52% during the forecast period (2026-2031). This expansion reflects a structural shift toward aerospace, nuclear, and semiconductor use-cases rather than simple volumetric growth. Reusable launch programs at SpaceX, Blue Origin, and Rocket Lab are raising demand for ultra-high-temperature ceramic tiles that rely on hafnium carbide, while nuclear-fleet operators in the United States, Canada, France, and the United Kingdom have accelerated strategic stockpiling of hafnium-bearing control rods to support small modular reactor (SMR) deployment schedules. The U.S. Geological Survey elevated hafnium to 14th place on its 2025 Critical Minerals List, citing a potential probability-weighted net GDP loss of USD 206 million if Chinese exports were curtailed, which further underscores procurement urgency among Western buyers. China’s 2024 dual-use export controls trimmed outbound volumes by nearly 90%, triggering a sustained rally in spot prices above USD 6,300 per kilogram in Europe during late 2025. In parallel, additive-manufacturing researchers at Skoltech and Tomsk Polytechnic have demonstrated plasma-based synthesis routes that can cut energy use for hafnium carbide powders, suggesting a pathway to localized powder production and partial insulation from price shocks.
Key Report Takeaways
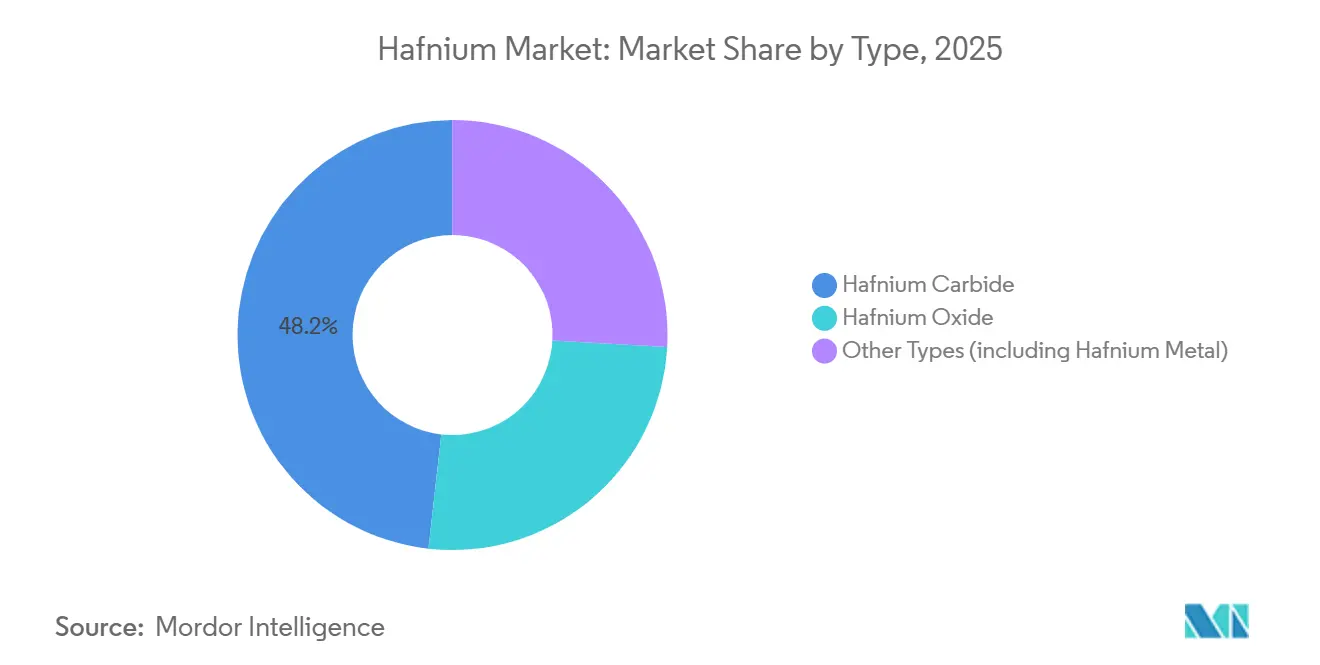
- By type, hafnium carbide led with 48.22% of hafnium market share in 2025; hafnium oxide is projected to expand at a 6.11% CAGR through 2031.
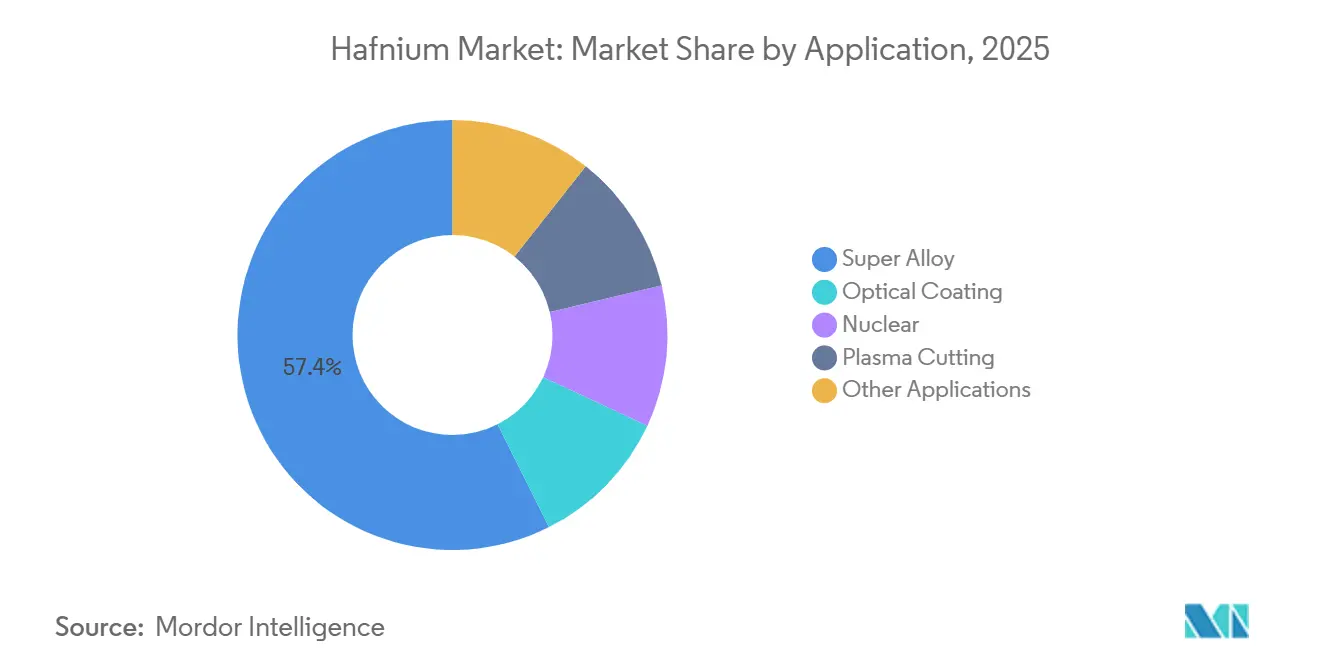
- By application, the super alloy segment captured 57.41% of the hafnium market size in 2025 and is forecast to grow at a 6.09% CAGR between 2026-2031.
- By geography, North America accounted for 38.62% of the hafnium market size in 2025 and is advancing at a 5.72% CAGR to 2031.
Note: Market size and forecast figures in this report are generated using Mordor Intelligence’s proprietary estimation framework, updated with the latest available data and insights as of 2026.
Global Hafnium Market Trends and Insights
Drivers Impact Analysis*
| Driver | (~) % Impact on CAGR Forecast | Geographic Relevance | Impact Timeline |
|---|---|---|---|
| Rapid scale-up of reusable launch vehicles using Hf-based UHTC tiles | +1.4% | Global, with concentration in North America (SpaceX, Blue Origin) and Asia-Pacific (China, Japan) | Medium term (2-4 years) |
| Strategic stock-piling by nuclear-fleet operators amid fuel diversification | +1.2% | North America, Europe (France, Russia), Asia-Pacific (China, India) | Short term (≤ 2 years) |
| Aerospace super-alloy substitution for rhenium under cost inflation | +1.0% | Global, led by North America and Europe aerospace hubs | Medium term (2-4 years) |
| Additive-manufacturing shift toward Hf-rich refractory powders | +0.8% | North America, Europe, Asia-Pacific (Japan, South Korea) | Long term (≥ 4 years) |
| Development of Hf-oxide nano-radiosensitizers for oncology | +0.6% | Global, with early adoption in Europe and North America | Long term (≥ 4 years) |
| Source: Mordor Intelligence | |||


Rapid Scale-Up of Reusable Launch Vehicles Using Hf-Based UHTC Tiles
SpaceX’s Starship, Blue Origin’s New Glenn, and China’s Long March 9 prototype families require hundreds of kilograms of hafnium-based ultra-high-temperature ceramic (UHTC) tiles per flight, because these materials keep structural integrity above 2,000 °C during re-entry. Missouri University of Science and Technology experiments published in 2024 show that hafnium carbide shifts oxidation mechanisms around 1,750 °C, data engineers now incorporate into thermal-protection simulations. A 2025 Journal of the American Ceramic Society article confirmed that selective-laser reaction pyrolysis yields 54% dense hafnium carbide from polymer precursors, lowering cycle times for tile manufacturing. SpaceX targets multiple Starship launches per week by 2027; at 300 kg of tiles per vehicle, steady cadence could lift aggregate carbide demand. North American and Asia-Pacific launch providers together anchor more than 80% of this incremental volume, encouraging regional powder-production startups that seek to shorten supply chains.
Strategic Stock-piling by Nuclear-Fleet Operators Amid Fuel Diversification
Electric utilities in the United States, Canada, France, and Finland have broadened hafnium purchases to secure control-rod inventories for both existing pressurized-water reactors and forthcoming Gen-IV or SMR units. Hafnium’s high thermal-neutron absorption cross-section keeps it irreplaceable for reactivity control when facilities shift to high-assay low-enriched uranium fuel. Euratom Supply Agency guidance in 2025 urged utilities to maintain two to three years of hafnium inventory, prompting bulk awards to Framatome’s Jarrie plant and ATI’s Yakima operations[1]Euratom Supply Agency, “Strategic Autonomy for Nuclear Materials,” euratom.ec.europa.eu . Western Zirconium has since reported a 17% rise in control-rod alloy shipments, while Canada’s OPG disclosed advance orders tied to its Darlington SMR build-out.
Aerospace Super-Alloy Substitution for Rhenium Under Cost Inflation
Nickel-based single-crystal turbine blades once used rhenium at up to 6 wt% for creep resistance, but spot rhenium remains above USD 1,000 /kg. Engine primes like Pratt & Whitney now qualify hafnium-rich derivatives such as CMSX-15H that lower total alloy cost 15-20% and withstand 1,100 °C combustor exit temperatures. ATI’s 2025 annual report flags doubled-digit tonnage growth for hafnium-bearing master alloys, supported by additive-manufacturing trials where laser powder-bed fusion permits intricate internal cooling channels that would be impossible in wrought super alloys. With Rolls-Royce and Safran adopting similar chemistries, aerospace metal purchases alone can lift hafnium market demand.
Additive-Manufacturing Shift Toward Hf-Rich Refractory Powders
Plasma-jet and laser-pyrolysis synthesis platforms unveiled by Skoltech and Tomsk Polytechnic generate sub-micron hafnium carbide powders while cutting energy input by about 25% relative to carbothermal reduction baselines. U.S. National Science Foundation-funded teams at Oak Ridge National Laboratory have fed the powders into directed-energy deposition printers to fabricate functionally graded rocket-nozzle inserts that pair hafnium-rich erosion faces with lighter zirconium backings. European AM service bureaus report that binder-jetting trials achieve near-full density after spark-plasma sintering, creating interest among gas-turbine makers for first-stage vane segments. Though powder-qualified volumes remain small, additive manufacturing pulls demand steadily upward.
Restraints Impact Analysis*
| Restraint | (~) % Impact on CAGR Forecast | Geographic Relevance | Impact Timeline |
|---|---|---|---|
| Volatile price spikes driven by China-centric refining capacity | -1.0% | Global, with acute effects in North America and Europe | Short term (≤ 2 years) |
| High CAPEX and energy intensity of fluorination separation routes | -0.7% | Global, particularly affecting new entrants in North America, Europe, Australia | Medium term (2-4 years) |
| ESG scrutiny on fluoride effluent emissions at refining clusters | -0.4% | China, Russia, and emerging refining hubs in Southeast Asia | Medium term (2-4 years) |
| Source: Mordor Intelligence | |||
Volatile Price Spikes Driven by China-Centric Refining Capacity
China continues to dominate a significant portion of the global zirconium-hafnium separation capacity. Recent export restrictions have substantially reduced shipments to Western buyers. According to Argus assessments, prices reached USD 6,600 per kg CIF Rotterdam, surpassing previous peaks. In response, European aerospace manufacturers increased inventory levels; however, working capital constraints led several tier-two suppliers to delay the expansion of additive manufacturing operations.
ESG Scrutiny on Fluoride Effluent Emissions at Refining Clusters
Chinese regulators tightened wastewater fluoride thresholds in 2025, compelling refiners to add ion-exchange and reverse-osmosis modules that raise operating costs by 8-12%[2]China Ministry of Ecology and Environment, “Industrial Wastewater Discharge Standard Update,” mee.gov.cn . Russia’s Chepetsky Mechanical Plant initiated pilot crystallization systems under state environmental audits, while Vietnam’s planned rare-earth zone faces environmental-impact-study delays related to fluoride discharge. Western aerospace and nuclear buyers have incorporated ESG scorecards into tender evaluations, with suppliers failing audits facing the risk of exclusion.
*Our forecasts treat driver/restraint impacts as directional, not additive. The impact forecasts reflect baseline growth, mix effects, and variable interactions.
Segment Analysis
By Type: Carbide Dominance Anchors Thermal-Protection Demand
Hafnium carbide accounted for 48.22% of the 2025 volume within the hafnium market size, underscoring its central role in reusable launch-vehicle heat-shield architecture and hypersonic glide-vehicle nose tips. The material’s oxidation stability above 2,000 °C and compatibility with silicon-based bond coats sustain entrenched adoption. Skoltech’s plasma synthesis trials lowered energy consumption compared with classic carbothermal reduction, hinting at cost ceilings that could stabilize prices once scaled. Hafnium oxide exhibits the fastest 6.11% CAGR through 2031 as semiconductor fabs widen extreme-ultraviolet (EUV) mirror fleets and oncology centers prepare for NBTXR3 commercialization. Metallic hafnium, indispensable for control rods, will track nuclear build rates, but volumes stay comparatively modest, causing market heterogeneity to widen over time.
Emerging design trends cement carbide’s dominance yet create room for oxide substitution. SpaceX’s decision to coat select Starship tiles with hafnium-silicon carbonitride blends could shift 2-3 tons annually toward hybrid UHTCs. In contrast, semiconductor capital-expenditure booms pull hafnium oxide into optical stacks for EUV pellicles at ASML suppliers in the Netherlands. Should oncology regulators clear additional indications for hafnium oxide radiosensitizers, medical demand could rival aerospace tonnage by 2030, diversifying revenue distribution inside the hafnium market.


By Application: Super Alloy Segment Absorbs Majority Share
Super alloy represented 57.41% of 2025 consumption, delivering the largest slice of the hafnium market share as turbine OEMs locked in supply contracts at price premiums to secure performance metals. The hafnium market size for super alloys is forecast to advance at a CAGR of 6.09% through 2031, reflecting ongoing jet-engine deliveries and retrofits that replace expensive rhenium. Additive manufacturing accelerates alloy pull-through by producing thin-walled blade cores with integrated cooling passages that are impractical via casting. Nuclear uses remain the second-largest sink; stockpile programs among U.S. and European utilities will plateau after 2028 yet still demand continuous replenishment as higher-burnup fuel cycles shorten control-rod life.
Optical-coating volumes are tied to semiconductor lithography cycles, and EUV tool shipments from ASML imply multi-year growth in high-purity hafnium oxide layers for multilayer mirrors. Plasma-cutting electrodes, consumed in industrial shipyards and steel fabs, provide a steady base but limited upside. Niche segments, industrial gas-turbine coatings, petrochemical catalysts, and battery anodes, offer optionality for producers to spread risk when aerospace cycles soften.
Geography Analysis
North America held 38.62% of 2025 volume and is projected to maintain a 5.72% CAGR through 2031, reflecting the region’s leadership in private launch, SMR deployment, and defense jet-engine production. The United States hosts ATI and Western Zirconium, giving local OEMs partial insulation from geopolitical disruptions, while Canada’s forthcoming Darlington SMR cluster adds incremental rod-alloy demand. Public-sector incentives such as the Department of Energy’s Critical Materials Institute grants channel research funds toward energy-efficient hafnium separation, potentially trimming import reliance over the decade.
Asia-Pacific consumption bifurcates between China’s captive ecosystem and import-dependent Japan, South Korea, and India. Chinese internal demand for aerospace engines and gigawatt-scale nuclear build-outs absorbs most domestic output, leaving little for export after 2024 restrictions. Japan’s semiconductor supply chain draws in oxide powders for EUV masks, while India’s Hindustan Aeronautics advances indigenous turbine-blade programs using hafnium-bearing CMSX derivative alloys. Australia’s Dubbo Project could deliver 20-30 tons annually by 2027, positioning the country as a non-Chinese supply hub that shortens freight lines to Asian buyers.
Europe relies on France’s Framatome Jarrie and Ugine sites for refined hafnium, feeding Airbus programs, semiconductor optics in Germany and the Netherlands, and nuclear customers across the continent. Sanctions limit Russia’s Chepetsky exports, and the International Energy Agency warns that 75% of critical-mineral prices now move more violently than Brent crude, spotlighting Europe’s exposure. Emerging demand pockets appear in the Middle-East, where the United Arab Emirates prepares follow-on Barakah units, and in Saudi Arabia’s space initiatives, but volumes stay minimal through 2031.

Competitive Landscape
The hafnium market remains moderately concentrated: the five largest refiners, Framatome, ATI, China Nuclear Energy Industry Corp., Australian Strategic Materials Ltd., and Elmet Technologies, control roughly 56% of global output. Framatome exploits vertical integration from zircon sand digestion to alloy forging, selling into both aerospace and nuclear channels. ATI’s specialty-alloy division covers North American defense and commercial airframe programs with ITAR-compliant supply agreements that span three to five years. Australian Strategic Materials will enter the top tier once Dubbo commissions, having secured offtakes with Korean Metals and a major U.S. engine OEM.
Downstream, processors such as American Elements, Elmet Technologies, Stanford Advanced Materials, and Phelly Materials compete on particle-size customization and purity. Additive-manufacturing ecosystem players collaborate with research institutes to validate powder flowability and oxidation controls, seeking to lock in early mover advantage as AM shifts from prototyping to serial production. Medical-grade oxide suppliers form another niche cluster; Nanobiotix partners with contract-manufacturing organizations that meet cGMP nanomaterial standards.
Strategic maneuvers concentrate on securing raw-zircon streams, co-locating solvent-extraction plants near cheap renewable energy, and deploying fluoride-effluent recycling to raise ESG scores. Western aerospace OEMs negotiated price-collar clauses that cap annual increases, while European nuclear utilities co-finance capacity expansions at Framatome in exchange for priority allocation. R&D alliances, such as a 2025 Memorandum of Understanding between Oak Ridge National Laboratory and ATI to develop low-energy chlorination, illustrate joint attempts to derisk supply amid continuing Chinese export uncertainty.
Hafnium Industry Leaders
ATI
Framatome (EDF)
Australian Strategic Materials Ltd.
Elmet Technologies
China Nuclear Energy Industry Corp.
- *Disclaimer: Major Players sorted in no particular order

Recent Industry Developments
- July 2025: Scientists from Nagoya University and Ming Chi University of Technology developed the first halogen-free, atomic-level etching method for hafnium oxide at room temperature. This advancement addressed the sustainability challenges of traditional semiconductor manufacturing by eliminating the use of toxic, halogen-based gases.
- March 2024: Nanjing Youtian Metal Technology Co., Ltd. commissioned a 510,000 sq. ft. facility for hafnium-zirconium separation, significantly enhancing the processing capacity of its subsidiary, Jiangsu Yichu New Materials. The plant specialized in high-purity zirconium and hafnium to support increased production within China's hafnium and zirconium industry.


Global Hafnium Market Report Scope
Hafnium is a lustrous grey metal that has a similar appearance to stainless steel and is chemically comparable to zirconium metal. The metal maintains its stability and strength at high temperatures in both metallic and compound forms and is used for various high-strength and high-temperature applications.
The hafnium market is segmented by type, application, and geography. By type, the market is segmented into hafnium carbide, hafnium oxide, and other types (including hafnium metal). By application, the market is segmented into super alloy, optical coating, nuclear, plasma cutting, and other applications. The report also covers the market size and forecasts for hafnium in 7 countries across the major regions. For each segment, the market sizing and forecasts have been done on the basis of volume (tons).
| Hafnium Carbide |
| Hafnium Oxide |
| Other Types (including Hafnium Metal) |
| Super Alloy |
| Optical Coating |
| Nuclear |
| Plasma Cutting |
| Other Applications |
| Production Analysis | France | |
| United States | ||
| China | ||
| Rest of the World | ||
| Consumption Analysis | Asia-Pacific | China |
| India | ||
| Japan | ||
| Rest of Asia-Pacific | ||
| North America | United States | |
| Rest of North America | ||
| Europe | France | |
| Germany | ||
| Russia | ||
| Rest of Europe | ||
| Rest of the World | ||
| By Type | Hafnium Carbide | ||
| Hafnium Oxide | |||
| Other Types (including Hafnium Metal) | |||
| By Application | Super Alloy | ||
| Optical Coating | |||
| Nuclear | |||
| Plasma Cutting | |||
| Other Applications | |||
| By Geography | Production Analysis | France | |
| United States | |||
| China | |||
| Rest of the World | |||
| Consumption Analysis | Asia-Pacific | China | |
| India | |||
| Japan | |||
| Rest of Asia-Pacific | |||
| North America | United States | ||
| Rest of North America | |||
| Europe | France | ||
| Germany | |||
| Russia | |||
| Rest of Europe | |||
| Rest of the World | |||


Key Questions Answered in the Report
What is the size of the hafnium market?
The hafnium market stands at 100.96 tons in 2026 and is set to reach 132.08 tons by 2031, reflecting a 5.52% CAGR from 2026-2031.
Which segment commands the largest hafnium market share in 2025?
Super alloy led with 57.41% of total consumption in 2025, driven by aerospace turbine demand.
How fast is hafnium oxide demand growing through 2031?
Hafnium oxide is the fastest rising type, expanding at a 6.11% CAGR through 2031 on semiconductor and medical uptake.
Which region will add the most incremental hafnium demand by 2031?
North America is forecast to add the highest incremental tonnage by 2031, supported by reusable launch vehicles and SMR programs.
Page last updated on:


