
Gunshot Detection Systems Market Size and Share
Market Overview
| Study Period | 2020 - 2031 |
|---|---|
| Market Size (2026) | USD 1.31 Billion |
| Market Size (2031) | USD 2.48 Billion |
| Growth Rate (2026 - 2031) | 13.66 % |
| Fastest Growing Market | Asia Pacific |
| Largest Market | North America |
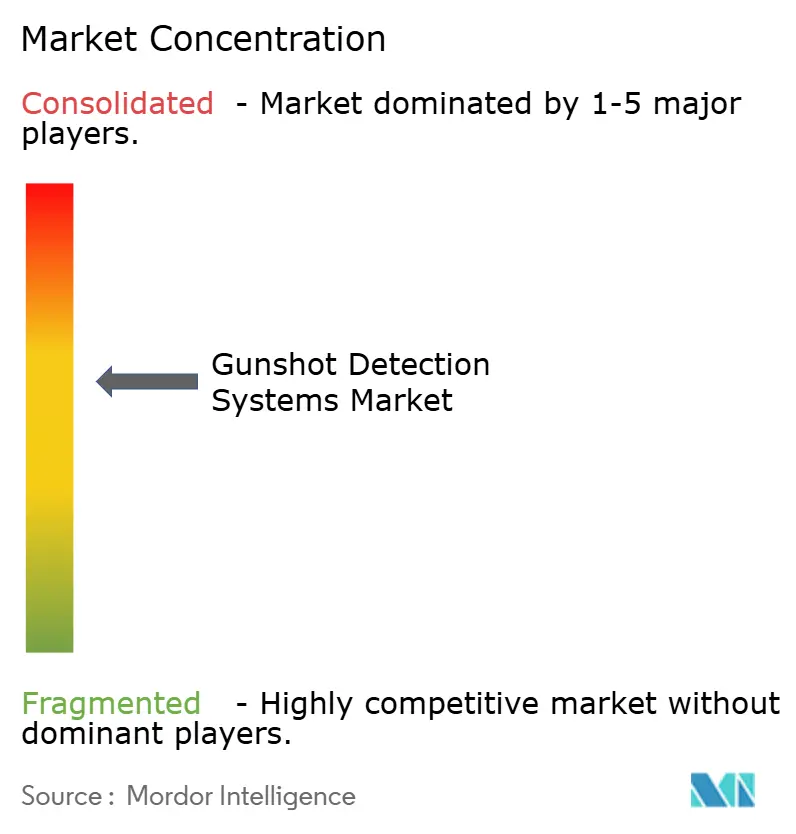
| Market Concentration | Medium |
Major Players *Disclaimer: Major Players sorted in no particular order Image © Mordor Intelligence. Reuse requires attribution under CC BY 4.0. | |
Gunshot Detection Systems Market Analysis by Mordor Intelligence
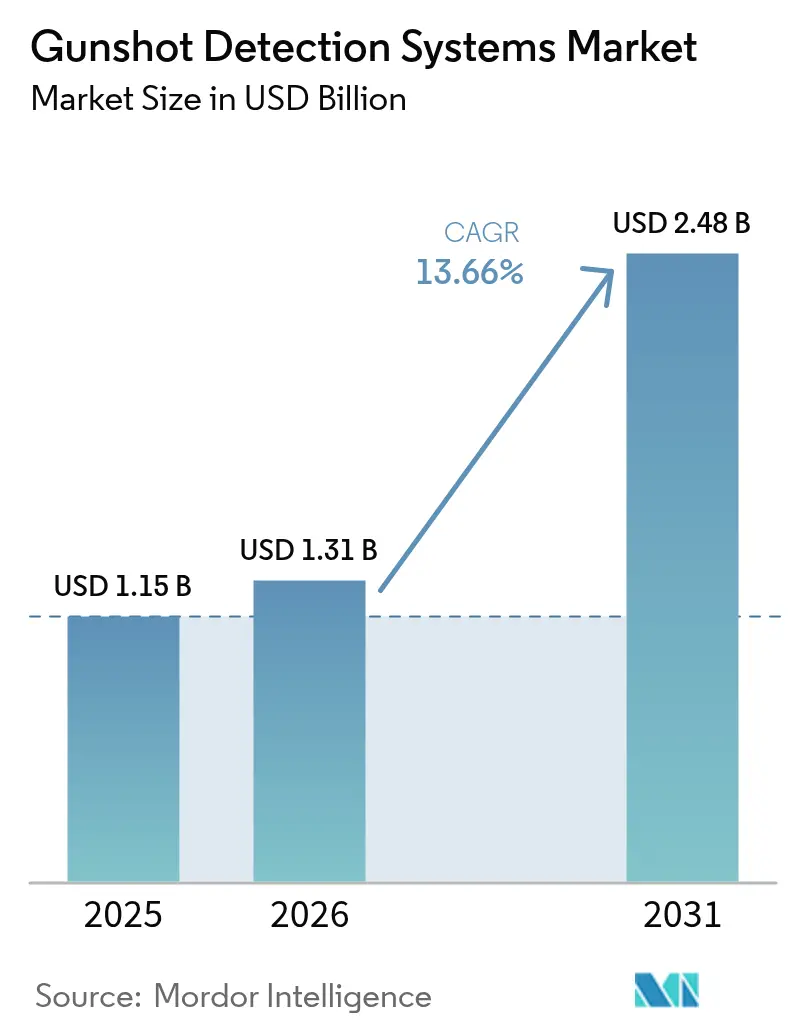
The gunshot detection system market size is expected to grow from USD 1.15 billion in 2025 to USD 1.31 billion in 2026 and is forecast to reach USD 2.48 billion by 2031 at 13.66% CAGR over 2026-2031. Uptake stems from rising urban gun violence, steady public-sector funding, and the proven ability of dual-sensor platforms to cut false alerts. Providers have pivoted from hardware sales to subscription services, giving municipalities access to continuous upgrades without large capital outlays. Technology convergence with video analytics, autonomous drones, and real-time crime-center platforms expands the market’s addressable footprint into education, critical infrastructure, and battlefield awareness. North America leads with wide-area city deployments and strong grant pipelines, while Asia-Pacific is accelerating on the back of smart-city spending and domestic sensor innovation.
Key Report Takeaways
- By application, outdoor environments held 59.74% of the gunshot detection system market share in 2025; indoor deployments are projected to grow at a 11.22% CAGR through 2031.
- By installation, fixed systems commanded 52.10% of the gunshot detection system market in 2025; soldier-mounted units are forecasted to expand at a 15.21% CAGR between 2026 and 2031.
- By solution, integrated systems led with 63.34% revenue share in 2025, while subscription services are advancing at a 14.12% CAGR to 2031.
- By end-user, law-enforcement agencies accounted for 48.62% of the gunshot detection system market share in 2025; campuses and educational institutions are poised to post a 13.97% CAGR to 2031.
- By geography, North America represented 40.15% of the gunshot detection system market in 2025, whereas Asia-Pacific is set to record a 9.12% CAGR during the forecast period.
Note: Market size and forecast figures in this report are generated using Mordor Intelligence’s proprietary estimation framework, updated with the latest available data and insights as of 2026.
Market Trends and Insights
Drivers Impact Analysis of Gunshot Detection Systems Market*
| Driver | (~) % Impact on CAGR Forecast | Geographic Relevance | Impact Timeline |
|---|---|---|---|
| Escalating gun-related violence in major cities | +4.1% | North America, Latin America, select European urban centers | Short term (≤ 2 years) |
| Growing federal and municipal safety-tech grants | +3.4% | North America, Western Europe | Medium term (2-4 years) |
| Accuracy gains from acoustic and IR sensor fusion | +2.7% | Global, with emphasis on developed markets | Medium term (2-4 years) |
| Modernization of soldier situational-awareness kits | +2.0% | North America, Middle East, Europe | Long term (≥ 4 years) |
| Insurance-premium discounts for protected sites | +1.4% | North America, Western Europe | Medium term (2-4 years) |
| Real-time-crime-centre demand for API-ready feeds | +1.1% | North America, select European and Asian urban centers | Medium term (2-4 years) |
| Source: Mordor Intelligence | |||
Escalating gun-related violence in major cities
Cities experiencing higher firearm incidents are adopting detection networks as first-line infrastructure. The US recorded 40,886 gun-violence deaths and 31,652 injuries in 2024, creating a USD 557 billion economic burden. Only 15% of gunfire was reported through 911 in San Francisco, but audio sensors captured the remainder, supplying dispatchers with geolocated alerts in under a minute.[1]San Francisco Police Department, “Surveillance Technology Policy: Audio Recorder – ShotSpotter,” sanfranciscopolice.orgIndependent clinical research also showed transport times for gunshot victims falling from 4 minutes to 2 minutes after deployment, improving survival odds. These benefits strengthen the funding case for additional square-mile coverage.
Growing federal and municipal safety-tech grants
Dedicated grant programs are lowering adoption barriers for mid-sized jurisdictions. Several US states have ring-fenced awards for AI-enabled gun detection in K-12 facilities, alongside city-level allocations that cover subscription fees. A national technology assessment underscored the importance of solutions with open APIs and CAD integration, further steering awards toward interoperable vendors.[2]US Department of Homeland Security, “Gunshot Detection System Operational Field Assessment Report,” dhs.gov
Accuracy gains from acoustic and IR sensor fusion
Dual-sensor nodes that fuse acoustic shock-wave signatures with infrared muzzle-flash recognition now reach 99.9% accuracy in live-fire testing, driving advancements in the Gunshot Detection Systems Market. Patented algorithms analyse the two streams concurrently, enabling reliable classification even when alarms or fireworks occur simultaneously. The performance jump has renewed buyer confidence and broadened suitability for dense indoor venues.
Modernization of soldier situational-awareness kits
Lightweight, shoulder-worn detectors localise sniper fire in under 0.25 seconds and feed coordinates to helmet displays, supporting innovation in the Gunshot Detection Systems Market by enhancing small-unit survivability. Defence ministries are embedding these modules into broader digital soldier programs, creating a pathway for ruggedised, low-power chips that later migrate into civilian products.
Restraints Impact Analysis of Gunshot Detection Systems Market*
| Restraint | ( ~ ) % Impact on CAGR Forecast | Geographic Relevance | Impact Timeline |
|---|---|---|---|
| High capex and OPEX for multi-node deployments | -4.1% | Global, particularly emerging markets | Medium term (2-4 years) |
| Evidentiary reliability and false-alert concerns | -2.7% | North America, Europe | Short term (≤ 2 years) |
| Privacy/civil-liberty litigation risk | -2.0% | North America, Europe | Medium term (2-4 years) |
| Budgets shifting to multi-sensor drone platforms | -1.4% | North America, Middle East | Medium term (2-4 years) |
| Source: Mordor Intelligence | |||
High deployment costs challenge widespread adoption
Traditional networks cost USD 65,000–95,000 per square mile each year, limiting roll-out beyond large cities. Subscription models that convert capital to operating expense are gaining traction, while edge-processing units such as the ATD-300 cut server loads and sensor counts, lowering total cost of ownership.
Evidentiary reliability and false-alert concerns
Academic evaluations in several US cities found some alerts 15% more likely to be unfounded than comparable 911 calls, prompting court scrutiny over evidentiary use.[3]Eric L. Piza, “Assessing ShotSpotter Deployments,” nij.ojp.govCivil-liberty advocates have also questioned continuous ambient recording, triggering policy debates on retention periods and audit trails. Vendors are countering with stricter human review and transparent audit logs to sustain user trust.
*Our forecasts treat driver/restraint impacts as directional, not additive. The impact forecasts reflect baseline growth, mix effects, and variable interactions.
Gunshot Detection Systems Market Segment Analysis
By Application:
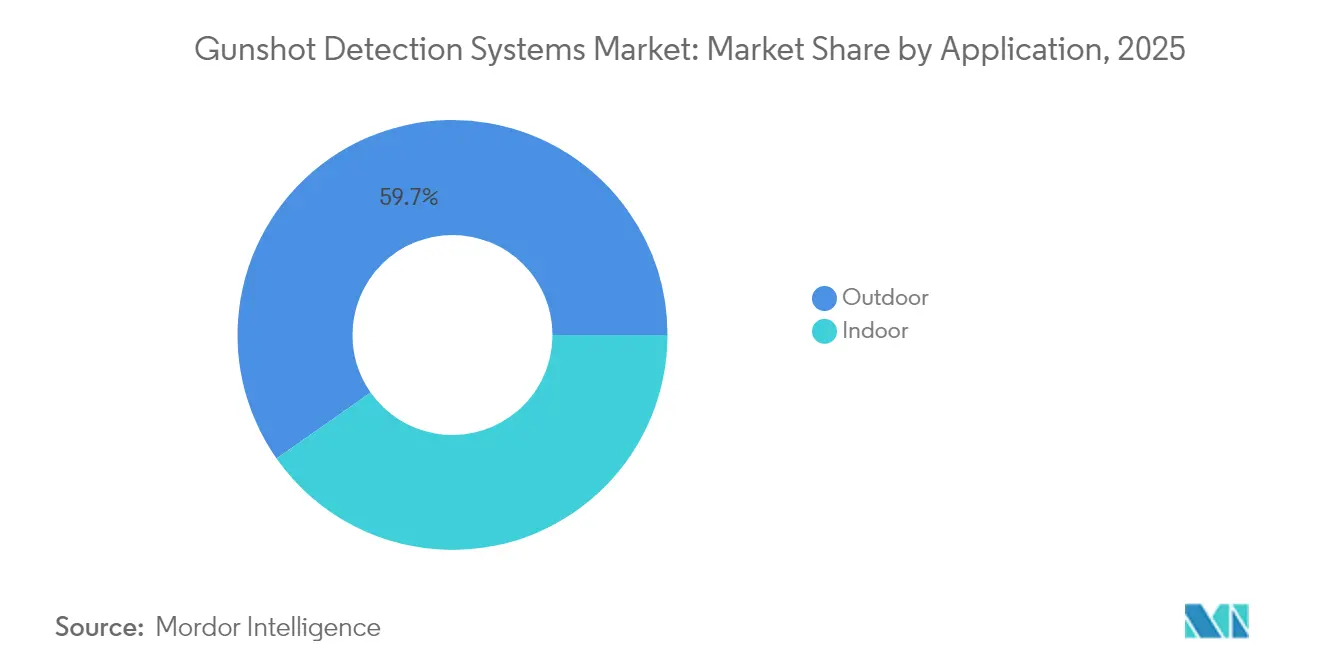
Outdoor Nodes Anchor Market LeadershipOutdoor deployments accounted for 59.74% of 2025 revenue, cementing their status as the primary layer of urban gunfire intelligence. Wide-area mesh arrays triangulate shock waves across alleys, parks, and arterial roads, filling the 85% reporting gap detected in city data sets. Linking alerts to surveillance cameras enables joint audio-visual verification, giving patrols actionable evidence within 60 seconds. This integration supports the broader smart-city mandate to overlay disparate sensors on a unified command platform.
Indoor solutions are accelerating at a 11.22% CAGR as education boards, arenas, and corporate campuses respond to rising active-shooter incidents. Dual acoustic-infrared devices such as Guardian achieve 99.9% in-situ accuracy, even in echo-rich hallways. Pilot studies in school corridors using laboratory-calibrated microphones further improved classification to 99.99% accuracy, setting a new benchmark for enclosed-space performance. Combining alerts with building-automation systems triggers lockdowns and mass-notification channels, extending value beyond first response.



By Installation:
Fixed Infrastructure Provides Baseline CoverageFixed installations represented 52.10% of the gunshot detection system market size in 2025 due to their suitability for high-density neighborhoods. City agencies value their continuous monitoring and integration with existing fibre backbones. Data from police audits showed only 15% of outdoor gunfire reached emergency lines, highlighting the importance of fixed nodes in capturing silent incidents.
Soldier-mounted and portable formats are projected to log a 15.21% CAGR as defence forces prioritise compact situational-awareness gear. Shoulder-worn sensor packs weighing under 230 grams communicate with radio headsets, improving survivability during urban operations. Vehicle-mounted arrays round out the category, giving patrol cars and armored transports on-the-move detection that feeds automatically into dispatch consoles for route adjustment.
By Solution:
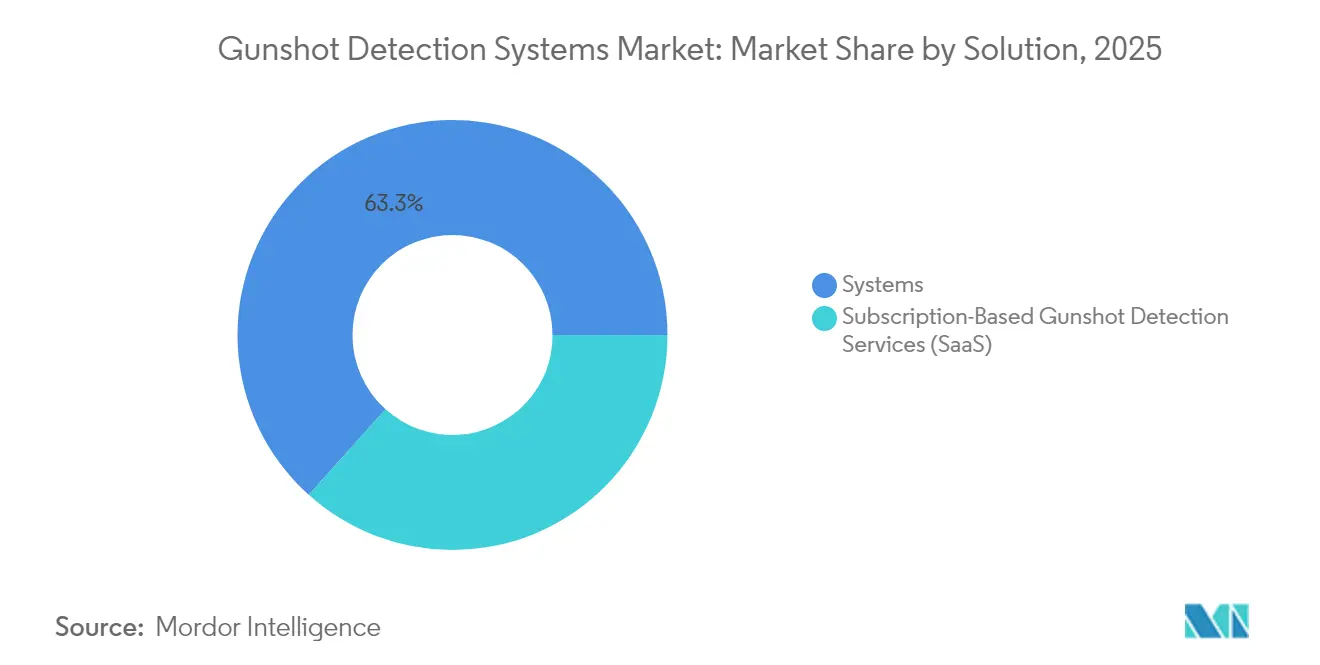
Systems Remain Dominant, Services SurgeIntegrated hardware-software packages still delivered 63.34% of 2025 spending, supported by long-planned infrastructure projects. Vendors embed sophisticated classifiers in these nodes, filtering fireworks, exhaust pops, and slamming dumpsters with sub-second latency. The installed base reassures city councils evaluating future upgrades.
Services, however, are advancing at a 14.12% CAGR on the back of SaaS contracts that bill by square mile. Annual subscriptions include cloud analytics, firmware updates, and 24/7 human review, converting unpredictable maintenance into predictable operating budgets. A leading provider now covers 1,076 square miles across 177 cities and 20 universities, underscoring the scaling advantages of a service model.
By End-User:
Law Enforcement Dominates, Education Rises FastLaw-enforcement agencies held 48.62% of the gunshot detection system market share in 2025. Deployments feed real-time alerts to computer-aided dispatch software, letting officers arrive sooner and collect shell casings before they are removed by weather or pedestrians. Data-rich heat maps guide resource allocation and community-based interventions.
Campuses are the fastest-growing buyer group at a 13.97% CAGR, propelled by 330 reported school shootings in 2024. Districts are layering gunshot sensors onto existing camera networks to satisfy state-level grant requirements that mandate verified solutions. Homeland-security certifications and low false-alert metrics influence procurement scoring, driving vendors to publish peer-reviewed validation reports.
Geography Analysis
North America Gunshot Detection Systems Market
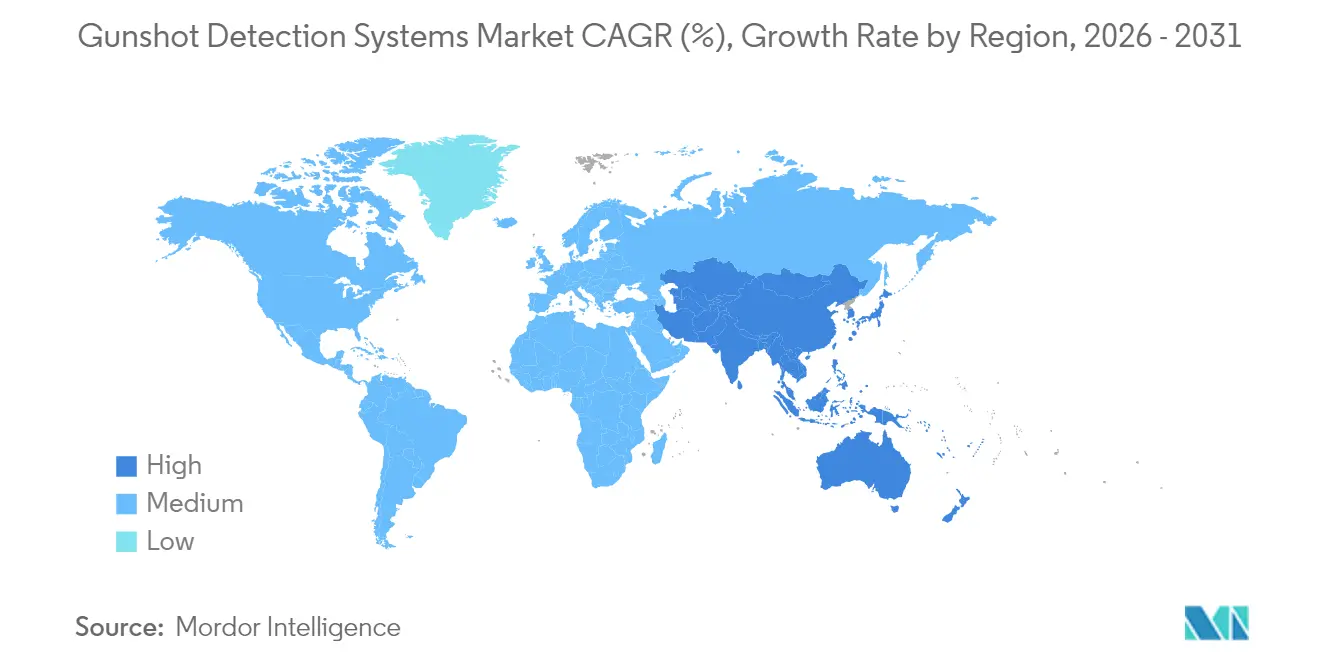
North America generated the largest share at 40.15% in 2025. Persistent firearm incidents, combined with federal programmes such as the Justice Assistance Grant, underpin continuous spending on the gunshot detection system market expansion. Integration with real-time crime centers in New York, Chicago, and San Francisco demonstrates operational maturity, while philanthropic funding streams expand coverage into underserved neighborhoods.
Europe Gunshot Detection Systems Market
Europe is characterised by strong privacy frameworks that shape deployment design. Vendors must accommodate data-minimisation rules and limited retention periods, favouring edge-processed alerts rather than continuous recording. Uptake among metropolitan police services in the United Kingdom, France, and the Netherlands focuses on protecting transit hubs and tourist districts.
APAC Gunshot Detection Systems Market
Asia-Pacific is projected to post the fastest regional CAGR of 9.12% as smart-city programs roll out in China, India, and Southeast Asia. Domestic sensor makers benefit from government incentives, and rising urbanisation heightens demand for scalable perimeter security. Defence ministries in the region are also trialling soldier-mounted variants, borrowing from the US and European battlefield experience.
South America and MEA Gunshot Detection Systems Market
South America faces high homicide rates in several capitals, which is driving municipal pilots despite constrained budgets. Subscription plans that bypass heavy upfront costs are gaining traction. The Middle East and parts of Africa adopt the technology mainly to safeguard critical energy infrastructure and large-scale events, often bundling gunshot detection with drone surveillance for rapid interdiction.

Regulatory Landscape
Regulation for gunshot detection systems is increasingly shaped by local surveillance-governance frameworks that condition deployment on documented use policies, public review, and periodic audits. In the United States, city-level oversight has translated into formal requirements such as Surveillance Technology Specification Reports (STSR) and council approvals for acoustic gunfire systems, as reflected in Detroit documentation. Agencies such as the NYPD have also published impact and use policies that restrict access to audio and define retention and sharing controls.
On the defense and cross-border side, vendors must manage export-control exposure for dual-use configurations. US export-control rules tied to the United States Munitions List (USML) can affect certain defense-oriented detection and localization technologies and their associated software, which increases compliance burdens for suppliers serving both military and civil customers. At the same time, evidentiary reliability and privacy litigation risk continues to influence operating policies and procurement scoring, which keeps audit trails, human review workflows, and clear limitations on voice-surveillance use cases at the center of adoption decisions.
Value Chain Analysis
The value chain begins with component sourcing and node manufacturing (acoustic microphones, optional infrared sensors, GPS timing, edge compute modules, communications), then moves to algorithm development and integration into command-and-control environments. Defense and homeland-security deployments place added emphasis on ruggedization, EMI/EMC considerations, and interoperability with C4I/BMS and tactical radios, while municipal deployments prioritize CAD integration, real-time crime center feeds, and policy-compliant data handling. Providers include specialist and defense-oriented suppliers such as SoundThinking, Acoem (ATD series), Thales (Acusonic), ASELSAN (SEDA series), and QinetiQ (EARS systems), together with integrators and distributor networks that package installation and service delivery.
Procurement and downstream delivery typically rely on public tenders, cooperative purchasing vehicles, and long-term service contracts that bundle monitoring, analytics, firmware updates, and support. For example, Wytec International obtained access to a multi-state cooperative purchasing channel (TXShare), widening the route-to-market for public agencies, while defense demand signals appear in US government contract activity tied to sensing technologies supporting C5ISR. Operations and maintenance, including continuous classification tuning and human review, are recurring elements of the chain, reinforcing the shift from one-time hardware sales toward subscription and renewal-led revenue.
Competitive Landscape
The gunshot detection system market features a moderate concentration, with roughly a dozen vendors splitting most contracts. Leading specialist SoundThinking operates the largest cloud-review center, processing over 328,000 gunfire events in 2024. Defence primes like Raytheon BBN and Thales capitalise on deep acoustics research to serve military and homeland-security clients. QinetiQ maintains an edge in wearable soldier solutions, supplying over 19,500 systems globally.
Strategic alliances are expanding distribution reach. PSA Security Network recently added Shooter Detection Systems to its integrator catalogue, enabling 700-plus members to quote turnkey projects. Alarm.com’s acquisition of Shooter Detection Systems extended its ecosystem of connected-building services, signaling convergence between traditional intrusion detection and active-shooter mitigation. Edge-AI entrants like Acoem deliver single-sensor nodes that clip into existing Ethernet drops, lowering installation complexity and challenging multi-sensor incumbents.
Vendors differentiate on false-alert rates, API openness, and evidence-grade logging. Certification by agencies such as the US Department of Homeland Security (DHS) is now a common bid requirement, favouring companies with transparent testing data. As the market scales, consortium standards on data exchange and audit formats will likely push laggards toward collaboration or acquisition.
Gunshot Detection Systems Industry Leaders
SoundThinking, Inc.
Shooter Detection Systems LLC
Raytheon BBN (RTX Corporation)
QinetiQ Group plc
ACOEM Group
- *Disclaimer: Major Players sorted in no particular order
Gunshot Detection Systems Market Companies Covered in this Report
- SoundThinking, Inc.
- Raytheon BBN (RTX Corporation)
- Thales Group
- QinetiQ Group plc
- ASELSAN A.S.
- ACOEM Group
- Databuoy Corporation
- Microflown AVISA
- Israel Aerospace Industries Ltd.
- Rafael Advanced Defense Systems Ltd.
- Rheinmetall AG
- Shooter Detection Systems LLC
- Safety Dynamics, Inc.
- EAGL Technology, Inc.
- Louroe Electronics, Inc.
- Pelco (Motorola Solutions, Inc.)
- AmberBox, Inc.
- Nextivity, Inc.
- Knightscope, Inc
- Omnilert LLC

Market Opportunities and Future Outlook
Service renewals and policy-compliant deployments create a near-term whitespace in jurisdictions that prefer operating-expense procurement and measurable outcomes rather than large upfront infrastructure purchases. SoundThinking disclosed multiple multi-year ShotSpotter customer renewals completed in Q2 2026, and municipal contracting activity such as the City of Richmond's five-year ShotSpotter Flex award shows continued willingness to fund detection as a managed service. This environment supports vendors that can document auditability, integrate with CAD and real-time crime centers, and reduce false alerts through sensor fusion and human verification.
Defense modernization and multi-threat sensing requirements are also broadening adjacent demand for portable and passive acoustic localization, including systems designed to function under electronic-warfare constraints. The UK Ministry of Defence contract under Project SERPENS for Leonardo UK's SONUS highlights active procurement for acoustic weapon-location capability, while US solicitation activity for wearable and fabric-based sensing points to convergence between gunshot detection and broader acoustic-event detection, including sUAS-related signatures. Together, these programs support product roadmaps around lighter form factors, edge AI, and secure integration into tactical and civilian security stacks without continuous ambient recording dependencies.
Recent Industry Developments in Gunshot Detection Systems Market
- July 2026: SoundThinking announced multiple multi-year ShotSpotter customer renewals completed during Q2 2026, totaling more than USD 23 million in contract value and including extensions through 2029 for certain agencies. The set of renewals reinforces the market shift toward subscription-led deployments where cities fund continuous analytics, support, and upgrades through multi-year service commitments.
- March 2025: Shooter Detection Systems announced an integration with Genea Security to connect indoor gunshot detection events to a cloud access-control platform used in higher education and other facilities. The linkage supports faster automated workflows such as lockdown and incident coordination, and it positions gunshot detection as a native component inside broader building-security operating systems.
- May 2024: Shooter Detection Systems joined the PSA Security Network as a technology partner to expand access to its active shooter intelligence solutions through a large integrator ecosystem. Wider integrator availability reduces friction for commercial and campus deployments by packaging design, installation, and ongoing support into established procurement channels.


Gunshot Detection Systems Market Report Scope and Research Methodology
Market Definition and Coverage
For this study, the gunshot detection system market covers solutions that detect firearm discharges and send an alert with a location estimate to responders, using dedicated sensing hardware plus supporting software and services.
Scope exclusions: We exclude solutions that rely only on video analytics or crowd-sourced mobile alerts without dedicated gunfire sensors.
Segments Covered in This Report
- By Application
- Indoor
- Outdoor
- By Installation
- Fixed
- Vehicle-Mounted
- Soldier-Mounted/Portable
- By Solution
- Systems
- Subscription-Based Gunshot Detection Services (SaaS)
- By End-User
- Defense and Military
- Law Enforcement Agencies
- Commercial and Critical Infrastructure
- Campus and Educational Institutions
- By Geography
- North America
- United States
- Canada
- Mexico
- South America
- Brazil
- Rest of South America
- Europe
- Germany
- United Kingdom
- France
- Italy
- Russia
- Rest of Europe
- Asia-Pacific
- China
- India
- Japan
- South Korea
- Australia
- Rest of Asia-Pacific
- Middle East and Africa
- Middle East
- Saudi Arabia
- United Arab Emirates
- Turkey
- Rest of Middle East
- Africa
- South Africa
- Rest of Africa
- Middle East
- North America
Data Sources, Market Sizing, and Validation
Desk Research
Desk work started with building a clean view of demand-side signals and public funding patterns linked to public safety technology purchases. We used sources such as the FBI crime data program, the Bureau of Justice Statistics, and public procurement portals to understand where deployments are more likely and how budgets tend to shift year to year.
We also reviewed standards and testing related material for acoustic sensing where available, plus public technical papers and patents to map what is feasible in indoor and outdoor conditions. On the supply side, we relied on public company filings, investor materials, press releases, and association websites to capture product positioning and typical go-to-market motions. For cross-checking trade and shipment clues on sensor electronics, we referenced an import/export shipment-level database and a patent database subscription, which helped sanity-check timing and activity levels. These desk sources are illustrative only, and other public and paid references were used during data collection, validation, and clarification.
Primary Interviews and Surveys
Primary interviews and surveys were run with a mix of solution providers, integrators, and users across law enforcement, defense, and commercial or critical infrastructure. Discussions focused on typical deployment sizes, annual subscription behavior, replacement cycles, and what is usually bundled with installations, which then helped confirm desk assumptions and close gaps where public data is thin. For a global view, coverage was balanced across major regions so we could test whether adoption drivers were local or broadly consistent.
Distribution of primary research fieldwork respondents
| Company type | Respondent position | Region |
|---|---|---|
| Top tier: 25% | CXOs: 17% | APAC: 44% |
| Mid tier: 58% | Functional/Unit leaders: 35% | EMEA: 35% |
| Smaller Players: 17% | Managers: 48% | Americas: 21% |
Market-Sizing & Forecasting
Sizing was built with a top-down and bottom-up structure, where the demand pool is first reconstructed using public safety spending signals and deployment intensity, then totals are checked against selective supplier-side math. In practice, we estimated addressable sites and coverage needs by geography, then applied adoption and renewal behavior that was confirmed in interviews, which anchored the final market value.
Key inputs used in the model included the mix of indoor versus outdoor deployments, average area coverage per sensor node, typical software subscription attachment rates, renewal and churn expectations, and installation cycle timing tied to municipal budgeting. We also tracked the relative share of fixed versus vehicle or portable installations because pricing and service intensity differ. For forecasts, scenario analysis was used around public funding availability and large program timing, and assumptions were tuned using expert consensus on how quickly deployments scale after proof-of-value. Where bottom-up checks had gaps, we filled them with conservative ranges for typical price bands and deployment density, then narrowed the range after follow-up validation.
Data Validation & Update Cycle
Outputs were validated through triangulation across demand signals, supply-side disclosures, and what interviewees described as realistic deployment and pricing patterns. When the model produced unusual jumps by region or by installation type, the inputs were rechecked and the logic was reviewed again before sign-off, and then relevant experts were re-contacted if a variance could not be explained.
We refresh the report annually, and interim updates are made when material events shift adoption or pricing (such as major public programs, regulatory changes, or large contract awards). Before delivery, an analyst runs a fresh pass on key assumptions so clients receive the most current view available at that time.
Mordor Intelligence's Gunshot Detection System Market Size Compared Against Other Published Estimates
Published market values for gunshot detection systems can differ even when they cover the same topic, because included solution types and revenue lines are not always consistent. Differences also come from the year used for sizing, the way subscription revenue is recognized, and how quickly adoption is assumed to spread beyond early municipal deployments.
Video-only gunfire recognition tools sit outside Mordor Intelligence's scope, which is why its 2026 value can look higher or lower than estimates that bundle broader video analytics into the same bucket. Other gaps usually come from whether subscription revenue is counted as full contract value versus annualized revenue, how mixed deployments (fixed versus vehicle or portable) are priced, and whether forecasts assume grant funding continues at an aggressive pace without a reality check from procurement timing.
Benchmark comparison
| Source | Market Size | Gaps in Research Methodology |
|---|---|---|
| Mordor Intelligence | USD 1.31 B (2026) | |
| Global Advisory A | USD 1.16 B (2024) | Uses an earlier base year and appears to weight near-term hardware shipments more heavily, which can understate the annualized value of subscription and monitoring revenue in citywide deployments. |
| Industry Tracker B | USD 0.96 B (2024) | Likely applies a narrower definition closer to core acoustic hardware, and may exclude or discount software, integrations, and ongoing service revenue, which lowers the stated market value. |
The spread in published numbers is mostly explained by what gets counted as part of the system, how recurring revenue is treated, and whether the sizing year lines up with the same demand cycle. By keeping inputs traceable to deployment intensity, subscription attachment, and realistic procurement timing, the estimate remains easier to reproduce and to stress-test when assumptions change.


Key Questions Answered in the Report
What is the current size of the gunshot detection system market?
The market was valued at USD 1.31 billion in 2026 and is projected to reach USD 2.48 billion by 2031, reflecting a 13.66% CAGR.
Which end-user segment is expanding the fastest?
Educational institutions are forecast to grow at a 13.97% CAGR as schools integrate dual-sensor platforms into broader campus-safety ecosystems.
How accurate are modern gunshot detection systems?
Systems that combine acoustic and infrared sensing achieve up to 99.9% accuracy in live-fire tests, sharply reducing false alerts and boosting user confidence.
Why are cities opting for subscription rather than outright system purchases?
Subscription models convert capital costs into predictable operating expenses and include continuous software and firmware upgrades, easing budget approval.
Which geographic market is expected to record the highest growth rate through 2031?
Asia-Pacific is set to lead growth at a 9.12% CAGR, driven by smart-city investments and increasing urban security concerns.
What factors limit wider adoption in smaller municipalities?
High per-square-mile costs and concerns over evidentiary reliability create barriers, although newer edge-processed devices and grants are beginning to offset these challenges.
Page last updated on:





