Guar Gum Market Size and Share
Market Overview
| Study Period | 2021 - 2031 |
|---|---|
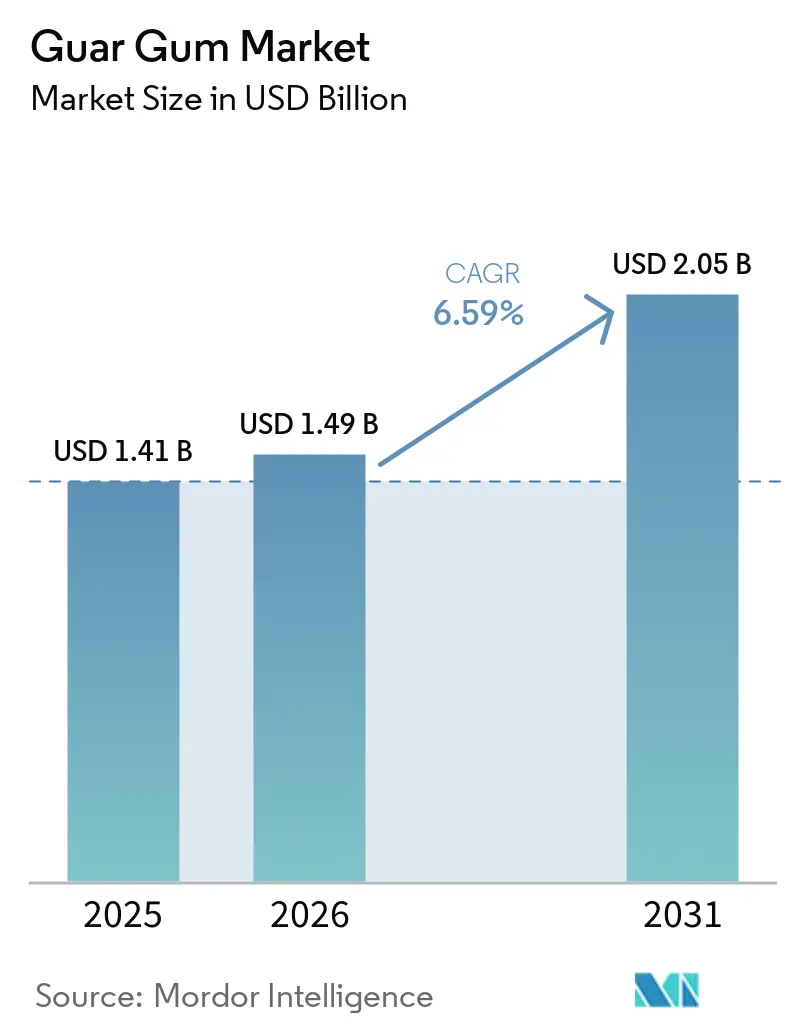
| Market Size (2026) | USD 1.49 Billion |
| Market Size (2031) | USD 2.05 Billion |
| Growth Rate (2026 - 2031) | 6.59% CAGR |
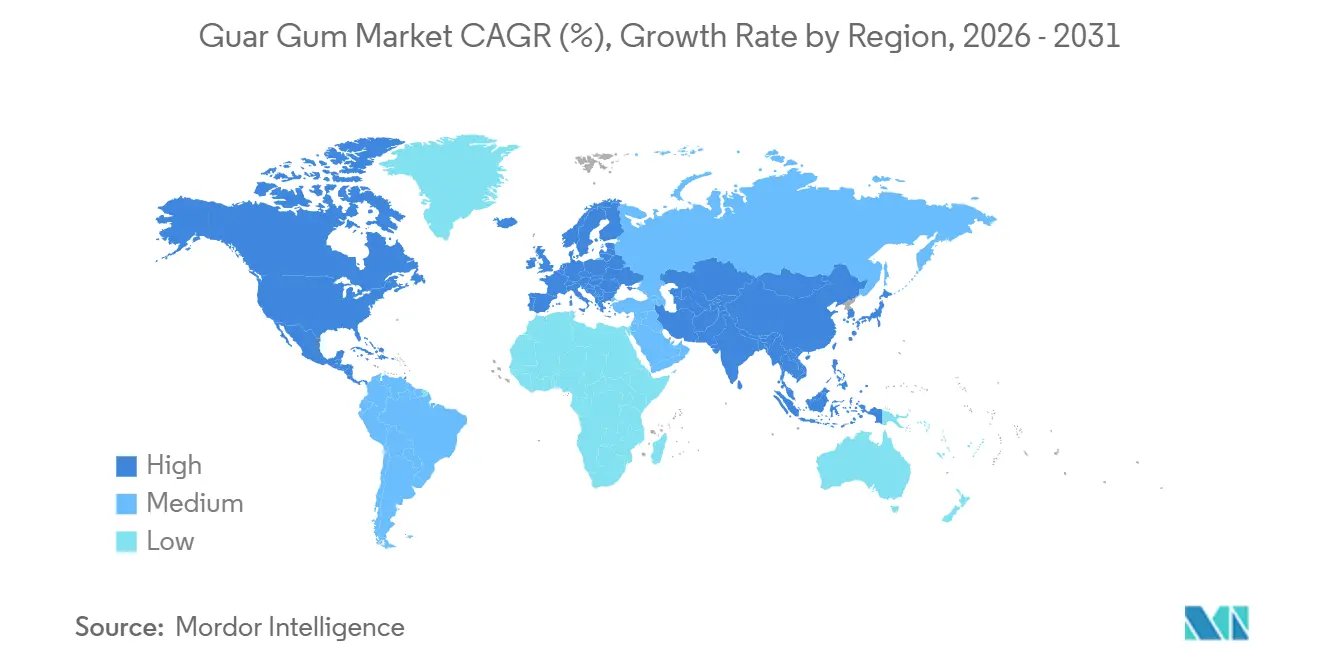
| Fastest Growing Market | Asia-Pacific |
| Largest Market | North America |
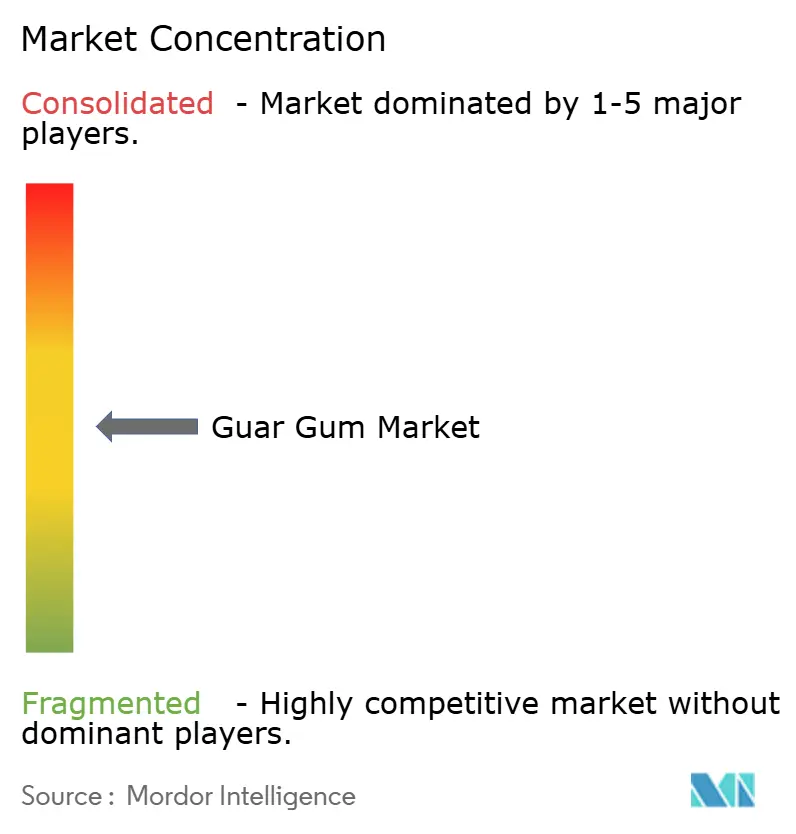
| Market Concentration | Medium |
Major Players
*Disclaimer: Major Players sorted in no particular order Image © Mordor Intelligence. Reuse requires attribution under CC BY 4.0. |
|
Guar Gum Market Analysis by Mordor Intelligence
The Guar gum market size is expected to grow from USD 1.41 billion in 2025 to USD 1.49 billion in 2026 and is forecast to reach USD 2.05 billion by 2031 at 6.59% CAGR over 2026-2031. Demand spreads across food, pharmaceuticals, personal care, and high-temperature oilfield operations as clean-label regulation and natural-polymer preferences displace synthetic rheology modifiers. Rising uptake of modified guar derivatives in hydraulic fracturing, ophthalmic gels, and low-calorie foods supports robust value expansion even when volumetric growth moderates. Integrated traceability programs under the EU Deforestation Regulation and similar frameworks in North America reward processors that document responsible farming in Rajasthan and Gujarat, converting a once-commodity thickener into a strategic ESG ingredient. Market fragmentation among Indian processors and large multinational ingredient platforms keeps price discovery volatile, yet derivative innovation lifts margins and buffers growers from monsoon-driven seed swings.
Key Report Takeaways
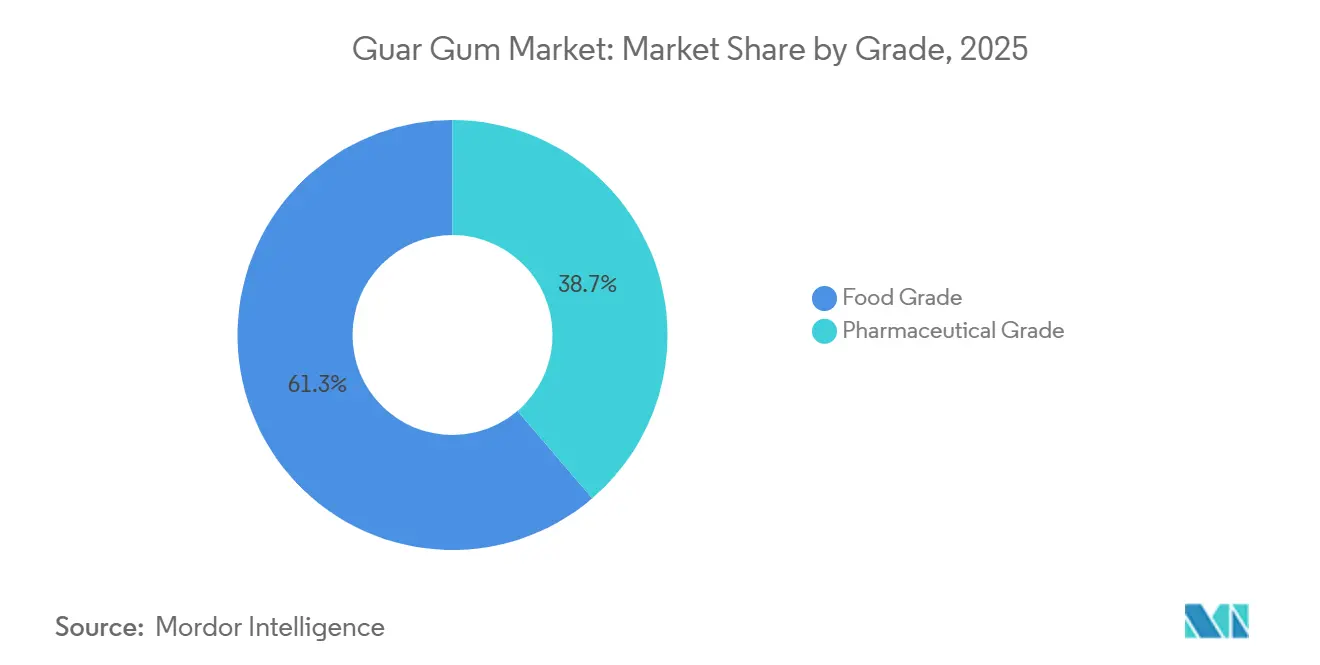
- By grade, food grade held 61.27% of the market share in 2025, while pharmaceutical grade is forecast to post a 7.27% CAGR through 2031.
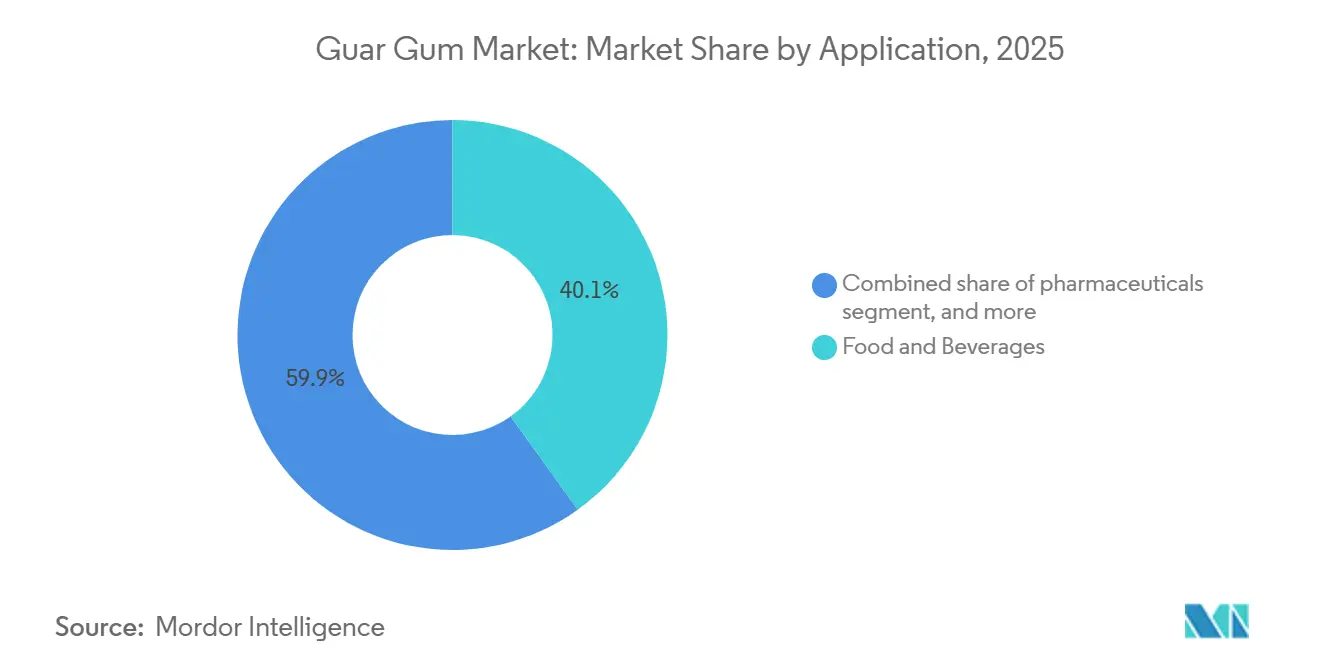
- By application, food and beverages led with 40.11% revenue share in 2025; pharmaceuticals is projected to expand at an 8.35% CAGR between 2026-2031.
- By geography, North America retained 38.91% share in 2025; Asia-Pacific is advancing at a 9.82% CAGR to 2031.
Note: Market size and forecast figures in this report are generated using Mordor Intelligence’s proprietary estimation framework, updated with the latest available data and insights as of January 2026.
Global Guar Gum Market Trends and Insights
Drivers Impact Analysis*
| Driver | (~) % Impact on CAGR Forecast | Geographic Relevance | Impact Timeline |
|---|---|---|---|
| Increasing demand for natural and plant-based food additives | +1.2% | Global, with early gains in Europe, North America, urban Asia-Pacific | Medium term (2-4 years) |
| Growing use of guar gum in bakery, dairy, and confectionery products | +0.9% | North America, Europe, Asia-Pacific (India, China) | Short term (≤ 2 years) |
| Surging demand for functional and low-calorie food options | +0.8% | North America, Europe, Japan | Medium term (2-4 years) |
| Expansion of pharmaceutical and personal care applications | +1.5% | Asia-Pacific core, spill-over to North America and Europe | Long term (≥ 4 years) |
| Technological advancements in modified guar gum derivatives for specialized applications | +1.3% | North America , Asia-Pacific, Europe | Long term (≥ 4 years) |
| Rising demand in industrial and technical applications due to cost-effectiveness | +0.7% | Asia-Pacific, Middle East, North America | Short term (≤ 2 years) |
| Source: Mordor Intelligence | |||
Increasing demand for natural and plant-based food additives
The increasing demand for natural and plant-based food additives is a key driver of the guar gum market, supported by shifting consumer preferences toward clean-label and minimally processed products. Guar gum, being a plant-derived hydrocolloid obtained from guar beans, aligns well with this trend as it is perceived as a safe, natural alternative to synthetic additives. Food manufacturers are increasingly incorporating guar gum in bakery, dairy, sauces, and ready-to-eat products to enhance texture and stability while maintaining clean-label claims. This shift is further reinforced by growing consumer awareness around ingredient transparency and health-conscious consumption patterns. According to the International Food Information Council’s 2024 report, 26% of U.S. consumers associate “natural” and “organic” labels with improved food safety, highlighting the strong trust attached to such claims[1]Source: International Food Information Council, “2024 IFIC Food & Health Survey", foodinsight.org. This perception has significantly boosted the acceptance of natural ingredients like guar gum in food formulations. Additionally, the rise of plant-based and gluten-free diets has expanded its application scope across innovative food products.
Growing use of guar gum in bakery, dairy, and confectionery products
The expanding application of guar gum across bakery, dairy, and confectionery products is a key factor driving market growth, owing to its versatility and functional benefits. In bakery items such as breads, cakes, and biscuits, guar gum enhances dough consistency, improves softness, and helps retain moisture, thereby extending product freshness. Within the dairy segment, it is widely used in products like ice cream, yogurt, and milk-based beverages to deliver a smooth texture, stabilize formulations, and reduce ice crystal formation. In confectionery, guar gum plays an important role in maintaining uniformity and preventing separation in fillings, toppings, and gel-based products. The increasing consumer preference for premium-quality foods with improved texture and longer shelf life is further boosting its adoption. Additionally, the rising consumption of processed and ready-to-eat food products has created sustained demand for effective stabilizers like guar gum.
Surging demand for functional and low-calorie food options
As health and wellness dominate consumer priorities, both consumers and food manufacturers are actively seeking functional, low-calorie solutions, which has increased the demand for guar gum. Guar gum, a natural and soluble dietary fiber, not only thickens and stabilizes but also reduces caloric density and enhances satiety in food products. Its unique fat-replacement capabilities, along with its ability to preserve texture, make it a key ingredient in crafting reduced-calorie offerings. These include low-fat dairy, dressings, baked goods, and functional beverages. Recent public health data highlights the urgent need for healthier food options in the U.S. The Centers for Disease Control and Prevention reported that in 2024, over 25% of adults across all U.S. states and territories struggled with obesity[2]Source: Centers for Disease Control and Prevention, “Adult Obesity Prevalence Maps”, cdc.gov. This rising trend in obesity has amplified the demand for weight management solutions, prompting food producers to integrate functional fibers like guar gum into their offerings. With its blend of technical functionality and health benefits, guar gum strengthens its position in the realm of health-focused, low-calorie food development.
Expansion of pharmaceutical and personal care applications
The expansion of guar gum applications in the pharmaceutical and personal care sectors is a notable driver of market growth, reflecting its versatility beyond food uses. In pharmaceuticals, guar gum is increasingly utilized as a binder, disintegrant, and controlled-release agent in tablets and capsules, contributing to improved drug delivery and patient compliance. Its partially hydrolyzed form is also gaining popularity in dietary supplements and nutraceuticals due to its benefits for digestive health and gut microbiome support. In personal care and cosmetics, guar gum is used as a thickening and stabilizing agent in products such as creams, lotions, shampoos, and gels, enhancing texture and consistency. Rising consumer demand for natural, plant-based ingredients in healthcare and beauty products is further accelerating adoption. Additionally, guar gum’s biocompatibility, non-toxicity, and cost-effectiveness make it an attractive alternative to synthetic polymers.
Restraints Impact Analysis*
| Restraint | (~) % Impact on CAGR Forecast | Geographic Relevance | Impact Timeline |
|---|---|---|---|
| Competition from alternative hydrocolloids and synthetic substitutes | -0.9% | Global, with acute pressure in North America and Europe | Short term (≤ 2 years) |
| Price volatility of guar seeds due to agricultural dependency | -1.1% | Global supply chain, originating in India (Rajasthan, Gujarat, Haryana) | Short term (≤ 2 years) |
| Stringent food safety and regulatory standards | -0.4% | Europe, North America, Asia-Pacific | Medium term (2-4 years) |
| Limited awareness of guar gum applications in niche markets | -0.3% | Emerging markets in South America, Middle East, Africa | Long term (≥ 4 years) |
| Source: Mordor Intelligence | |||
Competition from alternative hydrocolloids and synthetic substitutes
The guar gum market faces restraint from increasing competition posed by alternative hydrocolloids and synthetic substitutes, which can limit its market share in certain applications. Ingredients such as xanthan gum, carrageenan, locust bean gum, and cellulose derivatives often offer similar thickening, stabilizing, or gelling properties, sometimes with faster hydration or improved functional performance in specific formulations. Synthetic polymers and modified starches are also used in food, pharmaceuticals, and industrial applications, providing cost-effective or specialized solutions. Manufacturers may switch to these alternatives based on price volatility, supply constraints, or targeted functional requirements, which can challenge guar gum adoption. Additionally, some alternatives provide enhanced compatibility with modern processing technologies or extended shelf life in end products. This competitive pressure is particularly evident in regions where guar gum supply is concentrated or where cost sensitivity is high.
Stringent food safety and regulatory standards
Stringent food safety and regulatory standards act as a key restraint on the guar gum market, as manufacturers must comply with rigorous guidelines across food, pharmaceutical, and feed applications. Regulatory bodies require strict quality control, traceability, and adherence to permissible usage limits, which can increase operational complexity and compliance costs, particularly for smaller producers. For instance, the European Food Safety Authority (EFSA)’s FEEDAP panel published a safety assessment for guar gum in animal feed, specifying species-specific safe concentrations, 278 mg/kg for chickens, 500 mg/kg for piglets, and 1,100 mg/kg for cattle[3]Source: European Food Safety Authority, “Regulations”, efsa.europa.eu. These regulations obligate feed formulators to perform batch testing and maintain detailed documentation to ensure compliance, adding both administrative and financial burdens. Similar standards apply in food and pharmaceutical applications, where manufacturers must meet stringent purity, microbial, and labeling requirements. Such regulatory oversight, while ensuring consumer safety, can limit entry for smaller regional players and slow down product launches
*Our forecasts treat driver/restraint impacts as directional, not additive. The impact forecasts reflect baseline growth, mix effects, and variable interactions.
Segment Analysis
By Grade: Pharmaceutical Precision Drives Premium Growth
The food-grade segment dominated the guar gum market, accounting for 61.27% of the total share in 2025, driven by its extensive use across a wide range of food applications. Guar gum is widely utilized in bakery, dairy, sauces, and processed food products due to its superior thickening, stabilizing, and moisture-retention properties. The growing consumer preference for clean-label and natural ingredients has significantly strengthened demand for food-grade guar gum, as it is plant-derived and perceived as a safe additive. Additionally, the expansion of convenience and packaged food consumption globally has further supported its widespread adoption. Food manufacturers are increasingly incorporating guar gum to improve texture, extend shelf life, and maintain product consistency, especially in gluten-free and plant-based formulations.
On the other hand, the pharmaceutical-grade segment is projected to register the fastest growth, with a CAGR of 7.27% through 2031, reflecting its rising importance in healthcare and nutraceutical applications. Pharmaceutical-grade guar gum is gaining traction as a functional excipient, particularly in tablet formulations where it acts as a binder, disintegrant, and controlled-release agent. The increasing prevalence of chronic diseases and the growing demand for advanced drug delivery systems are key factors driving this segment’s expansion. Moreover, its use in dietary supplements, especially in the form of partially hydrolyzed guar gum (PHGG), is increasing due to its benefits in digestive health and gut microbiome support.


By Application: Pharmaceuticals Outpace Legacy Food Segments
The food and beverages segment accounted for the largest share of the guar gum market, capturing 40.11% of total revenue in 2025, driven by its extensive functionality across diverse product categories. Guar gum is widely used as a thickener, stabilizer, and emulsifier in bakery, dairy, sauces, dressings, and ready-to-eat meals, where it enhances texture and consistency. The rising global demand for processed and convenience foods has significantly boosted its adoption, particularly in urban markets with evolving consumption patterns. Additionally, the increasing preference for clean-label and plant-based ingredients has strengthened the position of guar gum as a natural additive in food formulations. Its effectiveness in gluten-free and low-fat products further expands its application scope, making it indispensable for modern food innovation.
In contrast, the pharmaceuticals segment is anticipated to be the fastest-growing application, expanding at a CAGR of 8.35% between 2026 and 2031, supported by its increasing use in advanced medical and nutraceutical applications. Guar gum is widely utilized in pharmaceutical formulations as a binder, disintegrant, and controlled-release agent, contributing to improved drug delivery performance. The rising prevalence of chronic diseases and the growing need for sustained-release medications are key drivers accelerating demand in this segment. Furthermore, the growing popularity of dietary supplements and gut health products has increased the use of guar gum, particularly in its partially hydrolyzed form. Pharmaceutical manufacturers are increasingly favoring natural excipients like guar gum due to their safety, biocompatibility, and regulatory acceptance.

Geography Analysis
North America accounted for 38.91% of the guar gum market share in 2025, maintaining its dominance primarily due to strong demand from the oil & gas sector, particularly in the United States. Guar gum is extensively used in hydraulic fracturing operations, where it serves as a key viscosifying agent, supporting drilling efficiency and well productivity. In addition to energy applications, the region also exhibits steady demand from the food processing and pharmaceutical industries, driven by clean-label trends and the growing use of natural hydrocolloids. The presence of large multinational ingredient companies, advanced processing technologies, and established supply chains further strengthens the region’s market position. Moreover, increasing investments in shale exploration and production activities continue to sustain long-term demand for guar gum across North America.
Asia-Pacific is projected to grow at a CAGR of 9.82% through 2031, making it the fastest-growing regional market. This growth is largely supported by India’s role as the leading producer and exporter of guar gum, alongside expanding domestic consumption in countries such as China. Rapid industrialization and the growth of end-use industries, including food processing, textiles, and pharmaceuticals, are driving demand across the region. Additionally, the rising popularity of convenience foods and plant-based products is boosting the use of guar gum as a stabilizer and thickener. Increasing investments in processing infrastructure and the development of value-added guar derivatives are further enhancing the region’s competitiveness, positioning Asia-Pacific as both a supply hub and an emerging consumption center.
In other regions, including Europe, South America, and the Middle East and Africa, the guar gum market is experiencing steady but comparatively moderate growth. Europe is driven by strong demand for clean-label and natural food ingredients, supported by stringent regulations favoring plant-based additives. South America is witnessing gradual adoption across the food and beverage sector, along with limited industrial usage. Meanwhile, the Middle East & Africa region shows potential due to expanding oil & gas activities and increasing food processing demand, particularly in Gulf countries.

Competitive Landscape
The guar gum market demonstrates moderate fragmentation, characterized by the coexistence of numerous regional manufacturers and a group of established multinational corporations. A significant portion of global production is concentrated in India, which acts as the primary supplier of guar seeds and processed guar gum. This has led to the emergence of several small- and mid-sized regional processors that cater to export markets as well as domestic demand. At the same time, large global ingredient companies leverage their technical expertise, global distribution networks, and strong client relationships to maintain a competitive edge, particularly in high-value applications such as food, and pharmaceuticals.
Competition in the market is driven less by branding and more by product quality, customization, pricing, and supply reliability. Regional players often compete aggressively on cost due to proximity to raw material sources, while multinational companies differentiate themselves through value-added offerings, including modified guar derivatives, application-specific formulations, and consistent quality standards. The increasing demand for clean-label, organic, and specialty guar gum products has further intensified competition, prompting companies to invest in research and development, certifications, and process optimization to meet evolving customer requirements across food, nutraceutical, and industrial segments.
In recent years, the competitive landscape has been shaped by capacity expansions, backward integration, and portfolio diversification strategies. Leading players are strengthening their positions by expanding processing capabilities, securing guar seed supply chains, and introducing higher-margin specialty products such as fast-hydrating guar gum and partially hydrolyzed guar gum. Additionally, companies are focusing on sustainability initiatives and traceability to align with global buyer expectations, particularly in Europe and North America.
Guar Gum Industry Leaders
-
Vikas WSP Ltd.
-
Hindustan Gum & Chemicals Ltd.
-
Lucid Colloids Ltd.
-
Neelkanth Polymers
-
Cargill, Incorporated
- *Disclaimer: Major Players sorted in no particular order

Recent Industry Developments
- January 2026: Researchers published a study in RSC Sustainability demonstrating that EDTA-crosslinked guar gum hydrogels sustain transdermal delivery of anti-inflammatory drugs. This positions guar as a biodegradable substitute for synthetic polymers in pharmaceutical patches and broadens its potential in controlled-release therapies.
- May 2025: Sarda Bio Polymers revealed clean-label, plant-based hydrocolloid solutions at IFFA 2025 in Frankfurt. The company's product range includes guar gum, cassia tora gum, tamarind xyloglucan, konjac gum, and psyllium husk powder for clean-label applications. Sarda Bio Polymers implements sustainable practices by utilizing complete plant materials and incorporating renewable energy in its operations to reduce environmental impact.
- January 2024: Brenntag Essentials has opened a new mixing and blending facility in Dong Nai province, Vietnam, located 30 kilometers from Ho Chi Minh City. The 3,900-square-meter facility is positioned near Brenntag Vietnam's existing operations, which include bulk storage tanks with over 21,000 cubic meters capacity and a jetty that can accommodate vessels up to 50,000 deadweight tonnage. The investment strengthens Brenntag's ability to serve growing customer demands across Southeast Asia.


Global Guar Gum Market Report Scope
Guar gum is a natural, plant-derived polysaccharide (hydrocolloid) extracted from the seeds of the guar plant, scientifically known as Cyamopsis tetragonoloba. It is widely used as a thickening, stabilizing, and emulsifying agent across multiple industries. The global guar gum market is segmented by grade, application and geography. Based on grade, the market is segmented into food grade and pharmaceutical grade. Based on application, the market is segmented into food and beverages, animal feed and pet food, pharmaceuticals and cosmetics and personal care. By geography, the market is segmented into North America, Europe, Asia-Pacific, South America, and Middle-East and Africa. For each segment, the market sizing and forecasting have been done in value terms (USD million).
| Food Grade |
| Pharmaceutical Grade |
| Food and Beverages | Bakery and Confectionery |
| Dairy and Dairy Products | |
| Meat Industry | |
| Beverages | |
| Others | |
| Animal Feed and Pet Food | |
| Pharmaceuticals | |
| Cosmetics and Personal Care |
| North America | United States |
| Canada | |
| Mexico | |
| Rest of North America | |
| Europe | Germany |
| United Kingdom | |
| France | |
| Italy | |
| Spain | |
| Rest of Europe | |
| Asia-Pacific | China |
| Japan | |
| India | |
| South Korea | |
| Australia | |
| Rest of Asia-Pacific | |
| South America | Brazil |
| Argentina | |
| Rest of South America | |
| Middle East and Africa | Saudi Arabia |
| United Arab Emirates | |
| South Africa | |
| Rest of Middle East and Africa |
| By Grade | Food Grade | |
| Pharmaceutical Grade | ||
| By Application | Food and Beverages | Bakery and Confectionery |
| Dairy and Dairy Products | ||
| Meat Industry | ||
| Beverages | ||
| Others | ||
| Animal Feed and Pet Food | ||
| Pharmaceuticals | ||
| Cosmetics and Personal Care | ||
| By Geography | North America | United States |
| Canada | ||
| Mexico | ||
| Rest of North America | ||
| Europe | Germany | |
| United Kingdom | ||
| France | ||
| Italy | ||
| Spain | ||
| Rest of Europe | ||
| Asia-Pacific | China | |
| Japan | ||
| India | ||
| South Korea | ||
| Australia | ||
| Rest of Asia-Pacific | ||
| South America | Brazil | |
| Argentina | ||
| Rest of South America | ||
| Middle East and Africa | Saudi Arabia | |
| United Arab Emirates | ||
| South Africa | ||
| Rest of Middle East and Africa | ||


Key Questions Answered in the Report
What is the current size of the guar gum market?
The guar gum market size is expected to grow from USD 1.41 billion in 2025 to USD 1.49 billion in 2026 and is forecast to reach USD 2.05 billion by 2031.
What CAGR is projected between 2026 and 2031?
The Guar Gum market is forecasted to grow at 6.59% CAGR from 2026 to 2031.
Which application segment is expanding fastest?
Pharmaceuticals leads with an 8.35% CAGR as generic-drug makers adopt hydroxypropyl guar excipients.
How big will Pharmaceutical Grade become by 2031?
Pharmaceutical Grade is expected to reach about USD 0.77 billion by 2031, up from USD 0.54 billion in 2026.
What drives Asia-Pacific growth?
Rising drug manufacturing in India and China, textile processing across Southeast Asia, and cosmetic adoption in Japan and South Korea together generate a 9.82% regional CAGR.
Page last updated on:


