Green Chemicals Market Size and Share
Market Overview
| Study Period | 2019 - 2030 |
|---|---|
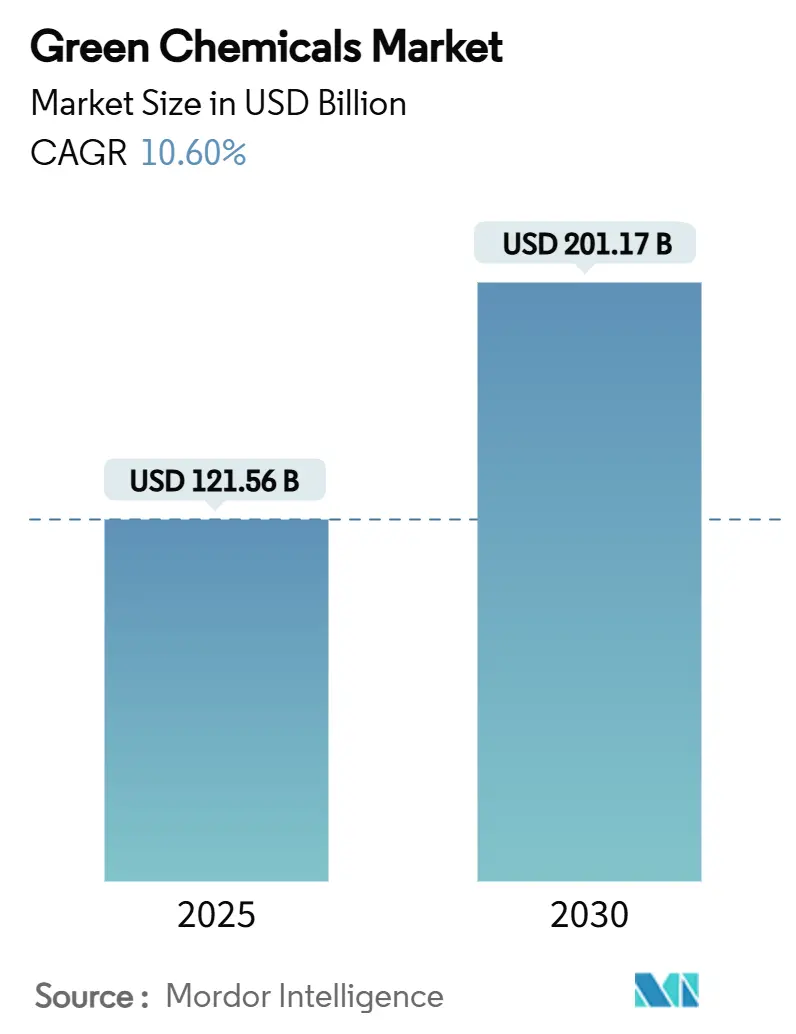
| Market Size (2025) | USD 121.56 Billion |
| Market Size (2030) | USD 201.17 Billion |
| Growth Rate (2025 - 2030) | 10.60% CAGR |
| Fastest Growing Market | Asia Pacific |
| Largest Market | Asia Pacific |
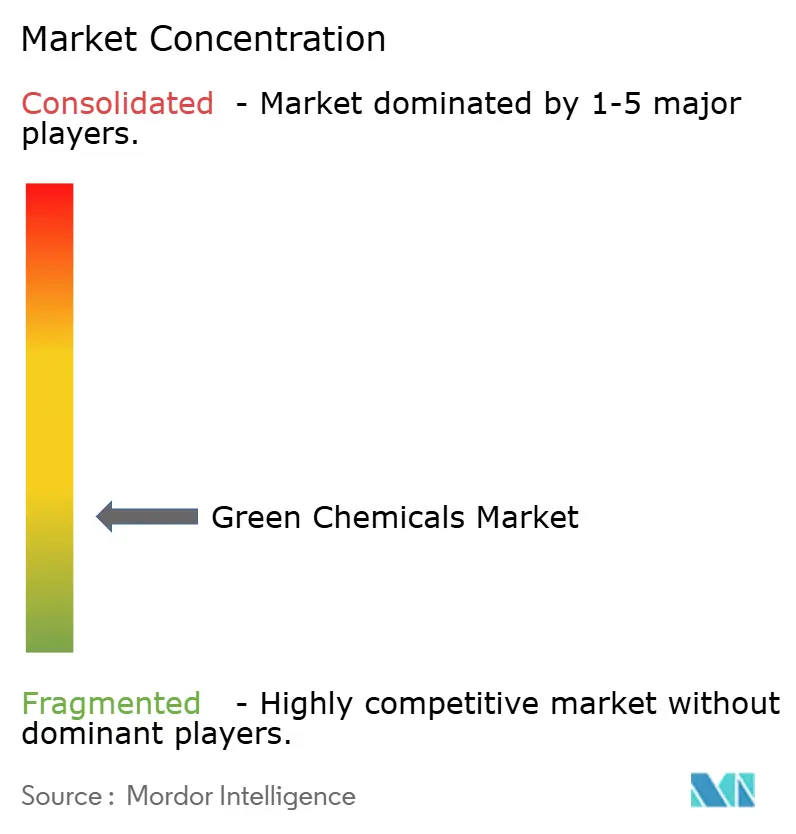
| Market Concentration | Low |
Major Players *Disclaimer: Major Players sorted in no particular order Image © Mordor Intelligence. Reuse requires attribution under CC BY 4.0. | |
Green Chemicals Market Analysis by Mordor Intelligence
The Green Chemicals Market size is estimated at USD 121.56 billion in 2025, and is expected to reach USD 201.17 billion by 2030, at a CAGR of 10.60% during the forecast period (2025-2030). Rapid policy shifts toward net-zero targets, cost-competitive synthetic-biology platforms and aggressive corporate sustainability mandates are accelerating the replacement of petroleum feedstocks with renewable alternatives. Momentum is further supported by commercial-scale CO₂-to-chemicals plants, green public-procurement rules and blockchain-enabled traceability that de-risk supply chains. Asia Pacific commands manufacturing scale and policy ambition, Europe tightens disclosure and carbon-pricing rules, and North America leverages fiscal incentives to expand domestic biorefining capacity. Corporate strategies span incremental portfolio re-engineering by incumbents and disruptive platform plays by biotechnology start-ups, creating a dynamic competitive arena in which scale, intellectual-property depth and digital capabilities shape advantage.
Key Report Takeaways
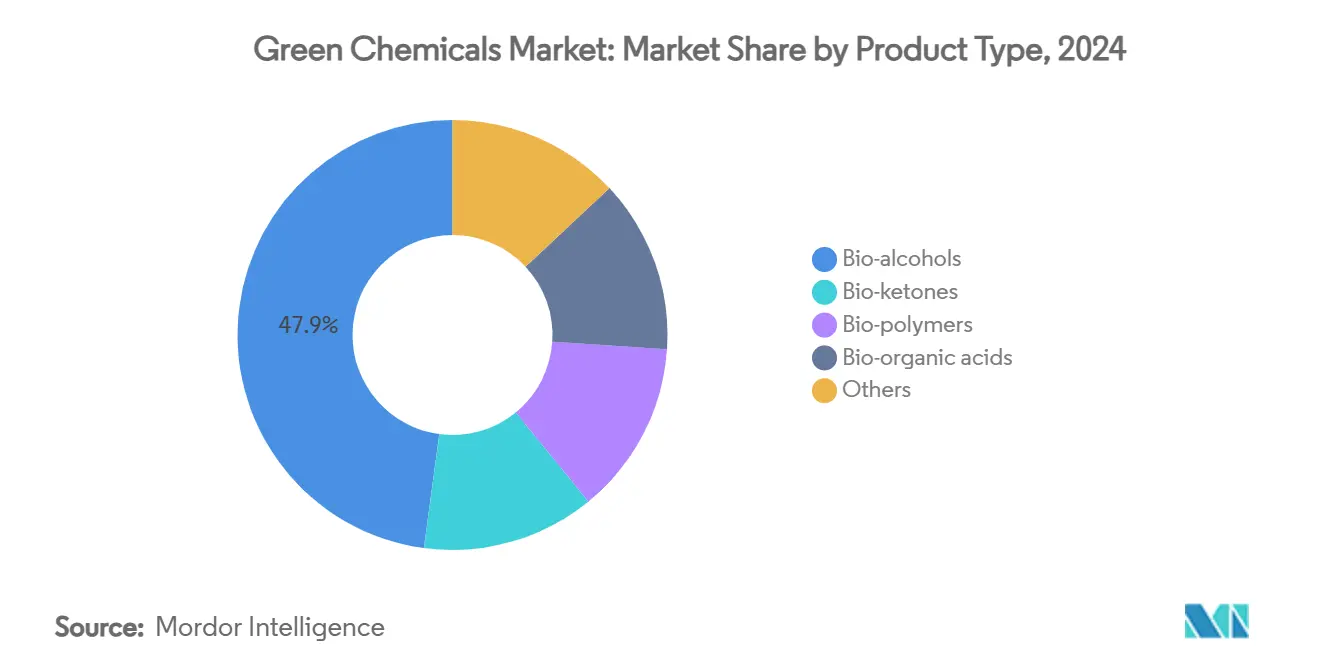
- By product type, bio-alcohols held 47.88% of green chemicals market share in 2024, while bio-polymers are advancing at an 11.45% CAGR to 2030.
- By feedstock, sugar and starch crops accounted for 28.77% share of the green chemicals market size in 2024; algae-based pathways are projected to expand at an 11.43% CAGR through 2030.
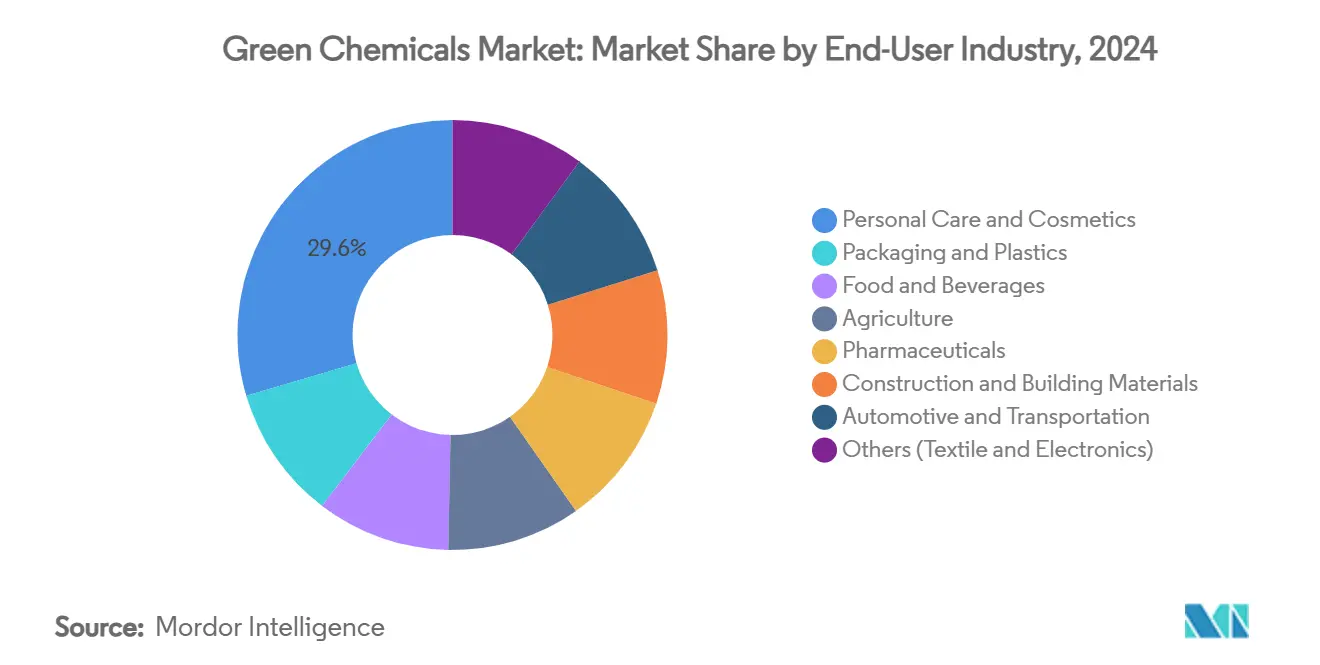
- By end-user industry, personal care and cosmetics captured 29.55% revenue share in 2024, whereas packaging and plastics within the green chemicals market record the highest projected CAGR at 11.65% to 2030.
- By geography, Asia Pacific led green chemicals market with 42.66% share in 2024 and is growing at a 12.05% CAGR, outpacing all other regions.
Global Green Chemicals Market Trends and Insights
Driver Impact Analysis*
| Driver | (~) % Impact on CAGR Forecast | Geographic Relevance | Impact Timeline |
|---|---|---|---|
| Tightening global net-zero and ESG mandates | +2.8% | Global, with EU and North America leading implementation | Medium term (2-4 years) |
| Expanding green public-procurement programs | +1.9% | North America & EU, expanding to APAC | Medium term (2-4 years) |
| Synthetic-biology cost curves flattening | +2.4% | Global, with concentrated R&D in North America and Europe | Long term (≥ 4 years) |
| CO₂-to-chemicals commercial breakthroughs | +1.7% | Global, early deployment in industrial clusters | Long term (≥ 4 years) |
| Blockchain-based supply-chain traceability pull | +1.2% | Global, with premium market adoption first | Short term (≤ 2 years) |
| Source: Mordor Intelligence | |||
Tightening Global Net-Zero and ESG Mandates
Mandatory climate-disclosure rules in the EU and the United States require detailed emissions reporting, making renewable feedstocks a direct compliance lever for chemical buyers. Carbon-pricing mechanisms such as the EU Carbon Border Adjustment Mechanism add cost to high-emission imports, shifting procurement toward low-carbon alternatives. National PFAS bans-France’s will apply to all consumer goods in 2026-remove entire classes of legacy petrochemicals, creating immediate white-space for bio-based substitutes. Multinational brands now embed supplier-level sustainability criteria in purchase contracts, triggering demand pull across the value chain. As public investors link financing rates to ESG scores, green chemicals gains preferential capital access, reinforcing adoption velocity.
Expanding Green Public-Procurement Programs
Governments are using buying power to mainstream sustainable chemistry. The US Department of Energy issued a USD 213.6 million loan guarantee to Solugen’s Minnesota biorefinery, lowering project risk and crowding in private capital. Europe’s construction codes now mandate minimum bio-based content for insulation and packaging supplied to public projects, providing predictable offtake for suppliers. Such guaranteed demand shortens payback periods on green-chemistry installations, particularly in infrastructure and defense where public spending is large. Early evidence shows that once public agencies validate bio-based performance standards, private-sector buyers adopt analogous specifications, expanding the green chemicals market beyond the initial tender volumes.
Synthetic-Biology Cost Curves Flattening
Precision-fermentation platforms have reached cost parity with petrochemical routes for multiple specialty molecules, reshaping the green chemicals market. Metabolic-engineering advances delivered l-homoserine titers of 85.29 g/L in E. coli, demonstrating industrial-scale yields. AI-driven strain-design cycles compress development time from years to months, reducing R&D expense and allowing faster market entry. ZymoChem’s BAYSE, the first scalable bio-based super-absorbent polymer, shows how platform organisms can unlock entirely new performance categories. Established producers use these technologies to retrofit existing assets—BASF’s bio-based ethyl acrylate cut product carbon footprint by 30% while avoiding new-build CAPEX.
CO₂-to-Chemicals Commercial Breakthroughs
The world’s first commercial CO₂-to-methanol plant in Anyang, China converts 160,000 t of captured CO₂ into 110,000 t of methanol annually, validating industrial-scale carbon utilization. Technip Energies and LanzaTech secured USD 200 million in US DOE funding for Project SECURE to develop sustainable ethylene from captured emissions. SABIC operates a facility that processes 500,000 t of CO₂ per year, integrating output into urea and methanol lines. These projects prove that retrofit of existing clusters can deliver both emission abatement and commodity chemicals without greenfield plants, strengthening the green chemicals market.
Restraint Impact Analysis*
| Restraint | (~) % Impact on CAGR Forecast | Geographic Relevance | Impact Timeline |
|---|---|---|---|
| High CAPEX and feedstock-price volatility | -2.1% | Global, particularly acute in emerging markets | Short term (≤ 2 years) |
| Performance and certification gaps vs petro-alternatives | -1.6% | Global, with stricter requirements in regulated industries | Medium term (2-4 years) |
| Biogenic-CO₂ supply-chain bottlenecks | -1.3% | Regional, concentrated in industrial clusters | Medium term (2-4 years) |
| Source: Mordor Intelligence | |||
High CAPEX and Feedstock-Price Volatility
Building green-chemistry assets often costs 50-70% more than equivalent petrochemical capacity, burdening developers with long payback horizons. Volatile agricultural commodity prices add earnings uncertainty, especially where bio-feedstock costs run 1.2-4.2 times above fossil inputs. In Europe the investment gap to reach net-zero chemicals by 2050 is estimated at USD 550 billion, dwarfing current annual spend. Emerging-market players face higher financing costs, magnifying risk. Microalgae biodiesel illustrates the challenge: without co-product revenue or carbon pricing, production costs remain well above diesel parity.
Performance and Certification Gaps vs Petro-Alternatives
Bio-based solvents can struggle with stability under extreme pH or temperature, limiting uptake in paints and coatings where 78% of solvent demand resides. Certification standards differ across jurisdictions, creating duplicative testing and delaying market entry. Blockchain-enabled traceability remains nascent, and data-quality inconsistencies hamper scale. High-throughput performance testing facilities are scarce, slowing iteration cycles for novel molecules. These hurdles narrow the addressable market to applications tolerant of performance variance until certification frameworks mature.
*Our forecasts treat driver/restraint impacts as directional, not additive. The impact forecasts reflect baseline growth, mix effects, and variable interactions.
Segment Analysis
By Product Type: Bio-alcohols Anchor Commercial Scale
Bio-alcohols accounted for a dominant 47.88% of green chemicals market share in 2024, buoyed by extensive fuel-blending mandates and well-established dehydration routes to olefins. Brazil processed 713 million t of sugarcane in 2023, producing 35.3 billion L of ethanol, evidencing large-scale infrastructure[1]Empresa de Pesquisa Energética, “Brazilian Ethanol Balance 2023,” epe.gov.br. The segment’s robust logistics network and end-use diversity reinforce its low-risk status for investors. In contrast, bio-polymers register the fastest 11.45% CAGR to 2030, catalyzed by global single-use-plastic bans and brand commitments to biodegradable packaging. Although bio-ketones and bio-organic acids occupy niche volumes, their value-added roles in pharma synthesis and food preservation sustain healthy margins.
Scaling trajectories differ. Bio-alcohols leverage decades of process optimization, yielding predictable cash flows. Bio-polymers require more complex feedstock-to-monomer pathways, but their alignment with circular-economy imperatives secures policy backing. BASF’s bio-based ethyl acrylate—manufactured within existing cracker assets—shows how incumbents can shift high-volume intermediates without new plant construction, compressing time-to-market . Industry forecasts expect bio-based polymers to reach a 14% CAGR through 2027, yet they represent just 1% of fossil polymer output, highlighting vast headroom.


By Feedstock: Sugar-Crop Leadership Faces Third-Generation Pressure
Sugar and starch crops delivered 28.77% of feedstock input in 2024, underpinned by mature supply chains and high conversion yields. India’s 20% ethanol-blending target for 2025-26 will require 13.5 billion L of ethanol annually, yet forecast production capacity tops out at 10.1 billion L, underscoring supply tension. Lignocellulosic residues and plant oils continue incremental share gains, aided by waste-utilization incentives. Algae-based platforms, though small, post an 11.43% CAGR, propelled by superior lipid yields and non-arable land cultivation.
Feedstock evolution is shifting toward second- and third-generation inputs that sidestep food-security debates. German studies reveal that mobilizing merely 20-30% of national biomass waste could meet chemical demand for products such as adipic acid and citric acid. For microalgae, integrating high-value co-products like astaxanthin can lower biodiesel breakeven from USD 3.90 to USD 0.54 per L, inching closer to diesel parity. Scaling these options hinges on downstream purification cost reductions and robust offtake agreements.
By End-User Industry: Personal Care Captures Early Adoption Premiums
The personal-care segment led with 29.55% of the green chemicals market size in 2024 as consumers migrate toward naturally derived ingredients and regulators tighten restrictions on synthetic polymers. Product launches such as Lubrizol’s Carbopol BioSense—developed with Suzano—demonstrate cellulose-based rheology solutions that meet performance benchmarks while reducing microplastic pollution. Packaging and plastics exhibit the highest 11.65% CAGR to 2030, spurred by extended-producer-responsibility laws mandating recycled or biodegradable content. Food and beverages, agriculture, pharmaceuticals and automotive sectors adopt at varying pace, largely dictated by regulatory exposure and functional-performance requirements.
Performance-advantaged green chemicals capable of outperforming petro-based incumbents are gaining traction. Haltermann Carless’s 100% plant-based isododecane offers equivalent volatility to silicone fluids, expanding options in both cosmetics and automotive coatings. Meanwhile, fragrance houses deploy blockchain pilots to authenticate bio-based aromatic ingredients, addressing consumer provenance concerns while meeting stricter disclosure norms.
Geography Analysis
Asia Pacific accounted for 42.66% of 2024 revenues and is forecast to grow at a 12.05% CAGR, reflecting the convergence of vast feedstock availability, expanding domestic demand and assertive policy instruments. China enforces strict pollutant-discharge caps and offers tax rebates on verified bio-based inputs, encouraging local producers to upgrade to renewable routes within the green chemicals market. India’s biofuel roadmap accelerates ethanol demand, yet feedstock-competition and climatic variability risk supply disruptions. Japan and South Korea apply eco-innovation credits and R&D subsidies, positioning themselves as technology hubs, while Indonesia leverages palm-oil abundance for oleochemical and biodiesel value chains.
North America presents a mature but still expanding arena. The US Inflation Reduction Act provides production and investment tax credits that elevate domestic biorefinery economics[2]“Inflation Reduction Act – Clean Manufacturing Tax Credits,” congress.gov. Canada’s Clean Fuel Regulations reward lifecycle-carbon reductions, and Mexico exploits proximity to US markets to build export-oriented green-chemical clusters. Europe couples stringent disclosure requirements with carbon pricing, compelling firms to substitute petrochemicals despite higher input costs. France’s incoming PFAS ban and the EU REACH revision intensify the shift, giving first-movers a competitive edge.
South America, the Middle East and Africa register lower baselines yet sizable upside. Brazil’s ethanol complex produced 35.3 billion L in 2023, though domestic price competition and the EU-Mercosur deal inject new dynamics. Argentine and Colombian producers expand bioethanol but face feedstock-diversion debates. Saudi Arabia, buoyed by SABIC’s 500,000 t CO₂-to-chemicals plant, showcases the Middle East’s pivot toward value-added carbon management within the green chemicals market. African economies pilot biogas-to-chemicals projects tethered to agricultural-waste streams, but regulatory frameworks and technical capacity require maturation for large-scale deployments.


Competitive Landscape
The green chemicals market exhibits high fragmentation, balancing incumbents’ scale with start-ups’ technological agility. Giants such as BASF, Dow and Evonik retrofit existing crackers and fermentation units to supply bio-based drop-ins that meet legacy-spec requirements, lowering customer switching costs. BASF’s bio-based ethyl acrylate, delivered via standard logistics, cut carbon footprint 30% without altering downstream formulations. Meanwhile, platform biotech firms—Solugen’s chemo-enzymatic oxidation, ZymoChem’s carbon-efficient fermentation and LanzaTech’s gas-fermentation—target diverse end-products from common feedstocks, scaling revenue across multiple verticals.
Strategic partnerships accelerate go-to-market. BASF joined forces with Acies Bio to develop bio-fermented personal-care intermediates; Braskem collaborated with Lummus on green ethylene to leverage existing polyolefin demand in the green chemicals market. Private equity funds favor asset-light technology licensors, while sovereign-wealth investors back large-scale CCU complexes aligned with national decarbonization agendas. Digital twins and machine-learning-guided process controls enhance yield optimization, enabling smaller plants to remain competitive on cost.
Competitive intensity is poised to rise as carbon-price trajectories and disclosure mandates erode the cost differential between renewable and fossil routes. Companies that fail to establish credible transition roadmaps risk volume erosion in the green chemicals market, where procurement policies overweight lifecycle-carbon metrics. First movers securing secure biogenic CO₂ and waste-biomass contracts lock in feedstock arbitrage, creating barriers for late entrants. Consequently, portfolio resilience now depends on feedstock diversity, embedded digital capabilities and demonstrated emissions-reduction credentials.
Green Chemicals Industry Leaders
BASF
Braskem
Cargill
Dow
DSM
- *Disclaimer: Major Players sorted in no particular order

Recent Industry Developments
- May 2025: Mitsui Chemicals, Inc. is evaluating the possibility of spinning off its Basic & Green Materials business ("B&GM"), which primarily focuses on petrochemicals. This initiative seeks to establish a more resilient business structure, advance the transition to a sustainable society, and facilitate collaborations, integrations, and transformations with other companies, including the incorporation of green chemicals.
- October 2024: BASF and AM Green B.V. have signed a memorandum of understanding (MoU) to jointly assess and develop business opportunities for low-carbon chemicals. These chemicals will be exclusively produced using renewable energy, with an emphasis on the corresponding value chains in India.


Global Green Chemicals Market Report Scope
| Bio-alcohols |
| Bio-ketones |
| Bio-polymers |
| Bio-organic acids |
| Others |
| Sugar and Starch Crops |
| Lignocellulosic Biomass |
| Algae |
| Plant Oils and Animal Fats |
| Others (Recycled Carbon/CCU) |
| Packaging and Plastics |
| Food and Beverages |
| Personal Care and Cosmetics |
| Agriculture |
| Pharmaceuticals |
| Construction and Building Materials |
| Automotive and Transportation |
| Others (Textile and Electronics) |
| Asia-Pacific | China |
| India | |
| Japan | |
| South Korea | |
| Indonesia | |
| Rest of Asia-Pacific | |
| North America | United States |
| Canada | |
| Mexico | |
| Europe | Germany |
| United Kingdom | |
| France | |
| Italy | |
| Spain | |
| Nordic Countries | |
| Russia | |
| Rest of Europe | |
| South America | Brazil |
| Argentina | |
| Colombia | |
| Rest of South America | |
| Middle East and Africa | Saudi Arabia |
| United Arab Emirates | |
| Nigeria | |
| South Africa | |
| Rest of Middle East and Africa |
| By Product Type | Bio-alcohols | |
| Bio-ketones | ||
| Bio-polymers | ||
| Bio-organic acids | ||
| Others | ||
| By Feedstock | Sugar and Starch Crops | |
| Lignocellulosic Biomass | ||
| Algae | ||
| Plant Oils and Animal Fats | ||
| Others (Recycled Carbon/CCU) | ||
| By End-User Industry | Packaging and Plastics | |
| Food and Beverages | ||
| Personal Care and Cosmetics | ||
| Agriculture | ||
| Pharmaceuticals | ||
| Construction and Building Materials | ||
| Automotive and Transportation | ||
| Others (Textile and Electronics) | ||
| By Geography | Asia-Pacific | China |
| India | ||
| Japan | ||
| South Korea | ||
| Indonesia | ||
| Rest of Asia-Pacific | ||
| North America | United States | |
| Canada | ||
| Mexico | ||
| Europe | Germany | |
| United Kingdom | ||
| France | ||
| Italy | ||
| Spain | ||
| Nordic Countries | ||
| Russia | ||
| Rest of Europe | ||
| South America | Brazil | |
| Argentina | ||
| Colombia | ||
| Rest of South America | ||
| Middle East and Africa | Saudi Arabia | |
| United Arab Emirates | ||
| Nigeria | ||
| South Africa | ||
| Rest of Middle East and Africa | ||


Key Questions Answered in the Report
What is the forecast value of the green chemicals market by 2030?
The market is projected to reach USD 201.17 billion by 2030.
Which product category currently leads revenue in the green chemicals market?
Bio-alcohols hold 47.88% of 2024 revenue.
Which region shows the fastest growth in green chemical adoption?
Asia Pacific is expanding at a 12.05% CAGR through 2030.
Which end-use sector in the green chemicals market is growing most rapidly?
Packaging and plastics posts an 11.65% CAGR to 2030.
Page last updated on:


