Green And Bio-based Solvents Market Size and Share
Market Overview
| Study Period | 2021 - 2031 |
|---|---|
| Market Size (2026) | USD 6.32 Billion |
| Market Size (2031) | USD 9.39 Billion |
| Growth Rate (2026 - 2031) | 8.23% CAGR |
| Fastest Growing Market | Asia Pacific |
| Largest Market | Asia Pacific |
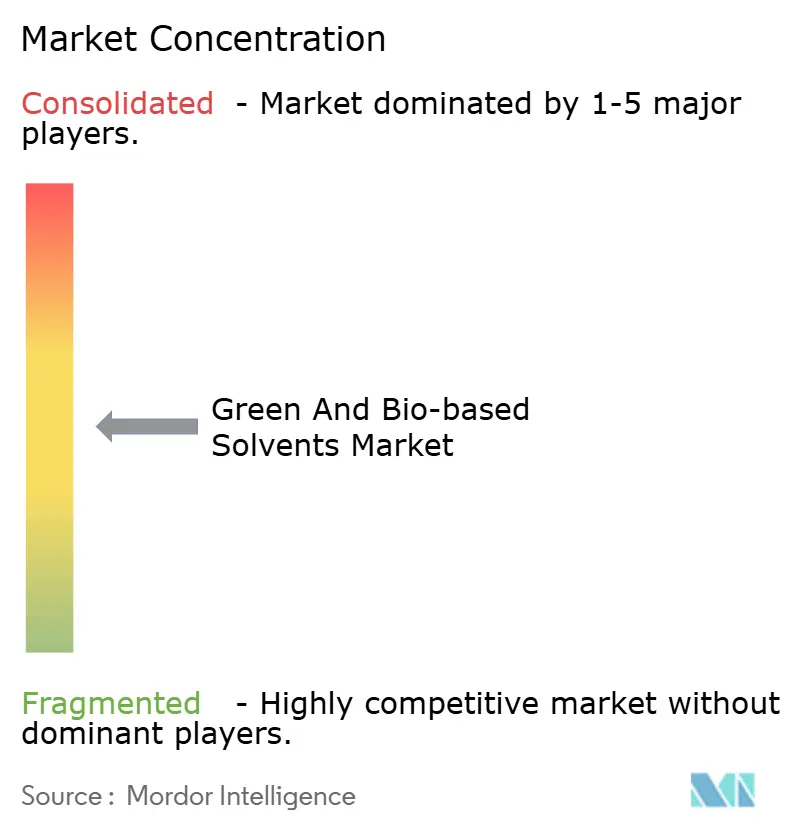
| Market Concentration | Medium |
Major Players *Disclaimer: Major Players sorted in no particular order Image © Mordor Intelligence. Reuse requires attribution under CC BY 4.0. | |

Green And Bio-based Solvents Market Analysis by Mordor Intelligence
The Green and Bio-based Solvents Market size is estimated at USD 6.32 billion in 2026, and is expected to reach USD 9.39 billion by 2031, at a CAGR of 8.23% during the forecast period (2026-2031). Corporate decarbonization targets, stricter VOC thresholds, and tax incentives are shifting purchasing budgets toward renewable alternatives, while emerging bio-refinery capacity is beginning to temper historic price premiums. Tier-1 coatings, adhesives, and pharmaceutical companies are embedding solvent carbon-intensity metrics into supplier scorecards, creating pull-through demand that is relatively insulated from short-term crude-oil swings. At the same time, technology licensing for cellulosic ethanol and branched bio-alcohols is expanding feedstock optionality, a trend that is expected to further narrow cost gaps by the end of the forecast window. Cost headwinds remain, yet policy-driven adoption in North America and Europe, coupled with self-imposed ESG mandates among Asian multinationals, underpins a resilient growth path for the green and bio-based solvents market.
Key Report Takeaways
- By product type, bio-alcohols held 37.22% of the green and bio-based solvents market share in 2025, while ethyl lactate is projected to grow at a 9.61% CAGR to 2031.
- By application, paints and coatings accounted for 27.87% of the green and bio-based solvents market size in 2025; pharmaceutical uses are expanding the fastest at a 10.38% CAGR through 2031.
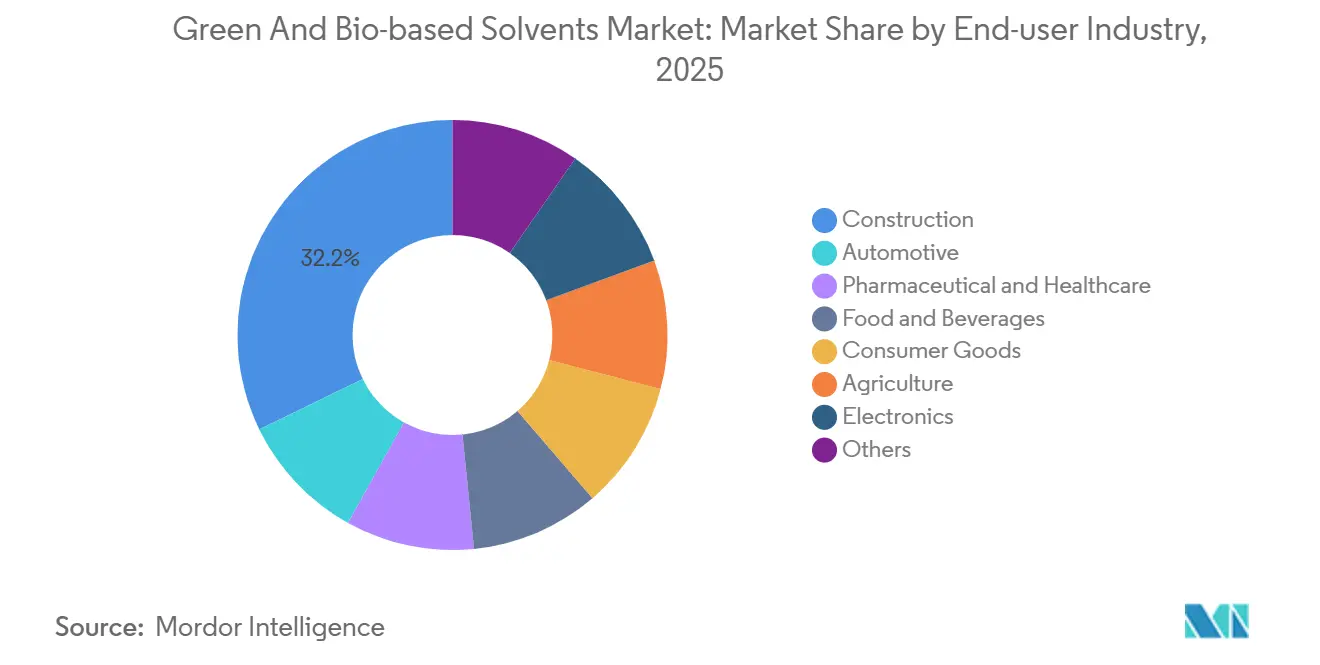
- By end user, the construction segment captured 32.24% revenue in 2025, whereas pharmaceutical and healthcare are forecast to post an 11.03% CAGR to 2031.
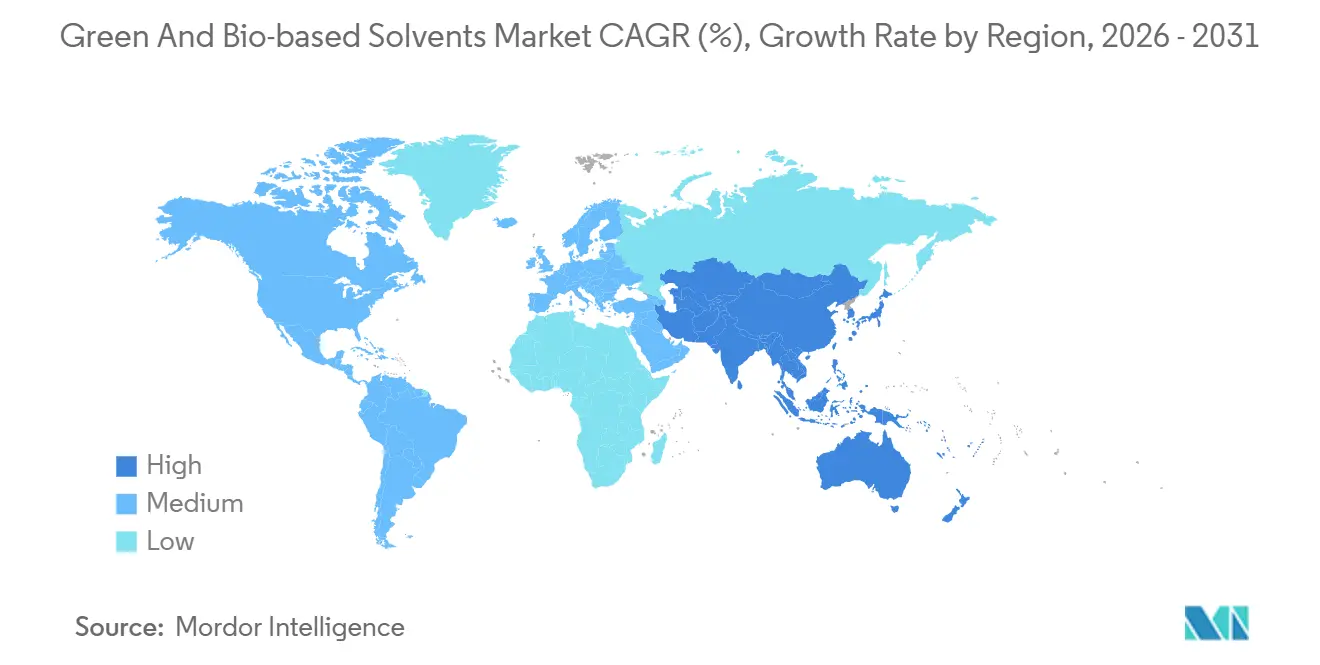
- By region, Asia Pacific dominated with 45.67% of 2025 revenue and is set to rise at an 8.92% CAGR to 2031.
Note: Market size and forecast figures in this report are generated using Mordor Intelligence’s proprietary estimation framework, updated with the latest available data and insights as of January 2026.
Global Green And Bio-based Solvents Market Trends and Insights
Driver Impact Analysis*
| Driver | (~) % Impact on CAGR Forecast | Geographic Relevance | Impact Timeline |
|---|---|---|---|
| Stringent VOC-emission regulations | +2.1% | Global, with peak enforcement in North America & EU | Medium term (2-4 years) |
| Volatility in crude-oil prices fueling bio-alternatives | +1.8% | Global, pronounced in import-dependent APAC economies | Short term (≤ 2 years) |
| Corporate ESG pledges and green-procurement mandates | +1.5% | North America & EU core, spill-over to APAC multinational supply chains | Long term (≥ 4 years) |
| Government incentives and tax credits for bio-chemicals | +1.3% | United States (IRA 45Z), EU (Innovation Fund, CBE JU), Brazil (RenovaBio) | Medium term (2-4 years) |
| Renewable feedstock build-out in emerging bio-refineries | +1.0% | APAC (China, India, Thailand), South America (Brazil, Argentina) | Long term (≥ 4 years) |
| Source: Mordor Intelligence | |||
Stringent VOC-Emission Regulations
Regulators are tightening atmospheric-emissions ceilings, making traditional glycol ethers increasingly non-compliant. The EU Directive 2004/42/EC capped VOC content in decorative paints at 30 g/L, prompting a shift toward bio-based propylene glycol in European coatings[1]European Commission, “Directive 2004/42/EC on the Limitation of Emissions of Volatile Organic Compounds,” eur-lex.europa.eu. California’s Rule 1113 imposes a 50 g/L VOC limit on architectural coatings sold in the Los Angeles basin, accelerating the uptake of bio-alcohol primers. China’s GB 18581-2020 restricts VOC emissions in architectural coatings to 80 g/L, catalyzing local demand for bio-ethanol and d-limonene. The US EPA formaldehyde rule for composite wood products, finalized in 2024, has indirectly boosted bio-solvent use in adhesives as formulators pivot away from formaldehyde-releasing resins. Third-party environmental audits under ISO 14001 now require documented solvent-emissions mitigation plans, embedding bio-solvent procurement into corporate compliance protocols.
Volatility in Crude-Oil Prices Fueling Bio-Alternatives
High oil-price variability supports multiyear bio-solvent contracts that hedge against petro-feedstock swings. Brent averaged USD 82/bbl in 2025, yet the CBOE Crude-Oil Volatility Index remained near 35%, signaling procurement risk for petro-solvents. The World Bank projects Brent to oscillate between USD 75 and USD 90/bbl through 2027, sustaining uncertainty that favors agricultural feedstock-linked pricing[2]World Bank, “Commodity Markets Outlook April 2025,” worldbank.org. D6 ethanol RINs traded at USD 0.70/gal in early 2025, providing a floor price for surplus fuel ethanol diverted into industrial-solvent channels. European naphtha averaged EUR 650/t in 2025, while bio-ethanol stood near EUR 750/t, a 15% premium that falls toward parity once CBAM levies on petrochemical imports arrive in 2026. Because bio-solvent feedstocks are indexed to agricultural cycles rather than geopolitical shocks, they offer a cost-stability proposition that resonates with procurement teams.
Corporate ESG Pledges and Green-Procurement Mandates
Global brands are weaving solvent carbon intensity into Scope 3 targets. Unilever disclosed that 38% of its cleaning-product formulations contained bio-based solvents in 2025, up from 22% in 2023. Procter & Gamble supplier scorecards now award premium ratings for ISCC-PLUS-verified solvents, influencing USD 60 billion in annual spend. The SBTi chemical-sector pathway recommends 30% renewable feedstock by 2030, making bio-solvent supply a prerequisite for 1.5°C alignment. Automotive OEMs such as Volkswagen require tier-1 suppliers to disclose solvent carbon intensity in coatings and adhesives, pressuring supply chains to source bio-glycols. Such mandates position the green and bio-based solvents market as a credible lever for achieving corporate climate goals.
Government Incentives and Tax Credits for Bio-Chemicals
Fiscal tools are accelerating parity with fossil-based routes. The U.S. Inflation Reduction Act’s 45Z credit offers up to USD 1.75/gal for bio-chemicals that achieve at least a 50% lifecycle-emission reduction, directly shrinking the cost delta for bio-ethanol and bio-butanol. USDA’s BioPreferred purchasing program channels an estimated USD 150 million/year into federal procurement of bio-solvents. The EU Innovation Fund allocated EUR 3 billion for low-carbon chemical projects in 2024-2025, including Neste’s Rotterdam expansion to 1.4 million t/year of renewable feedstock processing. Brazil’s RenovaBio awarded CBios, averaging BRL 85/tCO₂-e in 2025, adding an 8-10% margin uplift for domestic bio-ethanol producers. These incentives improve project IRRs and spur forward-selling agreements that stabilize offtake for new capacity.
Restraint Impact Analysis*
| Restraint | (~) % Impact on CAGR Forecast | Geographic Relevance | Impact Timeline |
|---|---|---|---|
| Higher production costs vs. petro-solvents | -1.4% | Global, most acute in price-sensitive APAC and MEA markets | Short term (≤ 2 years) |
| Feedstock supply volatility and agri-price swings | -0.9% | North America (corn, soy), South America (sugarcane), EU (rapeseed) | Medium term (2-4 years) |
| Land-use change certification bottlenecks | -0.6% | Southeast Asia (palm, sugarcane), Latin America (soy, sugarcane) | Long term (≥ 4 years) |
| Source: Mordor Intelligence | |||
Higher Production Costs vs. Petro-Solvents
Bio-solvents still command a 20-50% price premium over fossil equivalents on a liter basis. A 2024 Journal of Cleaner Production study placed bio-ethanol production at USD 0.65-0.85/L versus USD 0.45-0.55/L for petro-ethanol. Ethyl lactate remains 60-80% dearer than ethyl acetate in pharmaceutical formulations, confining uptake to high-value niches. The IEA estimates bio-chemical costs at 30-40% above fossil benchmarks absent carbon pricing. Downstream formulators report a 2-4 percentage-point gross-margin squeeze when shifting to fully bio-based systems, often leading to partial substitution strategies. Capital-intensive purification, such as multistage distillation to 99.5% purity, adds USD 0.10-0.15/L to processing costs, undercutting near-term parity goals.
Feedstock Supply Volatility and Agri-Price Swings
Agricultural raw-material markets remain susceptible to weather shocks. Corn futures averaged USD 4.50/bu in 2025, up 12% year on year after the Midwest drought clipped yields to the lowest level since 2020. Soybeans traded near USD 12.80/bu on tight 24% stocks-to-use ratios, inflating methyl-soyate economics. Brazilian sugarcane output dipped 3.5% in the 2024-2025 harvest, channeling scarce ethanol toward fuel blending rather than industrial sales. The World Bank expects agricultural prices to remain 18% above 2020 levels through 2027, sustaining cost pressure. Feedstock competition with food markets intensifies during supply shocks; in 2024, 36% of US corn output went to ethanol, limiting flexibility for solvent producers.
*Our forecasts treat driver/restraint impacts as directional, not additive. The impact forecasts reflect baseline growth, mix effects, and variable interactions.
Segment Analysis
By Type: Bio-Alcohols Remain the Anchor, Ethyl Lactate Accelerates
Bio-alcohols dominated green and bio-based solvents market size calculations, capturing 37.22% revenue in 2025 on the back of entrenched use in coatings, cleaners, and inks. Ethyl lactate, though smaller in baseline volume, is projected to post a 9.61% CAGR to 2031, buoyed by electronics cleaning and high-purity pharmaceutical synthesis, where residue-free evaporation commands premium pricing. Bio-glycols, principally renewable propylene glycol and ethylene glycol, are expanding in antifreeze and construction sealants, pushed by automotive OEM scorecards that reward verifiable bio-content. D-limonene, derived from citrus waste, is growing in household and industrial cleaners as citrus processors integrate downstream, while methyl soyate is establishing itself in agricultural adjuvants and low-toxicity printing inks.
Innovation pipelines extend beyond sugar- and corn-based routes; Gevo’s iso-butanol and DuPont’s propanediol platforms illustrate a pivot toward non-food biomass that could diversify supply and temper feedstock volatility. Company-owned fermentation strains engineered for higher conversion efficiencies are entering commercial scale-up, potentially setting new cost floors for the segment. Regulatory nods, such as the FDA’s GRAS status for ethyl lactate, are also unlocking food-contact and cosmetic use cases, broadening demand pools without materially cannibalizing incumbent solvent grades. Collectively, these factors reinforce the central role of type diversification in sustaining green and bio-based solvents market growth.


By Application: Pharmaceuticals Outpace Traditional Coatings
Paints and coatings retained 27.87% of 2025 revenue yet face share dilution as pharmaceutical uses accelerate at a 10.38% CAGR through 2031. Drug-manufacturing adoption is driven by ICH Q3C solvent-residue limits, continuous-manufacturing platforms that prefer predictable evaporation, and CDMO sustainability audits that prioritize low-toxicity profiles. The green and bio-based solvents market size for industrial cleaning continues to expand as EPA Safer Choice and EU Ecolabel schemes push formulators toward d-limonene- and bio-ethanol-based systems. Printing inks, especially water-based flexographic grades for food packaging, are substituting petro-glycols with bio alternatives to comply with Swiss migration ordinances.
Adhesives and sealants increasingly deploy bio-propylene glycol to meet LEED v4.1 low-emission credits, while cosmetics producers are using bio-alcohols as multifunctional fragrance carriers in clean beauty lines. Agriculture remains a niche but strategically important outlet, with methyl soyate adjuvants improving herbicide penetration in both conventional and organic farms. Electronics cleaning, though small in absolute volume, shows double-digit growth in bio-lactate consumption as OEMs chase defect-rate reductions amid shrinking PCB feature sizes. These shifting demand centers collectively deepen the application moat of the green and bio-based solvents market.
By End-User Industry: Healthcare Growth Surpasses Construction Dominance
Construction represented 32.24% of 2025 demand, powered by low-VOC architectural coatings and sealants that secure LEED and BREEAM credits. Still, pharmaceutical and healthcare demand is rising at an 11.03% CAGR, outpacing all other industries as CDMOs align solvent procurement with client-mandated net-zero audits. Automotive OEMs use bio-glycol-rich coatings to meet in-plant emission ceilings, while food and beverage processors deploy ethyl lactate and d-limonene for flavor extraction and GRAS-compliant cleaning.
Consumer-goods majors, spanning cleaning products to personal care, leverage high-bio-content solvents to meet retailer scorecards and reinforce brand sustainability narratives. Agriculture end-users employ methyl soyate as a biodegradable spray adjuvant, and electronics manufacturers value ethyl lactate’s ultra-low residue in critical cleaning steps. Niche domains such as textiles and leather finishing are piloting bio-solvent replacements in dyeing baths, signaling incremental but broad-based diversification in end-use patterns that sustains the green and bio-based solvents market’s demand resilience.
Geography Analysis
Asia Pacific accounted for 45.67% of 2025 revenue, making it the undisputed leader of the green and bio-based solvents market. China’s 14th Five-Year Plan mobilizes USD 10 billion in state funding for bio-refineries, and India’s pharma export boom relies on bio-solvents to meet EMA and FDA residue limits, underpinning an 8.92% regional CAGR through 2031. Japan’s GX program earmarks USD 150 billion for decarbonization, with subsidies for bio-based chemical production, while South Korea’s K-Chemicals 2030 roadmap incentivizes domestic capacity for bio-ethanol and bio-glycols.
North America trails in volume yet captures higher value per ton as consumer goods and automotive brands pay premiums for certified bio-content. The US 45Z credit lowers the cost gap by up to 20%, and Canada’s Clean Fuel Regulations indirectly raise the floor for bio-ethanol prices. Mexico’s 3.5 million-vehicle assembly in 2024 is adopting bio-coatings to satisfy USMCA environmental provisions, extending market pull across the broader NAFTA bloc.
Europe sustains demand via policy, notably the EU Chemical Strategy for Sustainability, requiring hazardous-substance substitution by 2027. Germany’s TA Luft revisions tighten VOC limits, while the UK’s Industrial Decarbonisation Strategy positions bio-solvents as a transitional technology. South American momentum is anchored by Brazil’s RenovaBio CBios and Argentina’s soybean expansion, both improving regional feedstock economics. The Middle East and Africa remain emergent, though Saudi Arabia’s Vision 2030 envisages bio-refinery investments that could unlock future demand pockets.

Competitive Landscape
The Green and Bio-Based Solvents market is moderately concentrated. Scale players pursue integrated corn-to-chemicals chains and joint ventures that unlock non-food biomass, as evidenced by BASF’s 25% stake in Synvina for FDCA technology and Dow’s partnership with New Energy Blue for cellulosic ethanol. Specialty niches such as d-limonene and methyl soyate remain fragmented, supplied by regional citrus processors and soybean crushers that collectively enjoy proximity-based cost advantages.
Green And Bio-based Solvents Industry Leaders
Dow
ADM
BASF
Solvay
Vertec BioSolvents Inc.
- *Disclaimer: Major Players sorted in no particular order

Recent Industry Developments
- September 2025: In Valencia, Spain, the SOLRESS project was initiated to develop an integrated biorefinery system to produce five key industrial solvents, ethyl acetate, ethyl lactate, butyl acetate, 2-MeTHF, and GVL, from second-generation biomass waste, including post-consumer coffee grounds and lignocellulosic feedstocks.
- February 2025: In a bid to tackle the decarbonization challenge in pharmaceutical manufacturing, ERM and Ayming secured funding from Innovate UK. This funding, part of the Sustainable Medicines Manufacturing Innovation Programme, aims to form a consortium focused on amplifying green solvent solutions in the supply chain.


Research Methodology Framework and Report Scope
Market Definitions and Key Coverage
Our study counts every solvent manufactured predominantly from renewable feedstocks, corn, sugar, lignocellulosic, or citrus-derived, sold to commercial users as bio-alcohols, glycols, diols, ethyl lactate, D-limonene, methyl soyate, and closely related drop-in blends. These volumes are valued at blended average selling prices that reflect regional grade mix and typical distributor margins.
Scope Exclusions: Water, super-critical fluids, ionic liquids, and all petro-based solvents sit outside this report.
Segmentation Overview
- By Type
- Bio-alcohols
- Bio-ethanol
- Bio-methanol
- Bio-propanol
- Bio-butanol
- Bio-glycols
- Bio-based Propylene Glycol
- Bio-based Ethylene Glycol
- Bio-diols
- Ethyl Lactate
- D-Limonene
- Methyl Soyate
- Other Types
- Bio-alcohols
- By Application
- Paints and Coatings
- Industrial and Domestic Cleaning
- Printing Inks
- Adhesives and Sealants
- Pharmaceuticals
- Cosmetics and Personal Care
- Agriculture
- Other Applications
- By End-User Industry
- Automotive
- Construction
- Pharmaceutical and Healthcare
- Food and Beverages
- Consumer Goods
- Agriculture
- Electronics
- Others
- By Geography
- Asia Pacific
- China
- India
- Japan
- South Korea
- Rest of Asia-Pacific
- North America
- United States
- Canada
- Mexico
- Europe
- Germany
- United Kingdom
- France
- Italy
- Rest of Europe
- South America
- Brazil
- Argentina
- Rest of South America
- Middle-East and Africa
- Saudi Arabia
- South Africa
- Rest of Middle-East and Africa
- Asia Pacific
Detailed Research Methodology and Data Validation
Primary Research
Analysts spoke with purchasing managers at coatings formulators across Asia-Pacific and Europe, feedstock processors in Brazil and the US Midwest, and market development chemists at solvent innovators. These conversations validated pricing spreads, adoption triggers, and substitution hurdles that secondary data alone could not uncover.
Desk Research
We began with open datasets such as the US EPA Toxic Release Inventory, Eurostat PRODCOM trade codes for lactic acid and esters, UN Comtrade import-export flows, and regulatory dockets from ECHA. Company 10-Ks, sustainability reports, and filings retrieved through Dow Jones Factiva and D&B Hoovers supplied production capacity and revenue clues, while trade associations such as the Bio-Based and Renewable Products Advocacy Group and the American Coatings Association refined end-use demand indicators. This list is illustrative; many additional sources fed our desk review.
Market-Sizing & Forecasting
A top-down market pool was reconstructed from bio-refinery output, regional consumption coefficients, and solvent yield factors. Sampled ASP × volume roll-ups and shipment records from Volza then cross-checked the totals. Key variables like corn and sugar prices, announced bio-refinery capacity, VOC-regulation stringency scores, coatings output index, and the bio/petro price spread drive our multivariate-regression forecast to 2030. Where supplier counts were sparse, adoption rates from expert calls bridged gaps before final triangulation.
Data Validation & Update Cycle
Model outputs pass variance checks versus independent trade, price, and emission datasets, followed by a two-level analyst peer review. We refresh numbers annually and trigger interim updates for material events, ensuring clients always receive the latest viewpoint.
Why Mordor's Green And Bio-Based Solvents Baseline Earns Unmatched Trust
Published figures often diverge because firms choose different cut-off years, product baskets, or regional coverage. Our analysts lock definitions to commercially relevant bio-derived chemistries, apply a disciplined refresh cadence, and reconcile value and volume through dual-sourced price curves, which rivals rarely disclose.
Key gap drivers include: (1) some publishers lump water-borne cleaners while others omit agricultural grades; (2) baseline years vary, distorting CAGR optics; (3) a few models ignore Asia-Pacific import surges recorded in customs data; (4) exchange-rate assumptions differ.
Benchmark comparison
| Market Size | Anonymized source | Primary gap driver |
|---|---|---|
| USD 6.29 B (2025) | Mordor Intelligence | - |
| USD 4.68 B (2023) | Regional Consultancy A | Earlier base year and narrower application set reduce headline value |
| USD 1.91 B (2023) | Global Consultancy B | Focuses mainly on lactate esters and omits Asia-Pacific volumes |
These contrasts show how Mordor's transparent scoping, current baseline, and multi-source validation provide decision-makers with the most dependable starting point for planning.


Key Questions Answered in the Report
What was the green and bio-based solvents market size in 2026?
It reached USD 6.32 billion in 2026 and is forecast to grow to USD 9.39 billion by 2031.
Which solvent type holds the largest share?
Bio-alcohols led with a 37.22% green and bio-based solvents market share in 2025.
Which application is expanding fastest?
Pharmaceutical uses are growing at a 10.38% CAGR between 2026 and 2031.
Why is Asia Pacific the leading region?
China’s bio-economy plan and India’s pharmaceutical export growth boosted Asia Pacific to a 45.67% revenue share in 2025 with an 8.92% CAGR outlook.
How do government incentives influence adoption?
US 45Z tax credits, EU Innovation Fund grants, and Brazil’s RenovaBio credits reduce production costs and accelerate capacity expansion for bio-solvents.
Page last updated on:


