Graphic Film Market Size and Share
Market Overview
| Study Period | 2020 - 2031 |
|---|---|
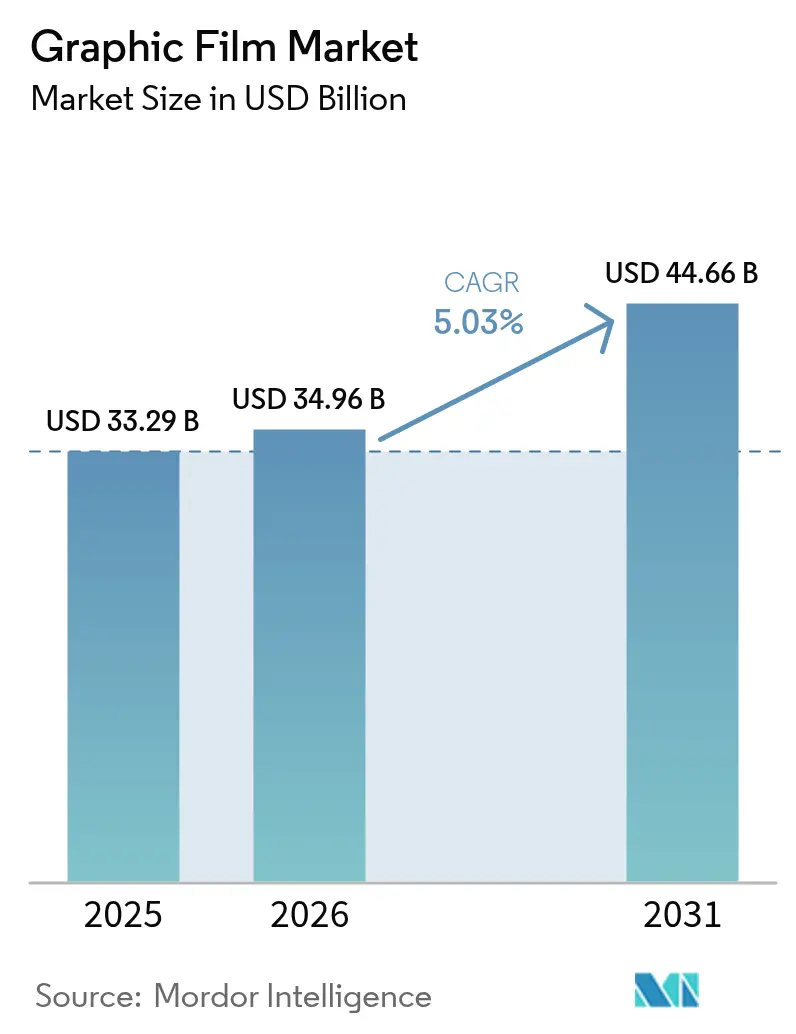
| Market Size (2026) | USD 34.96 Billion |
| Market Size (2031) | USD 44.66 Billion |
| Growth Rate (2026 - 2031) | 5.03% CAGR |
| Fastest Growing Market | Asia Pacific |
| Largest Market | Asia Pacific |
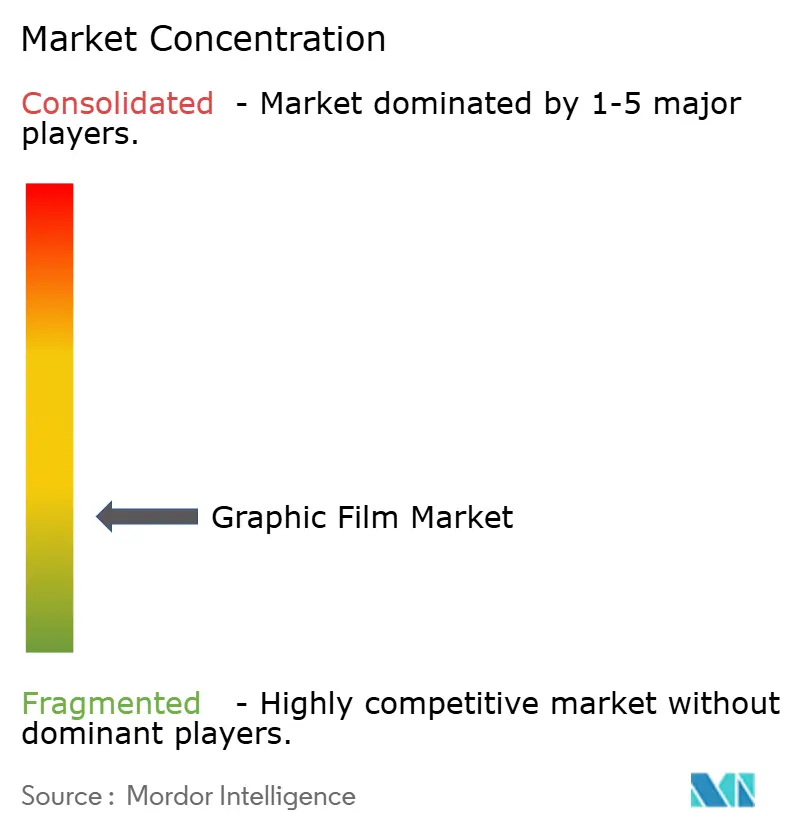
| Market Concentration | Low |
Major Players *Disclaimer: Major Players sorted in no particular order Image © Mordor Intelligence. Reuse requires attribution under CC BY 4.0. | |
Graphic Film Market Analysis by Mordor Intelligence
The graphic films market size in 2026 is estimated at USD 34.96 billion, growing from 2025 value of USD 33.29 billion with 2031 projections showing USD 44.66 billion, growing at 5.03% CAGR over 2026-2031. Rising construction modernization, rapid adoption of digital printing, and widening brand‐promotion needs keep demand resilient. Manufacturers are channeling R&D efforts into UV-inkjet-compatible products that reduce curing times, enhance color fidelity, and lower volatile organic compound emissions. Meanwhile, the Asia-Pacific region benefits from a growing polymer production scale and burgeoning infrastructure pipelines, making it the volume and growth engine of the graphic films market. Despite PVC’s dominance, regulatory pressure is steering the fastest growth toward recyclable PET substrates, while volatile raw material prices and photoinitiator shortages intermittently erode margins.
Key Report Takeaways
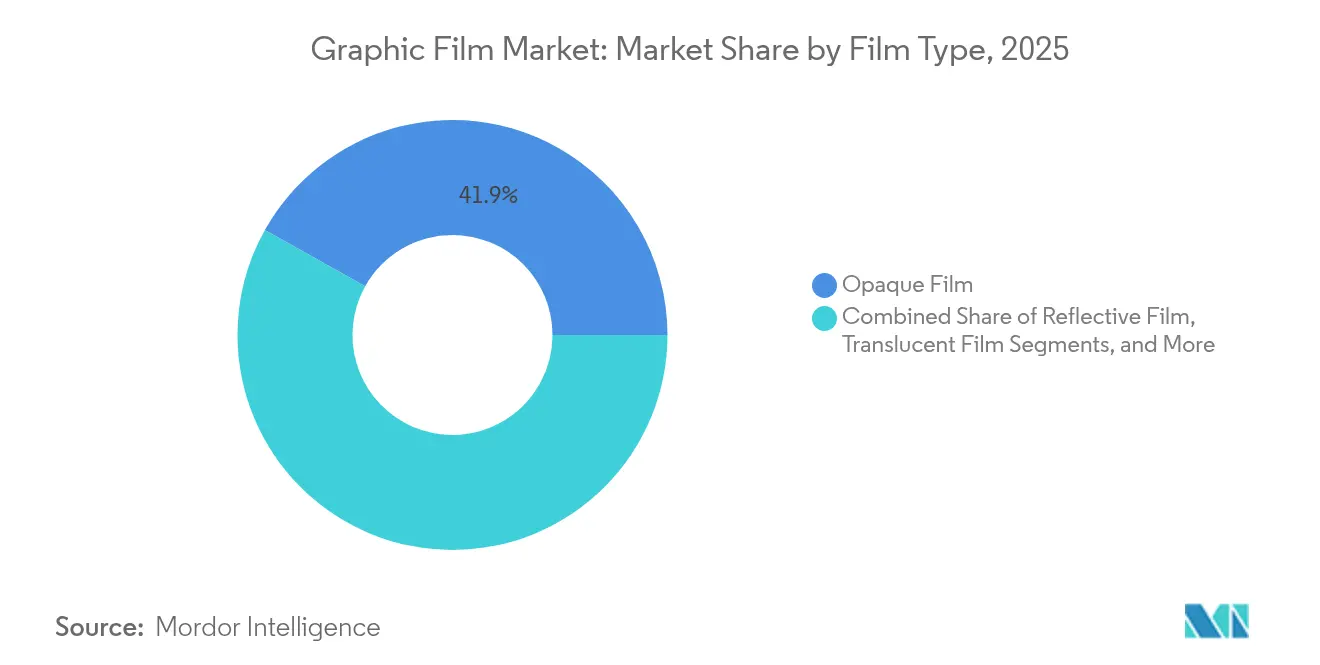
- By film type, opaque films accounted for 41.88% of the graphic film market share in 2025.
- By polymer, the graphic film market size for PET is projected to expand at a 6.12% CAGR between 2026-2031.
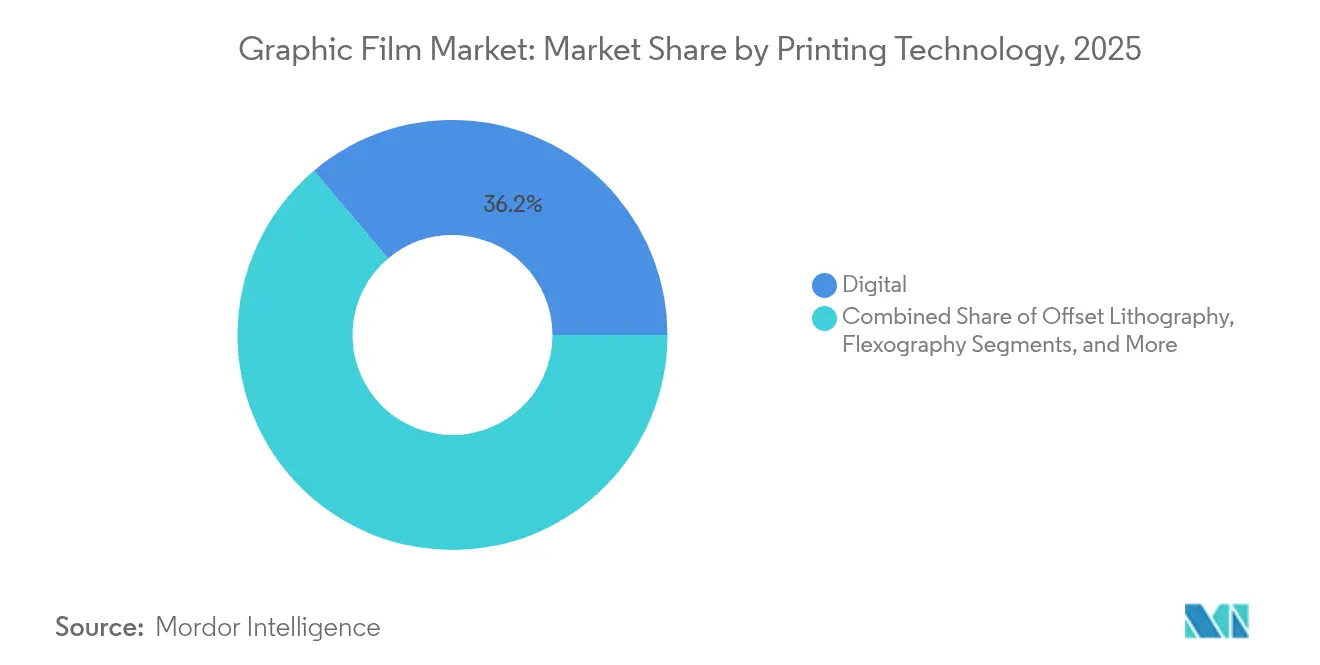
- By printing technology, digital captured a 36.15% share of the graphic films market size in 2025.
- By end-user industry, the graphic film market size for building and construction applications is expected to grow at a 6.6% CAGR between 2026-2031.
- By region, the Asia-Pacific region led with a 45.30% market share of the graphic films market in 2025.
Note: Market size and forecast figures in this report are generated using Mordor Intelligence’s proprietary estimation framework, updated with the latest available data and insights as of 2026.
Global Graphic Film Market Trends and Insights
Drivers Impact Analysis*
| Driver | (~) % Impact on CAGR Forecast | Geographic Relevance | Impact Timeline |
|---|---|---|---|
| Growth in the construction industry and higher living standards | 1.8% | Global, with APAC and Middle East leading | Medium term (2-4 years) |
| Rising demand for vehicle-wrap and fleet graphics | 1.2% | North America and Europe core, expanding to APAC | Short term (≤ 2 years) |
| Penetration of digital and UV-inkjet printing technologies | 1.5% | Global, with early adoption in developed markets | Medium term (2-4 years) |
| Expansion of retail PoS and way-finding signage | 0.9% | Global, concentrated in urban centers | Short term (≤ 2 years) |
| Emerging antimicrobial graphic films in healthcare settings | 0.4% | North America and Europe, expanding globally | Long term (≥ 4 years) |
| Adoption of electrochromic/smart glazing graphic films | 0.3% | North America and Europe, pilot projects in APAC | Long term (≥ 4 years) |
| Source: Mordor Intelligence | |||
Growth in the construction industry and higher living standards
Urbanization across Asia-Pacific and the Middle East spurs large-scale infrastructure builds that specify graffiti-resistant, long-life graphic films for wayfinding and façade branding. Project owners integrate Building Information Modeling with graphic film specifications, enabling precise material planning and lower installation waste. Architects favor customizable finishes that merge aesthetics with energy-efficient glazing, widening application breadth. Government stimulus for transport hubs, public housing, and smart cities anchors volume commitments. As living standards rise, residential developers are adopting interior decorative films that meet green certification goals, thereby reinforcing the medium-term growth of the graphic films market.
Rising demand for vehicle-wrap and fleet graphics
Fleet operators shift from paint to film wraps to achieve rapid brand makeovers and paint protection in one step. Surging electric vehicle fleets intensify demand for lightweight, easily updatable graphics that minimize drag and power consumption. Ride-sharing and last-mile delivery companies frequently refresh their campaign artwork, favoring removable, low-adhesion films. Premium wraps enhance resale values and reduce downtime, as entire fleets can be rebranded overnight. Growth momentum in APAC follows the U.S. and European adoption curves as small businesses adopt wraps for hyper-local marketing, supporting a near-term uplift in the graphic films market.
Penetration of digital and UV-inkjet printing technologies
UV-inkjet presses eliminate plate-making steps, reduce cure cycles, and improve scratch resistance, thereby significantly reducing turnaround times for converters. Digital workflows integrate with cloud-based color management and predictive maintenance, reducing waste while enabling mass personalization at scale. Lower minimum order quantities invite small retailers and artisans who previously lacked access to professional-grade films. As solvent-based emissions decline, compliance costs fall, widening global acceptance. Equipment upgrades accelerate film innovation because converters demand substrates engineered for higher ink loads and faster throughput, raising the value of digital-ready products within the graphic films market.
Expansion of retail PoS and way-finding signage
Omnichannel retailers rely on durable yet replaceable films for seasonal promotions and QR-enabled shopper engagement that bridges online and in-store journeys. High-contrast films enhance accessibility compliance for visually impaired patrons ADA regulations. Urban transit authorities deploy reflective way-finding graphics that reduce maintenance costs compared to painted signs and withstand the removal of graffiti solvents. Integrated Near-Field Communication tags turn static signage into data-rich touchpoints that track shopper flows. These factors sustain steady demand for premium films in retail and smart public-space environments, thereby enhancing overall growth prospects for the graphic films market.
Restraints Impact Analysis*
| Restraint | (~) % Impact on CAGR Forecast | Geographic Relevance | Impact Timeline |
|---|---|---|---|
| Volatility in prices of PVC, PET and specialty additives | -1.1% | Global, with Asia-Pacific manufacturing most affected | Short term (≤ 2 years) |
| Stringent regulations on PVC and solvent-based inks | -0.8% | Europe and North America leading, expanding globally | Medium term (2-4 years) |
| Limited recyclability hindering green-building certification | -0.5% | Europe and North America, expanding to APAC | Medium term (2-4 years) |
| Supply shortages of photoinitiators for UV-cure inks | -0.3% | Global, concentrated in specialized chemistry supply chains | Short term (≤ 2 years) |
| Source: Mordor Intelligence | |||
Volatility in prices of PVC, PET and specialty additives
Swinging crude oil and energy costs ripple through PVC and PET resin markets, compressing converter margins on long-term contracts. Concentrated supply in Asia magnifies geopolitical and weather-related disruptions that can idle downstream coating lines. Specialty additives, such as UV stabilizers and plasticizers, often come from narrow supplier pools with limited ramp-up capability, resulting in spot shortages. Producers respond by dual-sourcing, expanding resin capacity closer to demand centers, and introducing price-adjustment clauses, yet cost unpredictability remains a drag on the graphic films market.
Stringent regulations on PVC and solvent-based inks
European REACH and evolving U.S. state laws restrict certain plasticizers and solvent emissions, forcing reformulation and capital spending on alternative chemistries. LEED and BREEAM scoring frameworks discount PVC content, influencing specifiers to favor PET or polypropylene even when performance trade-offs exist.[1]U.S. Green Building Council, “LEED v4.1 Building Design and Construction,” usgbc.org Compliance testing and label changes can significantly increase overhead, particularly for small converters. Although complete PVC bans are rare, mounting certification hurdles slow the adoption of PVC in new green-building projects, tempering the medium-term expansion of the graphic films market.
*Our forecasts treat driver/restraint impacts as directional, not additive. The impact forecasts reflect baseline growth, mix effects, and variable interactions.
Segment Analysis
By Film Type: Opaque films cement broad utility
Opaque films accounted for 41.88% of the graphic films market share in 2025, driven by their universal suitability for vehicle wraps, storefronts, and façade graphics. These films mask substrate flaws and deliver vivid branding, sustaining high-volume demand. Innovations now target UV-inkjet compatibility and low-temperature pliability, broadening end-use scenarios across climates. In contrast, reflective films, driven by safety regulations and energy-saving mandates, outpace the total graphic films market at a 7.05% CAGR. Transparent and translucent variants gain niche share in retail showcases and backlit architectural elements. Suppliers expand their portfolios with antimicrobial and graffiti-resistant topcoats, which help lift average selling prices.
Reflective film adoption accelerates as transportation departments mandate higher retroreflectivity for road signs and railcars. Architects specify heat-reflective window films that cut HVAC loads, linking optics to sustainability targets. Meanwhile, installers favor next-generation opaque films featuring repositionable adhesives that cut labor time by 10-15%. ORAFOL’s USD 165–175 million expansion underpins supply security for multiple film classes, underscoring confidence in long-range demand. Collectively, these dynamics entrench film-type diversity and fuel healthy revenue streams in the graphic films market.


By Polymer: PVC retains scale as PET rises
PVC controlled 62.98% of the global graphic films market size in 2025, owing to its low cost, ease of calendering, and robust adhesion on irregular surfaces. Yet, sustainability drivers and scrutiny of plasticizers propel PET volumes, driving the material at a 6.12% CAGR. PET’s recyclability appeals to specifiers chasing circular-economy credits, especially in Europe. Polypropylene and polyethylene remain in specialized niches where chemical resistance or tearability is essential.
The pending PFAS phase-out forces value-chain adjustments in high-durability topcoats, creating white space for novel resins. PET investments in Alabama by Polyplex diversify the North American supply and shorten lead times for converters hit by freight volatility. Producers hedge by developing PVC-free portfolios that match flexibility and printability benchmarks. Success here would realign polymer shares, yet near-term economics keep PVC at the helm of the graphic films market.
By Printing Technology: Digital gains critical mass
Digital platforms accounted for 36.15% of the graphic films market share in 2025, as converters adopted instant changeover and data-driven personalization. UV-inkjet heads drive sub-segment growth at a 7.58% CAGR, combining speed with low emissions. Screen printing retains niches that require heavy ink laydown or special textures, while flexography and offset printing are more suitable for very high-run jobs where per-unit economics dominate.
Artificial intelligence now predicts nozzle health, aligning quality with first-time-right goals that save media waste. Photoinitiator shortages briefly capped UV capacity in 2024, but supply stabilized after specialty chemical producers added reactors, reinstating confidence for expansion. Inline color management tools assure brand consistency across global campaigns. Consequently, the technology mix continues to shift towards digital, reinforcing structural changes within the graphic films market.
By End-User Industry: Construction pulls ahead
Advertising and promotion maintained a 41.22% revenue share in 2025 by leaning on quick-change graphics for omnichannel campaigns. Film suppliers offer high-tack, bubble-free adhesives that speed up window-front installations. Construction outpaces all others at 6.6% CAGR as architects fold films into curtain walls, elevator cabs, and smart façades that double as energy moderators. Automotive wraps are growing alongside the rollouts of electric vehicles, and healthcare is adopting antimicrobial films to curb hospital-acquired infections.
Growing public-sector budgets for smart transit nodes diversify demand beyond retail, expanding it to other sectors. Silver-ion embedded films receive approvals under EPA antimicrobial listings, enabling hospital and mass transit deployments that command premium pricing. Such varied use cases shield suppliers from cyclical dips in any single vertical, lending stability to the broader graphic films market.
Geography Analysis
The Asia-Pacific region secured 45.30% of global revenue in 2025 and is expected to grow at a 7.28% CAGR to 2031, driven by unmatched polymer capacity and government infrastructure agendas. China’s Belt and Road projects, India’s smart-city initiatives, and the relocation of Southeast Asian manufacturing continually widen their application breadth. Domestic converters benefit from short lead times and rising middle-class consumption that lifts automotive wraps and retail signage volumes.
North America’s demand is mature yet value-rich, centered on premium wraps, solar-control window films, and antimicrobial coatings. Polyplex’s new PET line in Alabama secures local feedstock, trimming dependency on imports and sharpening cost predictability. Regulatory leadership in low-VOC inks and recyclable substrates prompts converters to pioneer sustainable offerings, which later cascade worldwide.
Europe matches North America in terms of technology adoption and sustainability regulations. REACH updates and discussions on the plastic tax accelerate the adoption of PVC alternatives and the migration to solvent-free inks, influencing product formulation globally. Elsewhere, the Middle East leverages tourism and mega-event developments for signage demand, while South America’s infrastructure revival in Brazil and Mexico nurtures moderate growth. These multi-regional trends collectively reinforce the expansion outlook for the graphic films market.


Competitive Landscape
The graphic films market remains moderately concentrated. 3M, Avery Dennison, and ORAFOL utilize global distribution, extensive R&D, and robust patent portfolios to maintain their market share. Mid-tier and regional firms compete on cost or niche capabilities, such as specialty textures or eco-labels.
Acquisition trails, such as ORAFOL’s purchases of Reflexite, Rowland, Kay Automotive Graphics, and NUPRO, illustrate capability stacking to fill portfolio gaps.[3]ORAFOL Europe GmbH, “Strategic Growth Through Acquisitions,” orafol.com Technology alliances with printer OEMs ensure substrate-ink compatibility that lowers field failures and brand recalls. Capacity investments cluster near demand centers to hedge freight and geopolitical risks.
Meanwhile, sustainability keys open new revenue corridors: antimicrobial coatings for healthcare settings and smart glazing for electrochromic façades. The race to deliver PVC-free or solvent-free solutions without cost penalties will shape future competitive order in the graphic films market.
Graphic Film Industry Leaders
3M Company
Avery Dennison Corporation
CCL Industries Inc.
Spandex AG
Hexis S.A.S.
- *Disclaimer: Major Players sorted in no particular order

Recent Industry Developments
- January 2025: Polyplex commenced operations at its new USD 100 million PET film plant in Alabama, boosting North American substrate supply.
- October 2024: Avery Dennison logged robust growth in the Graphics and Reflective segment, citing momentum in vehicle wraps and the adoption of digital printing.
- September 2024: 3M outlined timelines for phasing out PFAS chemistries, affecting certain high-performance graphic films lines.
- June 2024: Garware Hi-Tech Films reported strong sales in paint-protection and specialty segments, supported by capacity additions.


Global Graphic Film Market Report Scope
A graphic film has a sheet or layer made of polymer compounds. It is applied to the surface for protection from weather conditions with promotional intentions. The report on the graphic film market studies different polymeric films used for printing images or visual representations on the film's surface to share information. Graphic films are used in various end-user industries, such as automotive, institutional, promotional, and advertising, to create unique appearances to enhance the material or object. The market is segmented by different geographies, such as North America, Europe, Asia-Pacific, and the Rest of the World. Further, the study also covers the impact of COVID-19 on the graphic film market in different regions.
| Opaque Film |
| Transparent Film |
| Translucent Film |
| Reflective Film |
| Polyvinyl Chloride (PVC) |
| Polypropylene (PP) |
| Polyethylene (PE) |
| Polyethylene Terephthalate (PET) |
| Other Polymers |
| Digital |
| Flexography |
| Offset Lithography |
| Rotogravure |
| Screen Printing |
| Automotive |
| Advertising and Promotion Agencies |
| Building and Construction |
| Institutional and Public Infrastructure |
| Other End-User Industries |
| North America | United States | |
| Canada | ||
| Mexico | ||
| South America | Brazil | |
| Argentina | ||
| Chile | ||
| Rest of South America | ||
| Europe | United Kingdom | |
| Germany | ||
| France | ||
| Italy | ||
| Spain | ||
| Russia | ||
| Rest of Europe | ||
| Asia-Pacific | China | |
| India | ||
| Japan | ||
| South Korea | ||
| Australia | ||
| Rest of Asia-Pacific | ||
| Middle East and Africa | Middle East | Saudi Arabia |
| United Arab Emirates | ||
| Turkey | ||
| Rest of Middle East | ||
| Africa | South Africa | |
| Nigeria | ||
| Rest of Africa | ||
| By Film Type | Opaque Film | ||
| Transparent Film | |||
| Translucent Film | |||
| Reflective Film | |||
| By Polymer | Polyvinyl Chloride (PVC) | ||
| Polypropylene (PP) | |||
| Polyethylene (PE) | |||
| Polyethylene Terephthalate (PET) | |||
| Other Polymers | |||
| By Printing Technology | Digital | ||
| Flexography | |||
| Offset Lithography | |||
| Rotogravure | |||
| Screen Printing | |||
| By End-User Industry | Automotive | ||
| Advertising and Promotion Agencies | |||
| Building and Construction | |||
| Institutional and Public Infrastructure | |||
| Other End-User Industries | |||
| By Geography | North America | United States | |
| Canada | |||
| Mexico | |||
| South America | Brazil | ||
| Argentina | |||
| Chile | |||
| Rest of South America | |||
| Europe | United Kingdom | ||
| Germany | |||
| France | |||
| Italy | |||
| Spain | |||
| Russia | |||
| Rest of Europe | |||
| Asia-Pacific | China | ||
| India | |||
| Japan | |||
| South Korea | |||
| Australia | |||
| Rest of Asia-Pacific | |||
| Middle East and Africa | Middle East | Saudi Arabia | |
| United Arab Emirates | |||
| Turkey | |||
| Rest of Middle East | |||
| Africa | South Africa | ||
| Nigeria | |||
| Rest of Africa | |||


Key Questions Answered in the Report
How large is the graphic films market in 2026?
It reached USD 34.96 billion and is forecast to register a 5.03% CAGR to 2031 over 2026-2031.
Which polymer type leads current demand?
PVC accounts for 62.98% share due to cost and processing advantages, but PET is gaining fastest.
Why is Asia-Pacific dominant?
The region mixes vast polymer production scale with heavy infrastructure investment, securing 45.30% share in 2025.
What technology is growing quickest?
UV-inkjet digital printing is expanding at 7.58% annually thanks to swift curing and low emissions.
Which end-use segment is accelerating fastest?
Building and construction applications are rising at a 6.6% CAGR as projects integrate durable and aesthetic films.
Page last updated on:


