Granular Urea Market Size and Share
Market Overview
| Study Period | 2021 - 2031 |
|---|---|
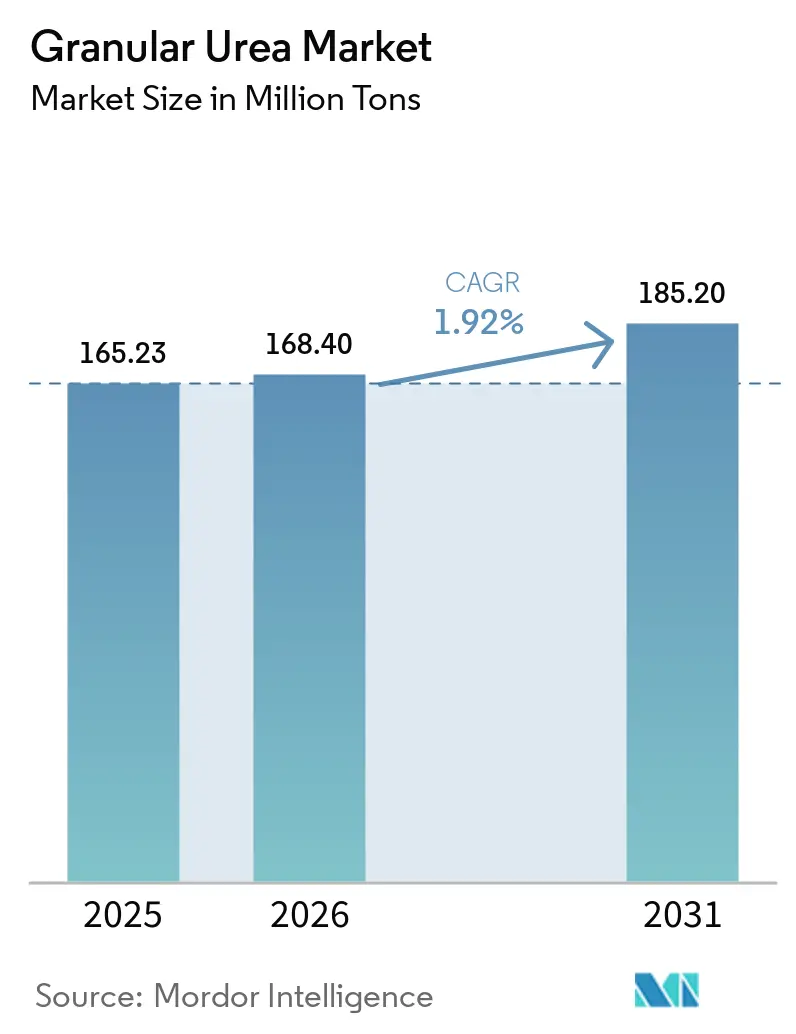
| Market Volume (2026) | 168.40 Million tons |
| Market Volume (2031) | 185.20 Million tons |
| Growth Rate (2026 - 2031) | 1.92% CAGR |
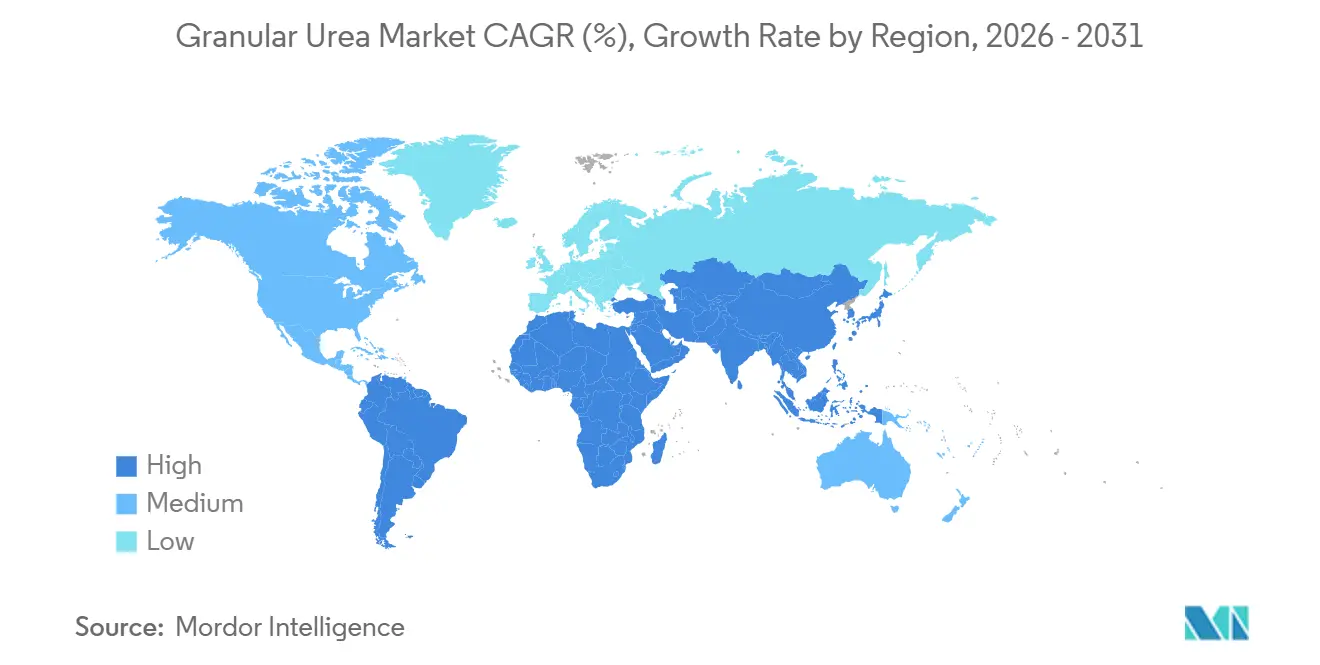
| Fastest Growing Market | Asia Pacific |
| Largest Market | Asia Pacific |
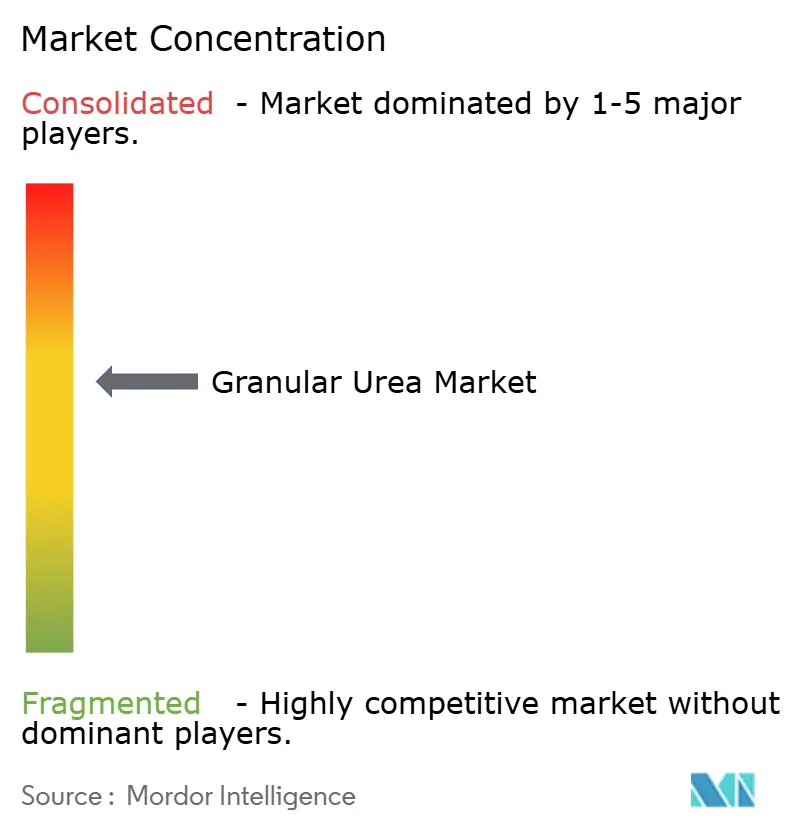
| Market Concentration | Medium |
Major Players *Disclaimer: Major Players sorted in no particular order Image © Mordor Intelligence. Reuse requires attribution under CC BY 4.0. | |
Granular Urea Market Analysis by Mordor Intelligence
The Granular Urea Market size is projected to expand from 165.23 Million tons in 2025 and 168.40 Million tons in 2026 to 185.20 Million tons by 2031, registering a CAGR of 1.92% between 2026 to 2031. This indicates a steady increase in global demand for nitrogen fertilizers. Key factors influencing cost dynamics and trade patterns include fluctuations in natural gas prices, the European Union's Carbon Border Adjustment Mechanism (CBAM), which will impose tariffs of EUR 50-75 per ton CO₂-equivalent on imported nitrogen products starting October 2026, and China's export restrictions effective March 2026, which ban nitrogen-potassium blends and set price caps on urea exports. Agricultural-grade products continue to dominate the market, driven by traditional nutrient management practices in cereals, rice, and oilseeds, where cost considerations outweigh emission intensity concerns. However, industrial users are increasingly adopting dust-free granules due to their uniform particle size, which is essential for applications in adhesives, resins, and selective catalytic reduction systems. Competitive dynamics in the market show moderate intensity. Exporters from the Middle East and Nigeria, benefiting from natural gas prices below USD 3/MMBtu, are strategically underpricing European producers, who face higher winter gas prices exceeding USD 10/MMBtu.
Key Report Takeaways
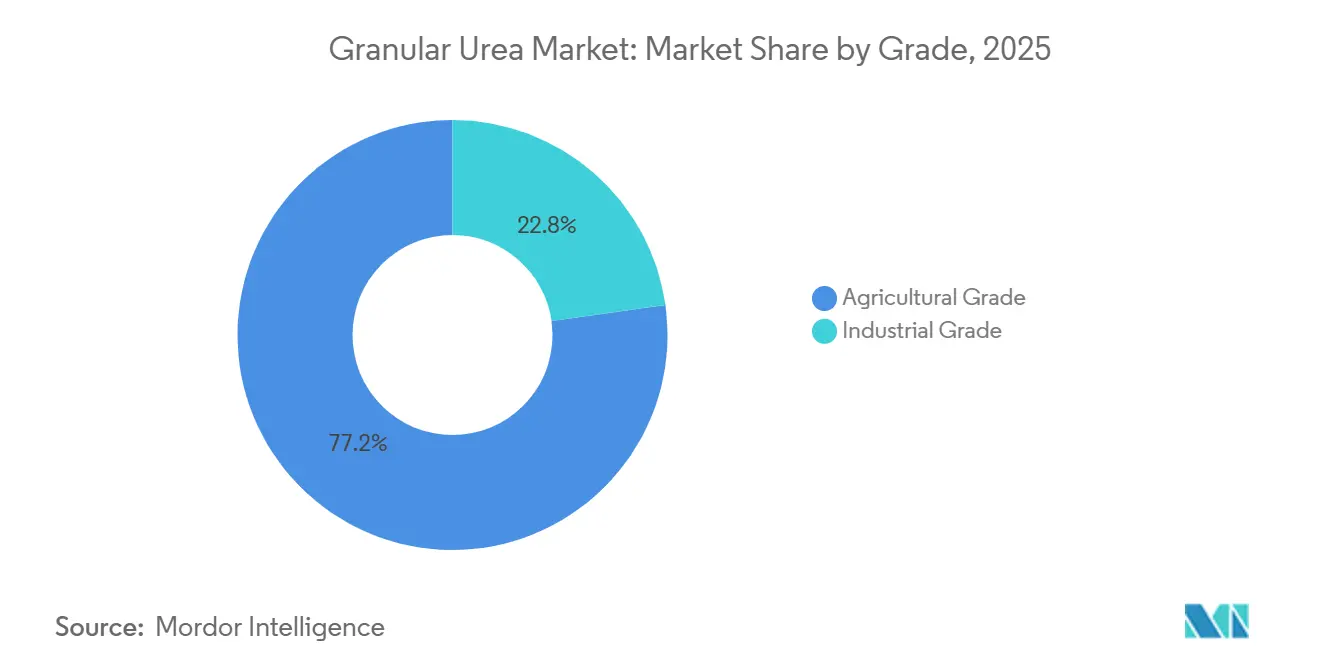
- By grade, Agricultural Grade led with 77.23% of the Granular Urea market share in 2025, while Industrial Grade is forecast to expand at a 2.31% CAGR between 2026 and 2031.
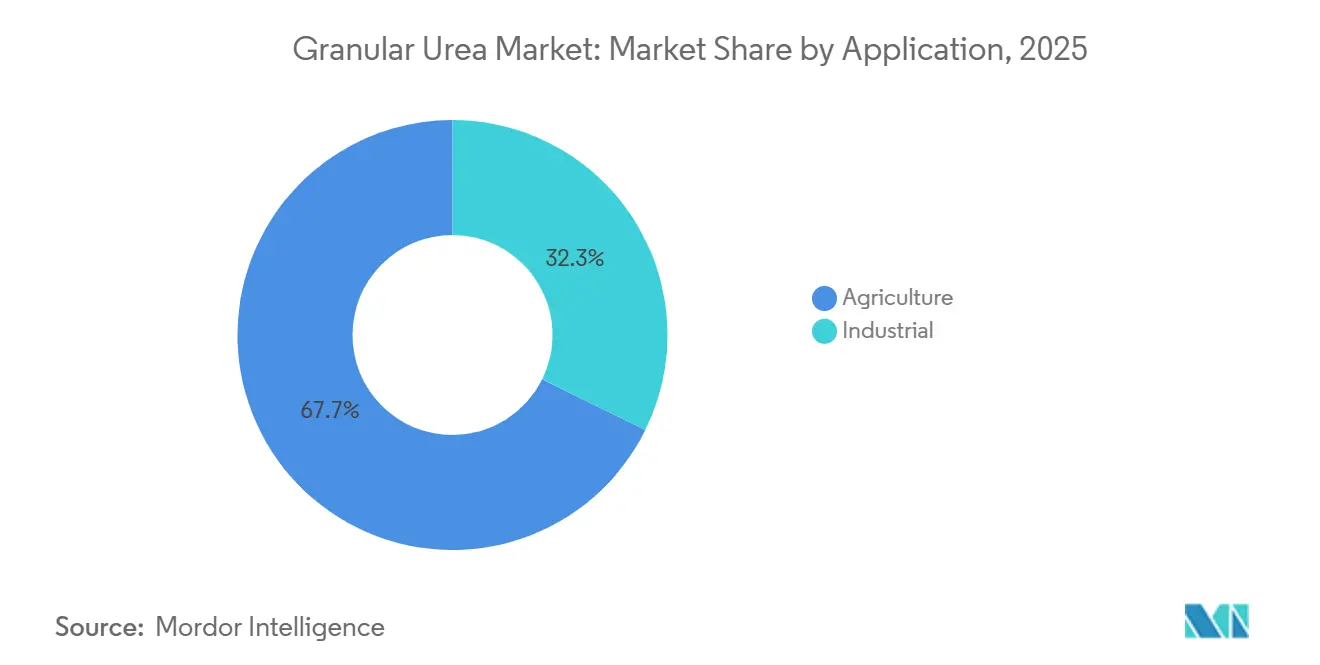
- By application, Agriculture commanded the 67.71% of the Granular Urea market size in 2025, whereas Industrial uses are advancing at a 2.42% CAGR between 2026 and 2031.
- By geography, Asia-Pacific accounted for 45.22% of global volume in 2025 and is set to grow at a 2.23% CAGR over the forecast period (2026-2031).
Note: Market size and forecast figures in this report are generated using Mordor Intelligence’s proprietary estimation framework, updated with the latest available data and insights as of January 2026.
Global Granular Urea Market Trends and Insights
Drivers Impact Analysis*
| Driver | (~)% Impact on CAGR Forecast | Geographic Relevance | Impact Timeline |
|---|---|---|---|
| Rising demand for nitrogen fertilizers | +0.6% | Global, with peak intensity in Asia-Pacific (India, ASEAN), South America (Brazil, Argentina) | Medium term (2-4 years) |
| Government subsidies and fertilizer support programs | +0.5% | Asia-Pacific (India, China), South America (Brazil), select Middle East & Africa markets | Short term (≤ 2 years) |
| Shift to granular over prilled urea for better handling | +0.3% | North America, Europe, Asia-Pacific industrial hubs | Medium term (2-4 years) |
| Automated bulk-blending facilities favor dust-free granules | +0.2% | North America, Europe, Australia | Long term (≥ 4 years) |
| Digital ag-marketplaces enabling micro-batch procurement | +0.2% | Global, early gains in North America, Europe, India | Long term (≥ 4 years) |
| Source: Mordor Intelligence | |||
Rising Demand for Nitrogen-based Fertilizers
In 2025, global cereal and oilseed acreage grew by 2.1 million hectares, leading to an additional demand of 1.2 million tons of nitrogen. Granular formulations gained popularity, as their reduced dust levels not only lessen respiratory issues but also align with the stringent occupational health standards set by the U.S. and the European Union[1]OSHA, “Respiratory Protection Standard,” osha.gov. In 2025, India saw a 28% surge in nitrogen fertilizer imports, totaling 4.1 million tons, up from 2024. This spike was largely due to erratic monsoons, which compressed planting windows and heightened the preference for quick-dissolving granules. Adoption of precision agriculture soared to 42% across U.S. corn and soybean fields. This approach, allowing for variable-rate placement, has curtailed over-application by as much as 18%, simultaneously boosting the demand for uniform granules that work seamlessly with pneumatic spreaders. Additionally, the consistent rice cycles in Vietnam, Thailand, and Indonesia have further stabilized purchasing patterns. Together, these agricultural trends have driven up nitrogen consumption.
Government Subsidies and Fertilizer Support Programs
India allocated approximately USD 13 billion for fertilizer subsidies in FY 2025-2026, setting a retail cap of INR 266 per 45 kg for urea. This move comes even as global prices surged past USD 400 per ton CFR, a strategy aimed at shielding smallholders from the volatility of feedstock costs. Meanwhile, Brazil's "Plano Safra 2025-2026" unveiled a substantial BRL 400.59 billion (around USD 80 billion) in rural credit. This financial boost has kept import demand robust, even with Petrobras reactivating its urea units in Sergipe and Bahia in January 2026. In Argentina, preferential credit measures led to a notable 28% surge in nitrogen imports, reaching 4.1 million tons. While these initiatives currently support baseline demand, policymakers are increasingly directing funds towards nano-liquid and inhibitor-coated products. This shift aims to mitigate nitrous oxide emissions, suggesting that the uplift in the granular urea market may wane post-2028.
Shift to Granular Over Prilled Urea for Better Handling
European and North American distributors, bound by stringent air-quality mandates, value spherical 2-4 mm granules for producing 40-60% less dust than their 1-2 mm prill counterparts. In Canada and the U.S., bulk-blending sites are increasingly opting for these granules, willing to pay a premium of USD 10-20 per ton to sidestep issues like conveyor blockages and NPK contamination. Additionally, the granules' lower hygroscopicity grants them a shelf life extension of up to 20% in coastal depots compared to prills. This advantage bolsters their adoption, even amidst ongoing price sensitivity from smallholders in Sub-Saharan Africa. As automated blending technologies make their way to Asia and Latin America, the granular urea market reaps the rewards, even if progress is more measured in lower-income areas.
Automated Bulk-Blending Facilities Favor Dust-Free Granules
In North America and Europe, robotic NPK facilities process over 15 million tons each year. When switching from prilled urea to dust-free granules, these facilities experience a 25-35% reduction in downtime. This transition translates to annual maintenance savings of approximately USD 50,000-100,000 per plant. In the U.S., Nutrien's 200-plus retail blending sites are already adjusting for granular feeds, aligning with prescription maps from digital agronomy platforms. Similarly, cooperative hubs in Western Australia and Victoria are implementing these specifications to prevent cross-contamination and weight discrepancies. This trend underscores a sustained demand for granules, even in regions where manual blending remains prevalent.
Restraints Impact Analysis*
| Restraint | (~)% Impact on CAGR Forecast | Geographic Relevance | Impact Timeline |
|---|---|---|---|
| Volatile natural-gas and ammonia feedstock costs | -0.4% | Global, acute in Europe, Asia-Pacific import markets | Short term (≤ 2 years) |
| Tightening regulations on nitrate runoff and eutrophication | -0.3% | Europe, North America, China coastal provinces | Medium term (2-4 years) |
| European Union quotas mandating enhanced-efficiency urea share | -0.3% | Europe (EU-27), spillover to UK and EFTA nations | Medium term (2-4 years) |
| Source: Mordor Intelligence | |||
Volatile Natural-Gas and Ammonia Feedstock Costs
In 2025, European gas prices fluctuated between USD 6 and USD 14 per MMBtu. These swings translated into ammonia costs, which accounted for 70-80% of urea's cash expenses. Consequently, when prices spiked and margins were erased, producers cut back on winter production. Meanwhile, at the U.S. Gulf Coast, ammonia prices surged from USD 450 per ton in Q1 2025 to USD 620 per ton by October[2]U.S. Energy Information Administration, “Natural Gas Prices,” eia.gov. This spike followed Hurricane Francine's closure of Louisiana plants, tightening margins for downstream granules. Such high volatility has made long-term offtake contracts less appealing. In fact, Brazilian importers, aiming to sidestep peak prices, sourced 60% of their 2025 urea on spot terms, a jump from 40% in 2024. This uncertainty has also stalled capacity expansions. Companies like CF Industries and Yara are now favoring investments in blue ammonia, which ensures compliance with the Carbon Border Adjustment Mechanism (CBAM), over traditional expansions.
Environmental Impacts of Nitrate Leaching and Eutrophication
The European Union (EU) Nitrates Directive caps allowable nitrogen applications and requires water-quality monitoring that has already lowered blanket fertilizer rates in Denmark and the Netherlands. [2]European Commission, “Nitrates Directive—Implementation Report,” europa.eu Peer-reviewed field trials in Spain show synthetic urea can leach nitrates at rates 30% higher than organic amendments, especially in irrigated vegetables. In China, urea use still sits 33% above the global safety threshold, and the agriculture ministry attributes 16% of national agricultural greenhouse-gas emissions to fertilizer N₂O in 2024. Waterway eutrophication in the US Great Lakes prompts stricter state rules encouraging controlled-release or inhibitor-enhanced formulations. These environmental constraints nudge demand toward efficiency-oriented products but may limit absolute tonnage growth where regulation is most stringent.
*Our forecasts treat driver/restraint impacts as directional, not additive. The impact forecasts reflect baseline growth, mix effects, and variable interactions.
Segment Analysis
By Grade: Agricultural Applications Drive Volume Growth
In 2025, agricultural-grade granules dominated demand capturing 77.23%, driven by India's consumption of 28 million tons during the kharif and rabi seasons, alongside Brazil's application of 6.2 million tons for soybeans and corn. Despite this substantial demand, the agricultural segment of the granular urea market is projected to grow at a modest CAGR through 2031. This tempered growth is attributed to India's push for nano-liquid alternatives, which aim to replace 30-50% of conventional nitrogen, and tightening usage caps in the EU. While farmers value the granules for their low dust content in mechanized seeders, the allure of controlled-release and inhibitor-coated products, bolstered by subsidy support, has moderated the market's expansion.
In 2025, industrial-grade granules occupied a smaller market share but are on track to grow at a 2.31% CAGR. This growth is driven by demand from formaldehyde-based wood composites, melamine feed, and selective catalytic reduction reagents, all of which require consistently sized, low-biuret granules. The industrial sector's adoption of these granules not only insulates producers from the volatility of farm subsidies but also allows them to maintain a pricing premium of 15-25%.


By Application: Industrial Segment Emerges as Growth Driver
In 2025, agriculture accounted for 67.71% of the total volume, focusing on cereals, rice, oilseeds, and horticultural crops. Cereals consumed approximately 80 million tons of urea. Granules are becoming increasingly popular, especially on the 160 million hectares of Asian rice paddies that depend on split nitrogen doses, where variable-rate spreaders are now common. While agriculture dominates the granular urea market, its growth is tempered at a slightly low CAGR. This is largely due to nutrient strategies in the EU, U.S., and China, which are promoting coated fertilizers. These coated alternatives allow for a reduction in application rates by 10-30%.
Industrial applications, though smaller, expand at a 2.42% CAGR. Adhesives and resins rely on urea as a critical cross-linking agent, and capacity additions in Asia and Eastern Europe underpin volume growth. Chemical intermediates such as melamine further widen industrial off-take.
Geography Analysis
Asia-Pacific commanded 45.22% of global volume in 2025, and leads growth at a 2.19% CAGR. China’s temporary export quotas stabilize domestic supply, while India’s imports rose 13% in 2025 despite subsidy-budget constraints. Australia set an import record at 3.35 million tons in the first eight months of 2024 after local plant closures, illustrating how weather and capacity outages quickly swing regional trade flows.
North America benefits from low-cost shale gas, enabling globally competitive FOB costs that underpin exports to Latin America. CF Industries alone holds roughly 42% of regional granulation capacity and achieved USD 2.28 billion adjusted EBITDA in 2024. The United States also pilots carbon-capture projects attached to existing ammonia-urea lines, positioning the region to sell low-carbon products into premium markets once carbon-footprint labeling standards formalize.
Europe faces twin hurdles of elevated energy prices and tightening environmental caps. High gas costs forced ammonia production curtailments equal to 2.9 million tons of urea in 2024, prompting imports from Algeria, Egypt, and Qatar despite looming CBAM tariffs. Eastern Europe, especially Poland and Romania, retains cost advantages from pipeline gas access, partially offsetting Western shutdowns.
South America, led by Brazil and Argentina, continues rapid farmland conversion as rail and port build-outs compress inland basis values. The region’s urea demand grows 2.6% annually, slightly above the global granular urea market CAGR. Middle East and Africa leverage abundant natural gas, with Saudi Arabia and Qatar exporting nearly one-third of global seaborne urea while Egypt ramps domestic consumption through irrigation megaprojects.

Competitive Landscape
The Granular Urea market is moderately consolidated with the presence of major players, such as SABIC, Yara, CF Industries Holdings, Inc., Nutrien, and QAFCO. The remaining market is divided among various state-owned enterprises in China, India, and the Gulf. CF Industries and Nutrien are leveraging shale-gas economics and making significant investments in blue-ammonia lines. These investments position them to export granular urea that will meet CBAM standards once operational in 2027. Yara’s 500,000-ton Sluiskil green-ammonia stream is already supplying CBAM-compliant granules to Benelux growers, helping them comply with nitrate caps.
SABIC utilize sub-USD 3/MMBtu gas from the Middle East to offer more competitive pricing compared to Europe. At the same time, Dangote’s Nigerian complex benefits from stranded feedstock and proximity to Atlantic markets. Growth opportunities exist in industrial segments where low-biuret granules command a 15-25% premium and are not affected by the subsidy distortions common in farm input channels.
Nano-liquid producers like IFFCO are manufacturing 950,000 bottles daily across five plants in India. Each 500 ml bottle is designed to replace a conventional 50 kg bag of urea. However, with farmer adoption still below 20%, the expected short-term displacement remains limited. In plant operations, AI-driven optimizations have reduced energy use by 8-12% at facilities in North America and Europe. However, exporters in the Middle East continue to rely on their feedstock cost advantages rather than investing in process improvements.
Granular Urea Industry Leaders
Nutrien
CF Industries Holdings, Inc.
Yara
QAFCO
SABIC
- *Disclaimer: Major Players sorted in no particular order

Recent Industry Developments
- February 2026: Fertiglobe, Covestro, and TA’ZIZ signed an MoU covering immediate ammonia supply to Covestro’s U.S. and Chinese sites and longer-range cooperation on low-carbon and green ammonia for European plants, including joint storage and logistics evaluations.
- December 2025: Atlas Agro inked a long-term low-carbon ammonium-nitrate deal with Tereos from its Uberaba Green Fertilizer plant, targeting 500,000 t /y capacity and 99% emission cuts versus conventional routes.


Global Granular Urea Market Report Scope
Granular urea is a high-concentration solid nitrogen fertilizer, containing 46% nitrogen, produced from ammonia and carbon dioxide. It is characterized by larger, harder, and irregularly shaped particles compared to prilled urea, designed for slower nutrient release and better suitability for dry blending with other fertilizers.
The Granular Urea market is segmented by grade, application, and geography. By grade, the market is segmented into agricultural grade and industrial grade. By application, the market is segmented into agriculture and industrial. The agriculture segment is further categorized into cereals and grains, fruits and vegetables, oilseeds and pulses, and other agricultural applications. The industrial segment is further categorized into adhesives and resins, chemicals, and other industrial applications. The report also covers the market size and forecasts for granular ureas in 19 countries across the world. For each segemnt market sizing and forecasts are provided in terms of volume (tons).
| Agricultural Grade |
| Industrial Grade |
| Agriculture | Cereals and Grains |
| Fruits and Vegetables | |
| Oilseeds and Pulses | |
| Other Agricultural Applications | |
| Industrial | Adhesives and Resins |
| Chemicals | |
| Other Industrial Applications |
| Asia-Pacific | China |
| Japan | |
| India | |
| South Korea | |
| ASEAN Countries | |
| Rest of Asia-Pacific | |
| North America | United States |
| Canada | |
| Mexico | |
| Europe | Germany |
| United Kingdom | |
| France | |
| Italy | |
| Spain | |
| Russia | |
| NORDIC Countries | |
| Rest of Europe | |
| South America | Brazil |
| Argentina | |
| Rest of South America | |
| Middle-East and Africa | Saudi Arabia |
| South Africa | |
| Rest of Middle-East and Africa |
| By Grade | Agricultural Grade | |
| Industrial Grade | ||
| By Application | Agriculture | Cereals and Grains |
| Fruits and Vegetables | ||
| Oilseeds and Pulses | ||
| Other Agricultural Applications | ||
| Industrial | Adhesives and Resins | |
| Chemicals | ||
| Other Industrial Applications | ||
| By Geography | Asia-Pacific | China |
| Japan | ||
| India | ||
| South Korea | ||
| ASEAN Countries | ||
| Rest of Asia-Pacific | ||
| North America | United States | |
| Canada | ||
| Mexico | ||
| Europe | Germany | |
| United Kingdom | ||
| France | ||
| Italy | ||
| Spain | ||
| Russia | ||
| NORDIC Countries | ||
| Rest of Europe | ||
| South America | Brazil | |
| Argentina | ||
| Rest of South America | ||
| Middle-East and Africa | Saudi Arabia | |
| South Africa | ||
| Rest of Middle-East and Africa | ||


Key Questions Answered in the Report
How large is the Granular Urea market in 2026?
The Granular Urea market size stands at 168.40 Million tons in 2026 and is on track to reach 185.20 Million tons by 2031.
Which region leads demand growth for granular urea?
Asia-Pacific contributes 45.22% of global volume and registers the fastest regional CAGR at 2.23% through 2031.
Which application area is projected to post the fastest consumption growth for granular urea through 2031?
Industrial uses, especially adhesives, resins, and selective catalytic reduction systems, are forecast to expand at about 2.4% CAGR, outpacing agricultural demand.
Why are fertilizer producers investing in low-carbon ammonia?
Carbon-border tariffs such as the EU CBAM will impose higher costs on high-emission imports, so producers are racing to cut the carbon footprint of nitrogen fertilizers.
Which feedstock variable has the biggest impact on granular urea production economics?
Natural-gas price swings dominate, because ammonia synthesis accounts for 70-80% of urea cash costs; a USD 1 /MMBtu gas move can shift urea cost by roughly USD 20-25 /ton.
Page last updated on:


