
Industrial Grade Urea Market Size and Share
Market Overview
| Study Period | 2020 - 2031 |
|---|---|
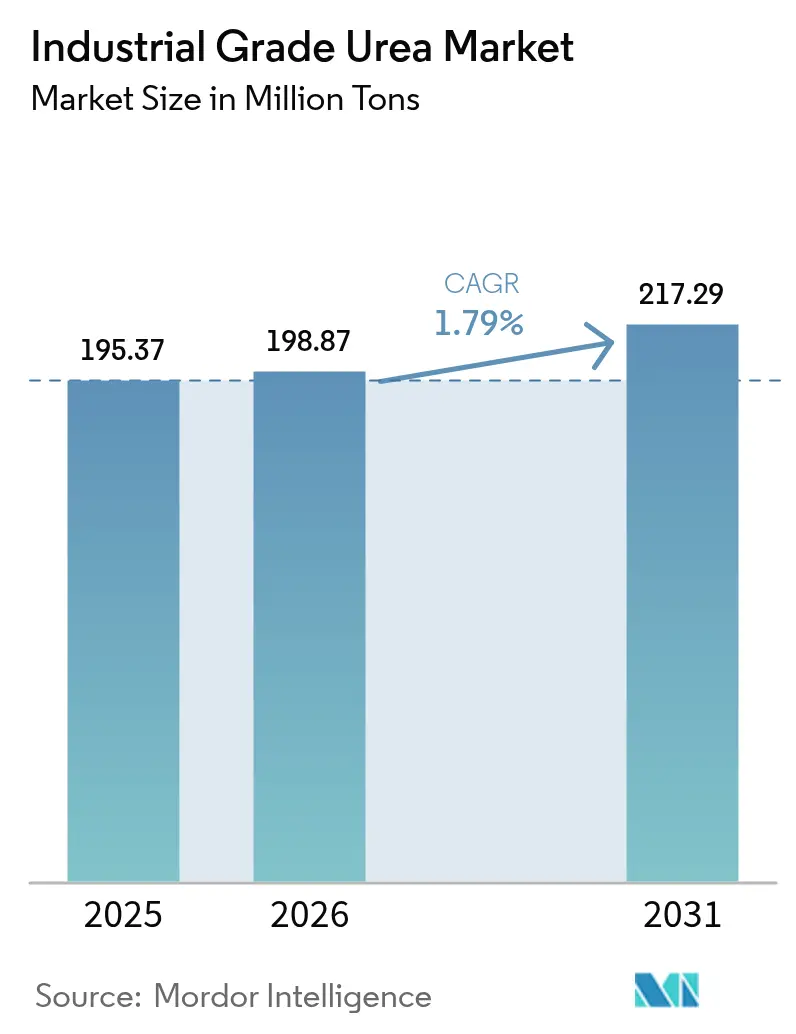
| Market Volume (2026) | 198.87 Million tons |
| Market Volume (2031) | 217.29 Million tons |
| Growth Rate (2026 - 2031) | 1.79 % |
| Fastest Growing Market | Middle East and Africa |
| Largest Market | Asia-Pacific |
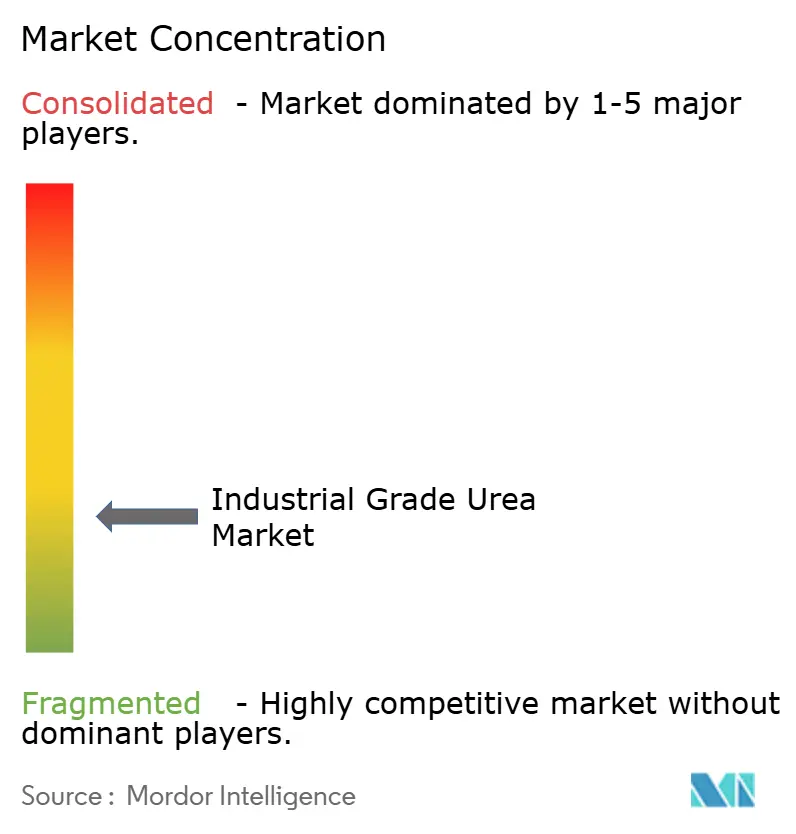
| Market Concentration | Low |
Major Players *Disclaimer: Major Players sorted in no particular order Image © Mordor Intelligence. Reuse requires attribution under CC BY 4.0. | |
Industrial Grade Urea Market Analysis by Mordor Intelligence
The Industrial Grade Urea Market size was valued at 195.37 Million tons in 2025 and estimated to grow from 198.87 Million tons in 2026 to reach 217.29 Million tons by 2031, at a CAGR of 1.79% during the forecast period (2026-2031). The market’s modest trajectory reflects a mature landscape balancing cost-driven production economics with rising sustainability expectations. Demand growth flows mainly from agriculture, yet a new pull from diesel exhaust fluid (DEF) and engineered-wood resins diversifies the revenue base. Energy-price volatility, consolidation among large producers, and stricter emissions targets dominate strategic conversations, while process innovations aimed at green ammonia integration promise longer-term competitiveness.
Key Report Takeaways
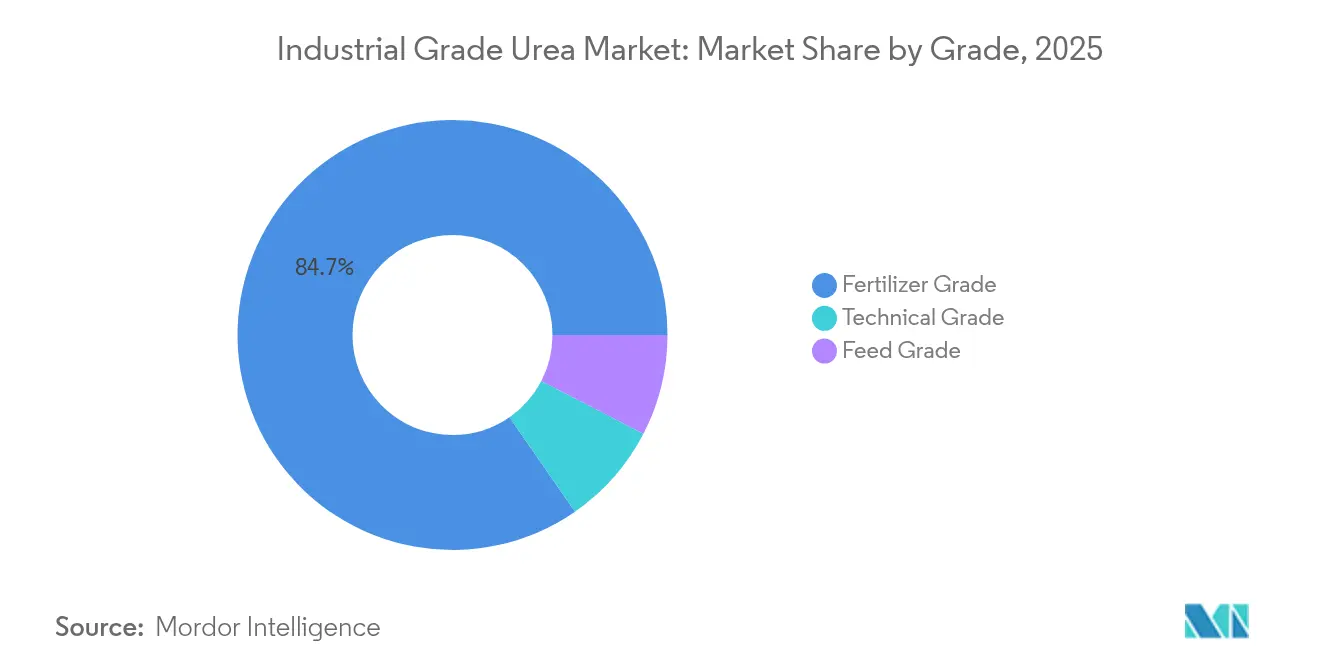
- By grade, fertilizer grade retained 84.65% revenue share in 2025 and is projected to advance at a 1.83% CAGR through 2031.
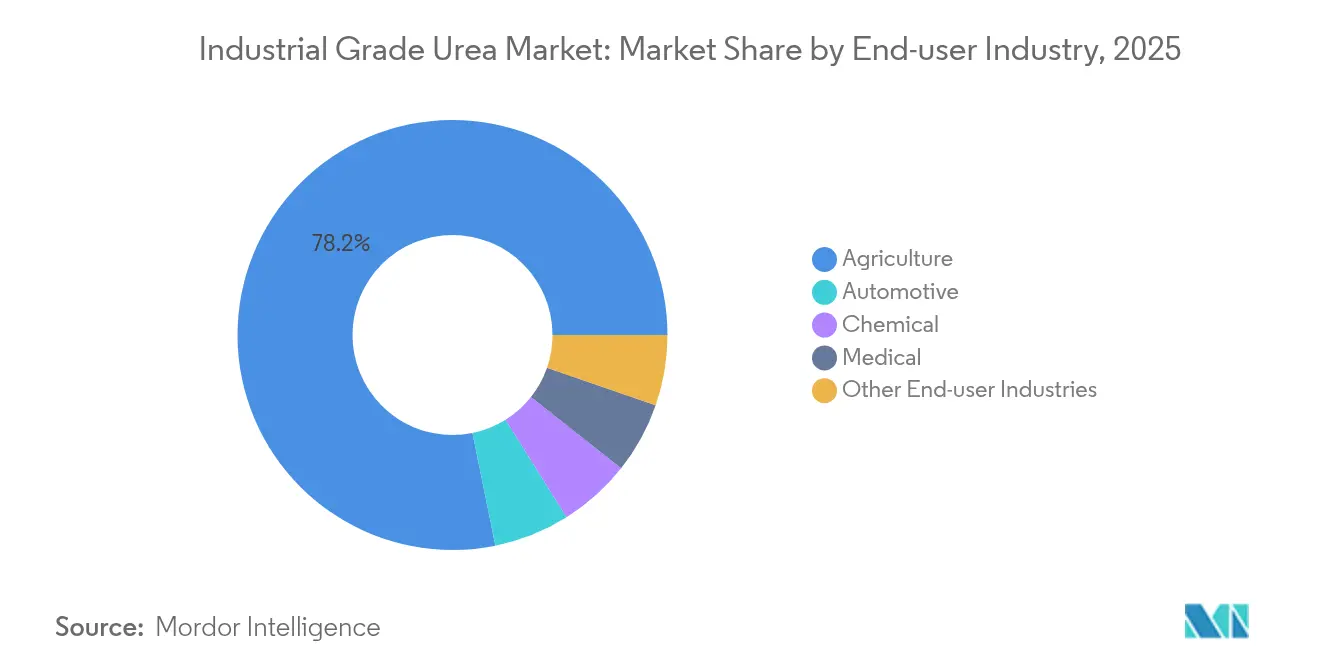
- By end-user industry, agriculture held 78.20% of the industrial grade urea market share in 2025 and also records the highest 1.85% CAGR to 2031.
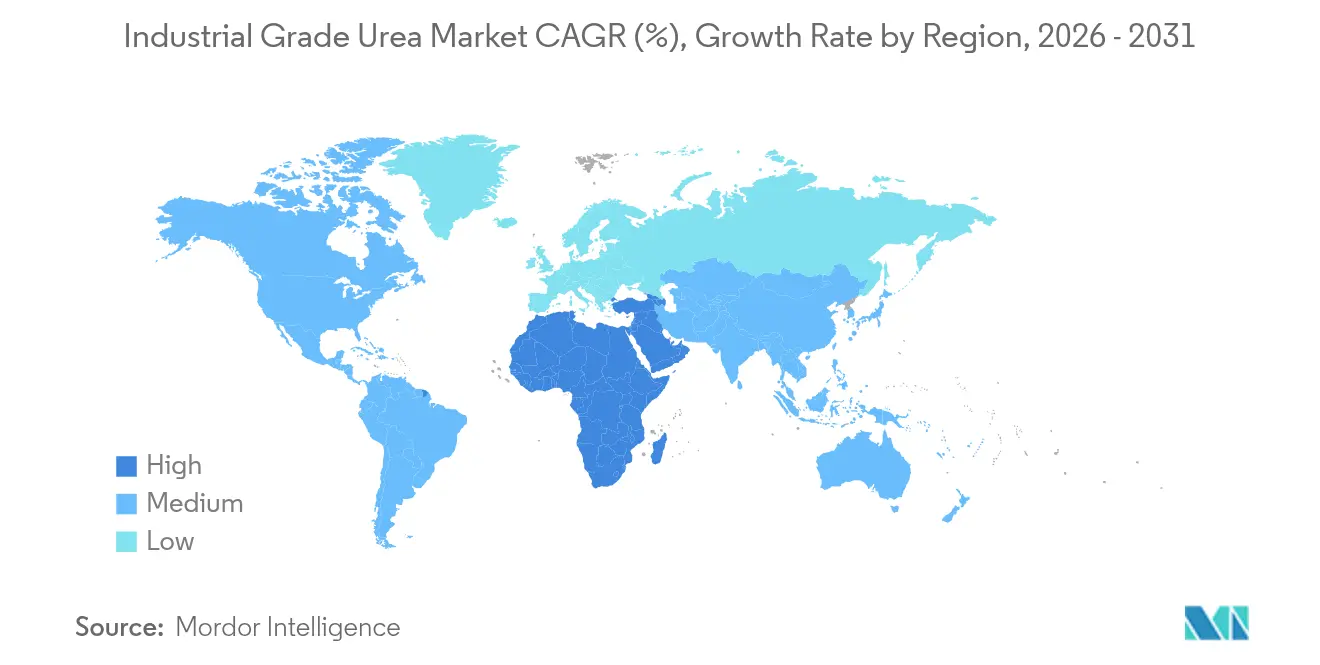
- By geography, Asia-Pacific commanded 66.10% of the industrial-grade urea market size in 2025, while the Middle East and Africa region is set to grow at a 2.33% CAGR through 2031.
Note: Market size and forecast figures in this report are generated using Mordor Intelligence’s proprietary estimation framework, updated with the latest available data and insights as of 2026.
Market Trends and Insights
Drivers Impact Analysis of Industrial Grade Urea Market*
| Drivers | (~) % Impact on CAGR Forecast | Geographic Relevance | Impact Timeline |
|---|---|---|---|
| Rising DEF adoption in on-road and off-road vehicles | +0.3% | Global (early gains in China, Europe, North America) | Medium term (2-4 years) |
| High applicability of technical-grade urea | +0.2% | Asia-Pacific core, spill-over to MEA | Short term (≤ 2 years) |
| Expanding fertilizer consumption in emerging Asia | +0.4% | Asia-Pacific, notably India and Southeast Asia | Long term (≥ 4 years) |
| Increased melamine and resin output for engineered wood | +0.1% | Global | Medium term (2-4 years) |
| Shift toward green-ammonia-based urea | +0.2% | Europe, North America, Middle East | Long term (≥ 4 years) |
| Source: Mordor Intelligence | |||
Rising Diesel Exhaust Fluid Adoption Transforms Technical Grade Demand
Commercial vehicle emission standards underpin a robust uptake of DEF, with China’s National VI regulations alone expected to lift DEF consumption to 25 million tons in 2025[1]Siavash Khadem Masjedi et al., “DEF Growth and Emissions Standards,” pubmed.ncbi.nlm.nih.gov. European players are integrating DEF lines into existing ammonia-urea complexes, illustrated by CF Industries’ Blue Point project that will add 1.4 million tpy low-carbon ammonia from 2029. This defensively hedges against seasonal fertilizer swings and supports premium pricing. North American fleets following EPA 2027 rules further reinforce a medium-term demand floor, while off-road machinery in construction and mining extends the addressable market. Overall, DEF’s rise shifts a portion of the industrial-grade urea market toward higher-purity products, indirectly raising margins and encouraging investments in purification infrastructure.
Green Ammonia Integration Reshapes Production Economics
The European Union’s RED III requirement for 42% renewable hydrogen by 2030 accelerates low-carbon ammonia adoption, turning electrolyzer costs and renewable power availability into new profit levers. Stamicarbon’s NX Stami Green Ammonia modules slash CAPEX 25-30% at 50-500 t per day scale, enabling regional supply hubs that shorten freight routes and curb scope 3 emissions. Pilot projects in the Middle East aim to couple solar-powered electrolysis with urea synthesis, signaling a shift away from single-site mega-plants. Early adopters gain compliance advantages in carbon-regulated export markets and secure offtake agreements from food and beverage firms seeking lower-footprint supply chains. Over the long term, these developments could moderate the industrial-grade urea market’s exposure to natural-gas price spikes and carbon costs.
Technical Grade Applications Drive Premium Segment Growth
Technical-grade urea serves melamine, formaldehyde resins, pharmaceutical intermediates, and de-icing agents, generally selling at a 15-25% price premium over fertilizer material[2]thyssenkrupp Uhde, “Urea 2000plus Technical Brochure,” thyssenkrupp-uhde.com. Construction-led demand for engineered wood boosts melamine consumption, while emerging pyrolysis routes unlock co-production of ammonia and cyanuric acid for advanced polymers. Producers leveraging thyssenkrupp Uhde’s Urea 2000plus pool-condenser design can seamlessly switch between fertilizer and technical grades, smoothing plant utilization. Such flexibility attracts investment as long-cycle fertilizer markets plateau, allowing operators to chase margin-accretive industrial niches.
Emerging Asia Fertilizer Demand Sustains Long-term Growth
India’s fertilizer usage climbed despite subsidy rationalization, with population growth and protein-rich diet shifts setting a durable consumption baseline. Southeast Asia shows parallel momentum. Precision-agriculture tools gradually lift nutrient-use efficiency, yet rising harvested-area intensity offsets per-hectare rate moderation. Long-term government support for food security secures a steady offtake channel, anchoring a majority share of the industrial-grade urea market through 2030.
Restraints Impact Analysis of Industrial Grade Urea Market*
| Restraints | (~) % Impact on CAGR Forecast | Geographic Relevance | Impact Timeline |
|---|---|---|---|
| Volatile natural-gas pricing | -0.4% | Global, acute in Europe and net-gas-importing regions | Short term (≤ 2 years) |
| Indiscriminate over-application in groundwater-stressed regions | -0.2% | Asia-Pacific, notably China and India | Medium term (2-4 years) |
| Stricter fertilizer subsidy reforms | -0.3% | India, China, Brazil, Indonesia | Medium term (2-4 years) |
| Source: Mordor Intelligence | |||
Natural Gas Price Volatility Threatens Production Viability
Spot gas swung from USD 6.54/MMBtu in 2022 to USD 2.66/MMBtu in 2023, exposing producers whose feedstock can constitute 70-90% of cash costs. European plants curtailed utilization to 75% amid the 2022 energy crisis, redirecting trade flows toward Middle Eastern suppliers. U.S. operators with shale-based gas benefit from structural cost advantages, whereas net-importing areas confront negative margins during price spikes. Hedging strategies, dual-fuel capabilities, and green ammonia investments are emerging defenses but require substantial capital and policy support.
Environmental Regulations Constrain Application Growth
The EU Fertilising Products Regulation (EU 2019/1009) enforces tighter contaminant thresholds, raising compliance costs and incentivizing controlled-release formulations. Canada attributes 72% of national N₂O emissions to agriculture, prompting incentives for urease-inhibitor adoption. Studies show up to 50% of surface-applied urea volatilizes under unfavorable conditions, leading policymakers to cap per-hectare application or mandate stabilizers. Although these measures elevate product innovation, they may temper bulk-volume growth in the industrial grade urea market over the medium term.
*Our forecasts treat driver/restraint impacts as directional, not additive. The impact forecasts reflect baseline growth, mix effects, and variable interactions.
Industrial Grade Urea Market Segment Analysis
By Grade:
Fertilizer Dominance Faces Technical Grade DisruptionFertilizer grade accounted for 84.65% of the industrial grade urea market in 2025 and is forecast to expand at a 1.83% CAGR to 2031. The technical grade slice, while smaller, accelerates on DEF demand, potentially lifting its share by 130 basis points within the outlook period. Feed grade addresses ruminant nutrition niches with stringent purity needs. Process innovations such as pool-condenser reactors lower CAPEX by up to 30%, enabling multiproduct configurations that respond swiftly to shifting margins.
Flexibility matters because DEF and melamine demand decouple from crop cycles, smoothing revenue seasonality. Producers certified for automotive-grade urea meet ISO 22241 quality thresholds, commanding sustained premiums. In contrast, fertilizer producers remain exposed to subsidy regimes and environmentally driven application caps. This divergence underlines why technical grade is the fastest growing component of the industrial grade urea market size across the forecast.



By End-user Industry:
Agriculture Maintains Dominance Despite DiversificationAgriculture absorbed 78.20% of global volume in 2025, yet its CAGR to 2031 stalls at 1.85% as precision application curbs per-acre rates. Automotive DEF, though under 8% by volume, represents a resilient outlet driven by emission mandates in trucking, mining, and marine sectors. Chemical manufacturing—including melamine, resins, and pharmaceuticals—benefits from construction booms and specialty chemical expansion. Small, high-value medical uses for diagnostic reagents also grow, albeit from a low base.
Biotechnology alternatives pose discrete threats: enzyme blends in ethanol fermentation can displace up to 90% of urea previously added as a nitrogen source. Successful scale-up could erode certain industrial volumes, demanding proactive diversification among suppliers. Overall, the industrial-grade urea industry remains anchored in farming, but growth momentum gravitates toward regulatory-backed technical applications.
Geography Analysis
APAC Industrial Grade Urea Market
Asia-Pacific dominated the industrial-grade urea market size with a 66.10% share in 2025, driven by India’s and China’s crop inputs and rising DEF uptake. Local production expansion in India aims for self-sufficiency by 2025, potentially trimming import reliance.
EMEA and North America Industrial Grade Urea Market
The Middle East and Africa region posts the fastest 2.33% CAGR through 2031, fueled by low-cost gas feedstock and export-oriented capacity additions in Saudi Arabia, Egypt, and Algeria. New complexes integrate green-hydrogen pilot lines to future-proof carbon competitiveness. Europe’s share contracts amid high gas costs and decarbonization policies; several plants operate seasonally or under curtailment, increasing import reliance on North Africa and the United States.
APAC, LATAM, North America and Middle East Industrial Grade Urea Market
North America maintains steady demand, benefiting from abundant shale gas and ongoing DEF adoption in heavy-duty fleets. Trade patterns continue shifting: China’s H1 2024 export volumes fell 90% following policy restrictions, creating spot shortages in Southeast Asia and Latin America. Middle Eastern producers quickly captured these gaps, affirming their swing-supplier status. Over the long term, Asia-Pacific retains leadership, yet its growth moderates as sustainability policies and domestic supply priorities reshape external trade.

Regulatory Landscape
Policy and trade actions are increasingly shaping industrial grade urea flows and investment decisions, particularly across major consuming regions. In July 2026, India approved the National Investment Policy for Urea 2026 (NIPU-2026), which is designed to incentivize new gas-based urea plants and support domestic self-sufficiency. That framework reinforces how administered policies influence capacity additions and import dependence.
In Europe, regulators are using protective and supply-security tools that affect sourcing and pricing. In January 2026, the EU imposed definitive anti-dumping duties on mixtures of urea and ammonium nitrate from Russia, Trinidad and Tobago, and the United States, following import registration requirements introduced in December 2025 for urea originating in Russia that allow retroactive duty application. Separately, the EU adopted Council Regulation (EU) 2026/1181 in May 2026 to temporarily suspend Common Customs Tariff duties for specified nitrogen-based fertilisers, including urea, through 31 May 2027. This is part of a parallel effort to diversify supply and manage agricultural input costs alongside trade remedies.
Value Chain Analysis
Industrial grade urea production starts with ammonia feedstock and carbon dioxide supply (often handled inside ammonia-urea complexes), then moves through high-pressure synthesis and stripping in licensed process configurations, including Snamprogetti, Stamicarbon, and Saipem stripping technologies. Downstream steps include purification and recovery, evaporation and concentration, solids formation via prilling or granulation, followed by cooling, screening, and storage. Utilities such as steam, cooling water, and power, plus emissions-control equipment, are tied closely to operating costs and compliance. As a result, energy efficiency and reliability remain key levers for producers and technology licensors.
The value chain then extends through bulk logistics and distribution into agricultural, chemical, and automotive DEF channels. Ammonia can move by pipeline within integrated sites, while finished urea is transported by railcars, trucks, and ocean-going vessels. That linkage connects export-oriented hubs in the Middle East, Russia, and the United States to import-dependent markets. Technology licensors, including Stamicarbon, Saipem, Casale, TEC, and NIIK, can influence project economics and product flexibility. Large producers and distributors manage seasonal demand swings by balancing fertilizer volumes with higher-purity technical outlets such as automotive-grade urea for DEF, which requires tighter quality control and dedicated handling.
Competitive Landscape
Global supply exhibits oligopolistic traits. Technology licensing stands out as a differentiation lever. Stamicarbon and thyssenkrupp Uhde market new synthesis loops that cut energy use by 5-7% and enable wider feedstock flexibility. Potential disruption looms from biotech solutions that slash urea usage in industrial fermentation. Novozymes reports enzyme packages displacing bulk urea at multiple ethanol plants, hinting at demand erosion in specific end-markets. Incumbents respond by investing in enhanced-efficiency fertilizers and DEF production, betting on regulatory-anchored outlets. Smaller regional firms survive by serving localized markets with lean logistics and flexible grade switching, yet remain vulnerable to feedstock price shocks.
Industrial Grade Urea Industry Leaders
SABIC
Yara
CF Industries Holdings Inc.
Nutrien Ltd
OCI
- *Disclaimer: Major Players sorted in no particular order
Industrial Grade Urea Market Companies Covered in this Report
- Acron
- BASF
- CF Industries Holdings Inc.
- Chambal Fertilisers & Chemicals Ltd
- China National Petroleum Corporation (CNPC)
- EuroChem Group
- Genesis Fertilizers
- IFFCO
- Industries Qatar
- Koch Fertilizer LLC
- National Fertilizers Limited
- Notore Chemical Industries PLC
- Nutrien Ltd
- OCI
- Paradeep Phosphates Ltd
- Petrobras
- PT Pupuk Kalimantan Timur (PKT)
- SABIC
- The Chemical Company (TCC)
- Uralchem JSC
- Yara

Market Opportunities and Future Outlook
Near-term whitespace is concentrated in two areas: (1) new capacity and debottlenecking in feedstock-advantaged export hubs and (2) higher-purity, specification-driven technical grades tied to emission-control supply chains. A capacity-led example is SABIC Agri-Nutrients receiving Saudi Ministry of Energy feedstock allocation, announced in March 2026, for a new production complex in Jubail Industrial City. The project is designed to produce 2.6 MMTA of urea, illustrating how producers with secure gas allocation and established logistics can expand exportable supply.
Policy-backed domestic buildouts also create openings for EPC, licensors, and specialty-grade suppliers as countries pursue supply security and compliance. India’s NIPU-2026, approved in July 2026, is framed around facilitating 8 to 9 new gas-based urea plants and related capacity additions. That approach increases demand for modern process packages, emissions-control systems, and operational expertise that support both fertilizer and technical-grade switching. In parallel, tightening environmental and trade measures in Europe, including anti-dumping actions and tariff adjustments, is pushing procurement toward more diversified origins and traceable, compliant product. This supports differentiation for suppliers that can document quality and, where relevant, lower-carbon inputs aligned with green-ammonia integration initiatives referenced across major producing regions.
Recent Industry Developments in Industrial Grade Urea Market
- July 2026: Yara International ASA announced an agreement to acquire the Gulf Coast Ammonia production facility in Texas City, Texas for USD 1.3 billion. The deal strengthens Yara’s North American ammonia position and supports downstream nitrogen products that depend on reliable ammonia feedstock, including industrial-grade urea and technical-grade applications.
- November 2025: OCI Global announced an agreement to sell 100% of OCI Ammonia Holding B.V., including OCI Terminal Europoort B.V. and OCI Ammonia Distribution B.V., to AGROFERT for EUR 290 million. The transaction reshapes ownership of ammonia logistics and distribution infrastructure in Europe, influencing how nitrogen feedstocks and derivatives, including urea-linked supply chains, are marketed and routed.
- November 2024: Yara International ASA signed agreements with Petrobras covering technical cooperation and commercialization of Arla 32 (automotive liquid reducing agent) based on ANSA-produced urea. The agreements deepen DEF-related demand channels for high-purity urea and link fertilizer producers more directly to on-road emissions-compliance markets.


Industrial Grade Urea Market Report Scope and Research Methodology
Market Definition and Coverage
For this methodology, the industrial grade urea market is defined as the demand and supply of urea used as an industrial input across major end uses, measured as the physical volume of product sold and consumed over the study period.
Scope exclusions: The sizing excludes downstream finished goods value (for example, resin products or diesel exhaust fluid retail value) and counts only urea volumes at the industrial-urea product level.
Segments Covered in This Report
- By Grade
- Fertilizer Grade
- Technical Grade
- Feed Grade
- By End-user Industry
- Agriculture
- Chemical
- Automotive
- Medical
- Other End-user Industries
- By Geography
- Asia-Pacific
- China
- India
- Japan
- South Korea
- ASEAN
- Rest of Asia-Pacific
- North America
- United States
- Canada
- Mexico
- Europe
- Germany
- France
- United Kingdom
- Italy
- Russia
- Rest of Europe
- South America
- Brazil
- Argentina
- Rest of South America
- Middle-East and Africa
- Saudi Arabia
- South Africa
- Rest of Middle-East and Africa
- Asia-Pacific
Data Sources, Market Sizing, and Validation
Desk Research
Desk research is used to set a fact base from production, trade, and end use signals, so the model starts with real physical constraints. We referenced public and official sources such as national statistical offices, UN Comtrade for customs flows, USGS for minerals and industrial chemicals context, World Bank macro indicators, and peer reviewed chemical engineering journals that discuss urea consumption and process routes.
We also reviewed company annual reports, investor presentations, and sustainability disclosures to understand capacity additions, plant operating rates, and typical end market exposure by region. Where needed, we used paid subscriptions for company financials and intelligence, patent databases, and shipment level import export data to cross check timelines and validate directional trends. These desk research inputs are not exhaustive, and other public sources were also used across data collection, validation, and clarification.
Primary Interviews and Surveys
Primary interviews were used to pressure test how industrial grade urea volumes split across key end uses, and to confirm how quickly demand is changing with policy and industrial activity. We spoke with a mix of producers, distributors, and large consuming industries, with responses balanced across APAC, EMEA, and the Americas to avoid region bias when converting indicators into volume assumptions.
Distribution of primary research fieldwork respondents
| Company type | Respondent position | Region |
|---|---|---|
| Top tier: 30% | CXOs: 14% | APAC: 46% |
| Mid tier: 56% | Functional/Unit leaders: 30% | EMEA: 36% |
| Smaller Players: 14% | Managers: 56% | Americas: 18% |
Market-Sizing & Forecasting
Sizing is built using a top-down approach where production, capacity changes, and trade balances are reconstructed by region, then filtered through the likely industrial use share to arrive at industrial grade urea volumes. The totals are checked using selective bottom-up approximations, such as sampled plant level nameplate capacity times utilization, channel feedback on bulk movement, and indicative volume runs from large end use applications, which helps adjust for data gaps.
Key inputs that shape the model include announced urea capacity additions and shutdowns, operating rates at major plants, import export movement patterns, industrial output and construction activity indicators, and emission policy signals that influence automotive and after-treatment related demand. Forecasting relies on scenario analysis supported by expert views on utilization and trade flows, then uses an exponential smoothing step to reduce overreaction to one-time disruptions. Where bottom-up checks are incomplete for smaller consuming clusters, the gap is handled by applying region specific industrial share ranges, which were validated through interviews and updated against trade and capacity signals.
Data Validation & Update Cycle
Outputs are validated through triangulation across independent signals, including capacity and utilization reality checks, trade flow consistency tests, and demand sanity checks against industrial production trends. If a variance appears too large for a region, we revisit assumptions, then run a second pass review by another analyst before final sign-off.
The report is refreshed annually, and interim updates are completed when material events occur, such as major plant outages, commissioning delays, or sudden trade restrictions. Before delivery, a fresh review is completed so clients receive the latest updated view available at that time.
Mordor Intelligence's Industrial Grade Urea Market Estimate Compared With Other Published Estimates
Published market estimates for industrial grade urea can differ widely because some publishers size the market in revenue terms, while others size it in physical tons. These two views move differently when prices swing, and scope also varies across publications. Differences can also occur when adjacent categories are mixed into the same label, such as counting fertilizer grade volumes inside an industrial label, or treating diesel exhaust fluid value as if it were urea volume.
By tracking capacity additions, trade balances, and end use share splits, Mordor Intelligence keeps the estimate tied to industrial grade urea volumes in million tons, which reduces noise from short term price spikes or downstream value add counting.
Benchmark comparison
| Source | Market Size | Gaps in Research Methodology |
|---|---|---|
| Mordor Intelligence | USD 198.87 M (2026) | |
| Global Consultancy A | USD 30.00 B (2024) | This estimate is value based in USD and appears to mix multiple product forms and applications without clarifying the volume boundary, so price and scope effects can inflate the number versus a tonnage based view. |
| Industry Publisher B | USD 29.86 B (2024) | The scope includes broader application buckets and multiple grades, and it is reported in revenue terms over a long horizon, which can embed aggressive price and demand assumptions that are not directly comparable to volume sizing. |
The table shows that the biggest spread comes from mixing value based sizing with volume based sizing, and from how closely the industrial grade boundary is defined. When the model is anchored on physical supply and trade constraints and then cross checked with end use share validation, the resulting market total is easier to reproduce and explain in simple steps.


Key Questions Answered in the Report
How large is the industrial grade urea market in 2026?
The industrial grade urea market size is 198.87 million tons in 2026.
What is the expected growth rate for industrial grade urea to 2031?
Volume is projected to rise at a 1.79% CAGR, reaching 217.29 million tons by 2031.
Which region leads demand for industrial grade urea?
Asia-Pacific accounts for 66.10% of 2025 global consumption, anchored by China and India.
Why is DEF important to industrial grade urea suppliers?
Diesel exhaust fluid requires high-purity urea and is mandated by emission standards, creating a fast-growing premium segment.
How are producers addressing carbon pressure?
Companies invest in green-ammonia projects and energy-efficient process designs to cut emissions and qualify for low-carbon certifications.
Page last updated on:




