Gout Therapeutics Market Size and Share
Market Overview
| Study Period | 2020 - 2031 |
|---|---|
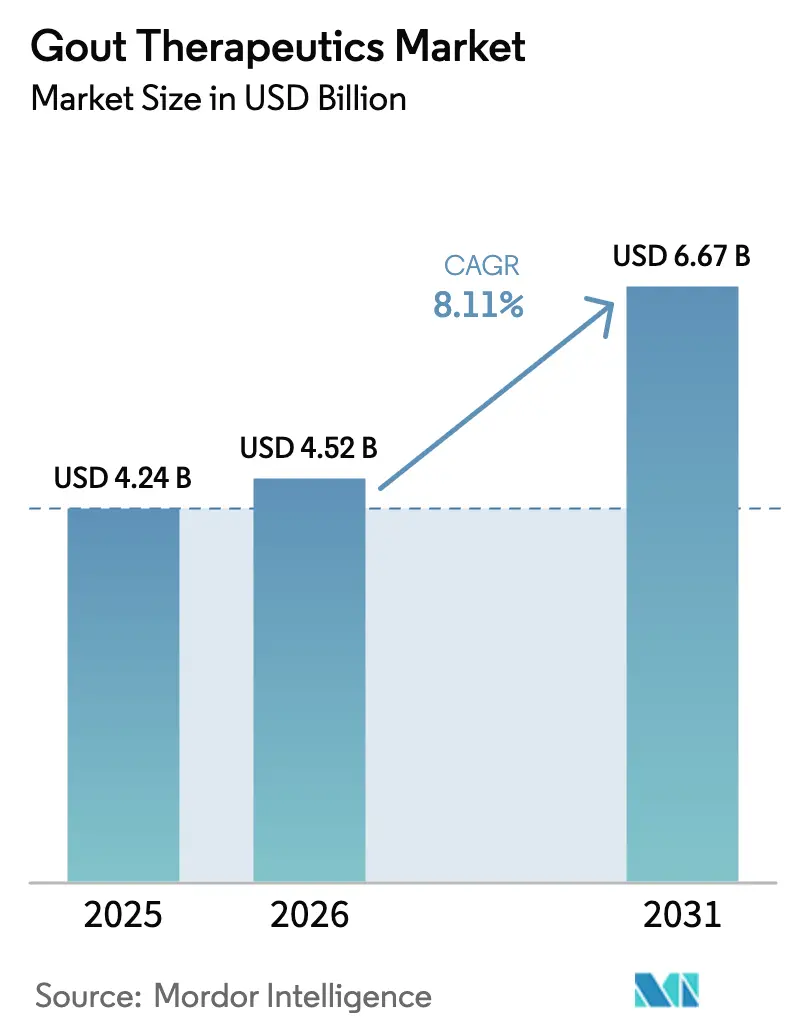
| Market Size (2026) | USD 4.52 Billion |
| Market Size (2031) | USD 6.67 Billion |
| Growth Rate (2026 - 2031) | 8.11% CAGR |
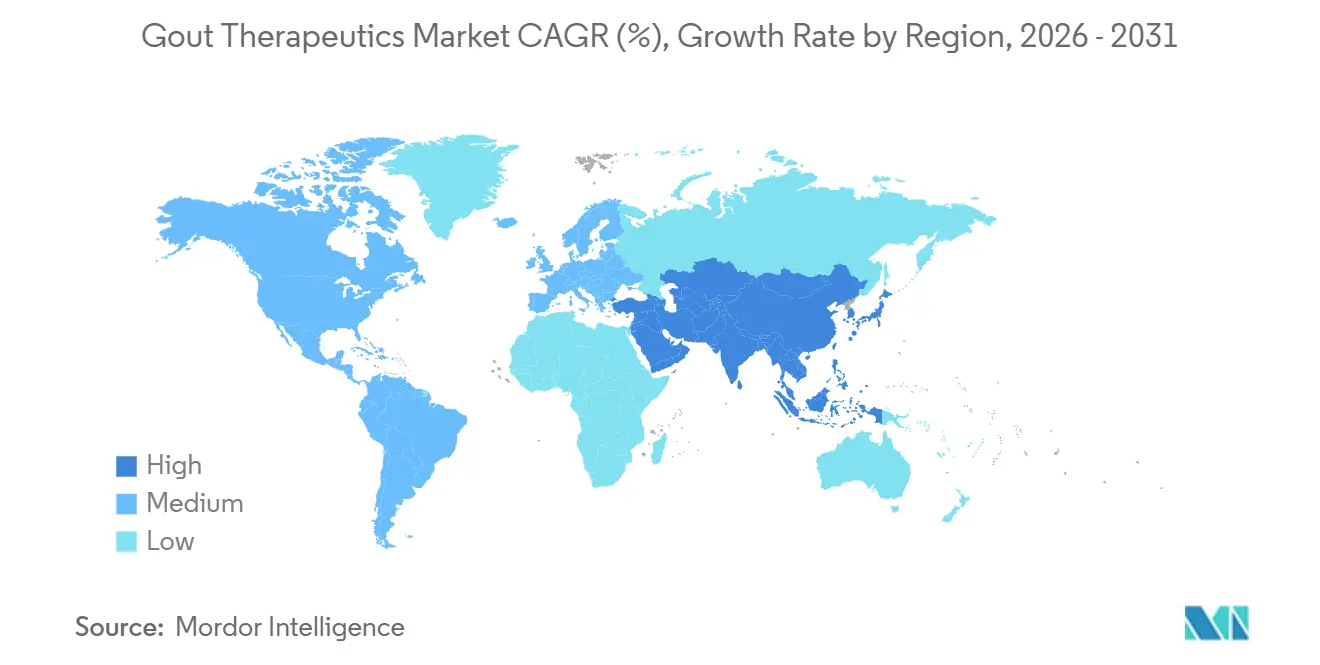
| Fastest Growing Market | Asia Pacific |
| Largest Market | North America |
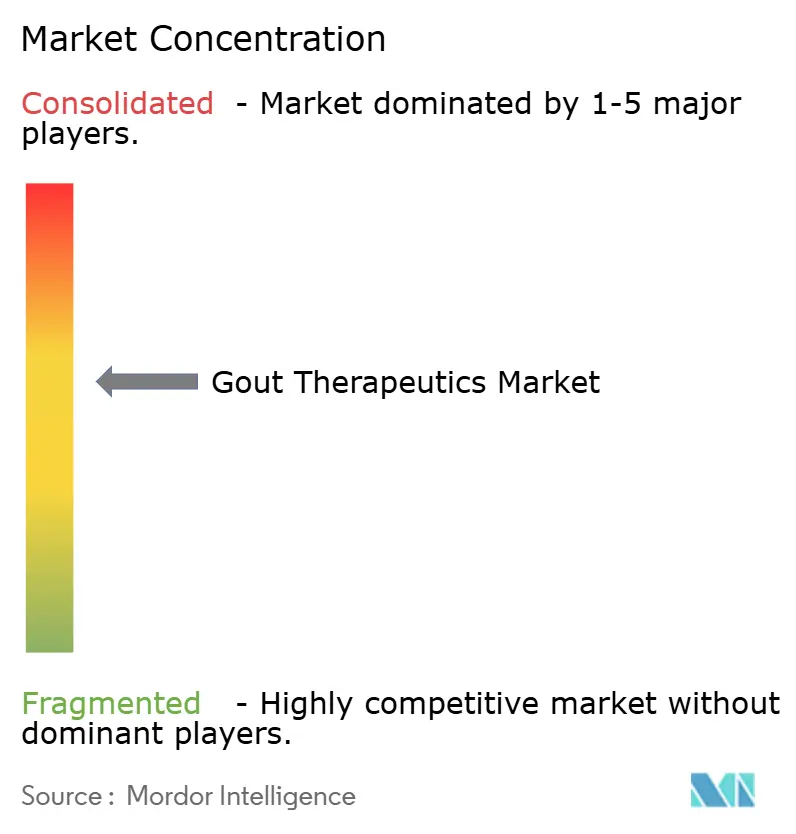
| Market Concentration | Medium |
Major Players *Disclaimer: Major Players sorted in no particular order Image © Mordor Intelligence. Reuse requires attribution under CC BY 4.0. | |
Gout Therapeutics Market Analysis by Mordor Intelligence
The Gout Therapeutics Market size is projected to be USD 4.24 billion in 2025, USD 4.52 billion in 2026, and reach USD 6.67 billion by 2031, growing at a CAGR of 8.11% from 2026 to 2031.
Demand is being driven by an aging population, increasing cases of obesity-related hyperuricemia, and updated clinical guidelines that emphasize treat-to-target serum urate thresholds. The introduction of biologics for treatment-refractory conditions is expanding therapeutic options for physicians while enabling premium pricing opportunities. At the same time, fixed-dose oral combinations are positioned to protect market share as generic price erosion pressures margins. Digital monitoring tools, integrating smartphone urate meters with algorithm-based flare prediction, are accelerating diagnostics and aligning with payer strategies to reduce costly emergency department visits. However, growth prospects are tempered by cardiovascular safety warnings linked to febuxostat, payer-imposed prior-authorization requirements for pegloticase, and increasing generic competition within the xanthine oxidase inhibitor class.
Key Report Takeaways
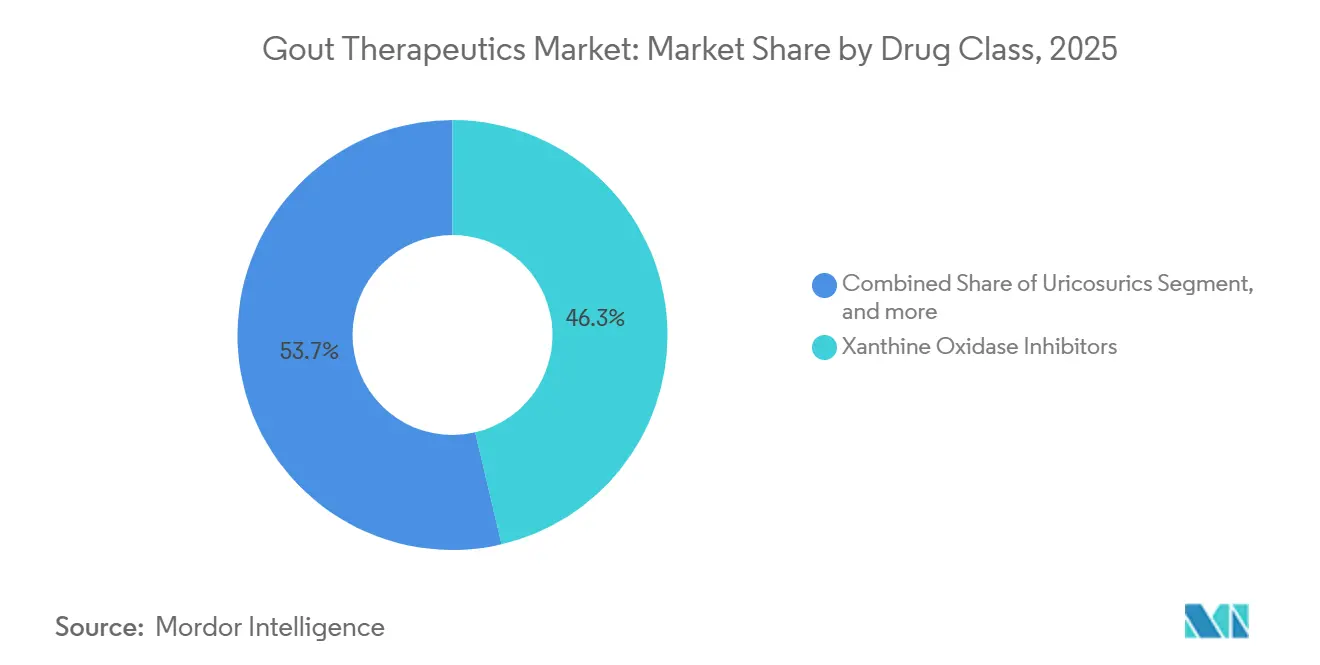
- By drug class, xanthine oxidase inhibitors captured 46.34% of the 2025 gout therapeutics market share, while uricosurics are projected to deliver the fastest 9.54% CAGR through 2031.
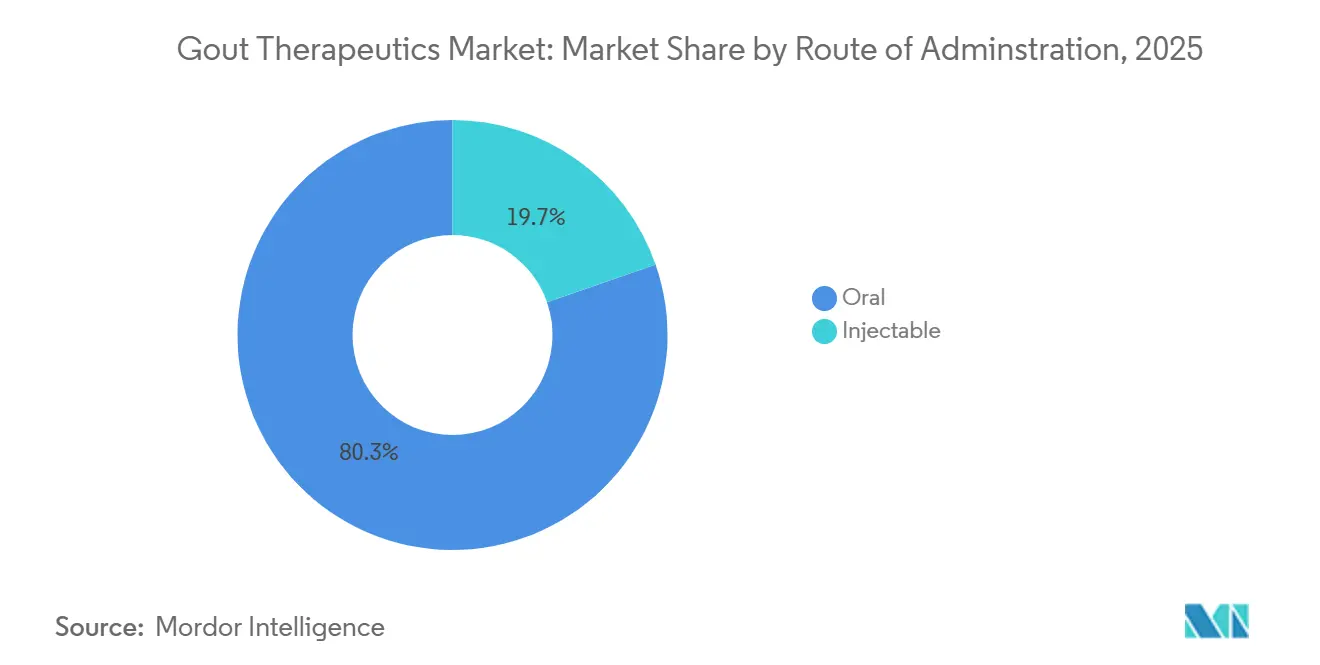
- By route of administration, oral formulations constituted 80.32% of 2025 revenue, yet injectable biologics are forecast to grow at a 9.67% CAGR as recombinant uricase platforms mature.
- By disease type, chronic refractory gout accounted for 52.43% of the 2025 value, whereas tophaceous gout is set to expand at a 10.21% CAGR due to earlier subclinical detection.
- By geography, North America led with a 42.43% share in 2025; Asia-Pacific is the fastest-growing region, with an 8.43% CAGR in metabolic-syndrome prevalence and expanding rheumatology access.
Note: Market size and forecast figures in this report are generated using Mordor Intelligence’s proprietary estimation framework, updated with the latest available data and insights as of January 2026.
Global Gout Therapeutics Market Trends and Insights
Driver Impact Analysis*
| Driver | (~) % Impact on CAGR Forecast | Geographic Relevance | Impact Timeline |
|---|---|---|---|
| Rising Disease Prevalence Due To Aging And Obesity | +1.8% | Global, highest in North America, Europe, urban Asia-Pacific | Long term (≥ 4 years) |
| Adoption Of Evidence-Based Urate-Lowering Treatment Guidelines | +1.5% | North America, Europe, Australia, Japan, South Korea | Medium term (2-4 years) |
| Introduction Of Novel Mechanisms Of Action | +2.1% | North America and Europe lead; Asia-Pacific follows approvals | Medium term (2-4 years) |
| Expansion Of Digital Health And Tele-Rheumatology Channels | +0.9% | North America, Western Europe; pilot programs in urban China and India | Short term (≤ 2 years) |
| Advances In Personalized Medicine And Biomarker Monitoring | +0.7% | North America and Europe, early adoption in Japan | Medium term (2-4 years) |
| Emergence Of Microbiome-Based Therapeutics And Enzyme Therapies | +0.6% | Global research hubs, with clinical trials centered in the United States and China | Long term (≥ 4 years) |
| Source: Mordor Intelligence | |||
Rising Disease Prevalence Due to Aging and Obesity
By 2025, the global prevalence of gout reached 41 million cases, with high-income economies experiencing the fastest growth due to obesity rates exceeding 30%. Hyperinsulinemia reduces renal urate clearance, while fructose metabolism accelerates purine catabolism, collectively driving higher serum urate levels. In China, shifting urban dietary preferences toward red meat and sugary beverages led to a twofold increase in gout diagnoses between 2015 and 2024[1]National Health Commission of China, “Chronic Disease Report 2025,” nhc.gov.cn. The demographic profile of gout patients has also evolved, with cases now commonly emerging in individuals in their thirties and forties, rather than in men in their sixties as in historical trends. This demographic shift is expanding the treated population annually and extending the duration of therapeutic interventions. In Japan, 2025 health statistics rank gout among the top ten chronic outpatient conditions for men over 50, equating its prevalence with that of hypertension and diabetes.
Adoption of Evidence-Based Urate-Lowering Treatment Guidelines
The American College of Rheumatology’s 2024 update establishes serum urate targets of <6 mg/dL for all gout patients and <5 mg/dL for those with tophi[2]American College of Rheumatology, “2024 Guideline Update,” rheumatology.org. Similarly, European guidelines emphasize the early initiation of xanthine oxidase inhibitors within weeks of diagnosis, replacing prior wait-and-see approaches. A 2025 Medicare claims analysis highlights a significant improvement: 68% of newly diagnosed U.S. patients initiated urate-lowering therapy within 90 days, compared to 42% in 2019. Fixed-dose oral combinations, designed to align with guideline-recommended dual therapy, are progressing through late-stage pipelines, although regulatory bodies require evidence of superiority over titrated monotherapy. In Germany and the United Kingdom, reimbursement frameworks now link rheumatologist incentives to the electronic documentation of serum-urate targets, driving the adoption of point-of-care testing devices.
Introduction of Novel Mechanisms of Action
Since its introduction in 1966, allopurinol has faced competition from advancements such as recombinant uricase enzymes, IL-1β inhibitors, and selective URAT1 antagonists. Pegloticase can reduce serum urate levels by 90% within hours; however, its adoption is constrained by infusion reactions in approximately 40% of patients by the sixth dose. Selecta Biosciences’ SEL-212, which integrates the enzyme with a synthetic vaccine particle, achieved sustained urate control in 80% of Phase III trial participants through six months, positioning it for a 2026 FDA submission. Canakinumab secured a 2025 European label extension for quarterly flare prophylaxis, offering a significant reduction in daily pill burdens. Meanwhile, Verinurad, which showed additional urate-lowering efficacy in Phase II trials when combined with allopurinol, was deprioritized during 2024 strategic reviews.
Expansion of Digital Health and Tele-Rheumatology Channels
Smartphone-connected urate meters and wearable flare-prediction algorithms shortened treatment initiation times by 18 days across 12 U.S. health system pilots in 2025. Rheumatologist density of 0.6 per 100,000 population leaves many regions underserved, but tele-rheumatology enables primary-care physicians to initiate urate-lowering therapy under virtual specialist oversight. Anthem’s 2025 bundled-payment program cut per-member annual spending 14% compared with conventional care. Remote dashboards with gamified alerts improved refill adherence, a key gap in the management of chronic hyperuricemia. Similar pilots in urban China reduced missed clinic appointments by 22%, signaling global scalability.
Restraint Impact Analysis*
| Restraint | (~) % Impact on CAGR Forecast | Geographic Relevance | Impact Timeline |
|---|---|---|---|
| Safety Concerns With Existing And Emerging Therapies | -1.2% | Global, heightened regulatory focus in North America and Europe | Medium term (2-4 years) |
| Suboptimal Patient Adherence To Long-Term Gout Management | -1.6% | Global, acute in fragmented-care markets such as the United States, India, Brazil | Long term (≥ 4 years) |
| Generic Competition And Price Erosion Reducing Profitability | -0.8% | Global, most pronounced in mature markets with high generic penetration | Short term (≤ 2 years) |
| Regulatory Actions Limiting Promotion Of High-Purine Diets And Alcohol | -0.5% | North America and Europe, expanding to Australia and Japan | Short term (≤ 2 years) |
| Source: Mordor Intelligence | |||
Safety Concerns with Existing and Emerging Therapies
Febuxostat carries a boxed cardiovascular warning after the CARES trial showed a 34% rise in cardiac death versus allopurinol. The EMA’s 2024 label update restricts use to second-line therapy, redirecting EU prescriptions toward allopurinol. Pegloticase requires infusion-center monitoring because of anaphylaxis, adding USD 1,500-2,000 in facility fees per dose. Colchicine overdoses in renally impaired patients prompted a 2025 FDA safety alert, spotlighting its narrow therapeutic index. These signals lengthen payer approval cycles, with prior-authorization delays averaging 12 days and contributing to patient attrition before therapy begins[3]Journal of Managed Care & Specialty Pharmacy, “Prior Authorization Impact in Gout,” jmcp.org.
Suboptimal Patient Adherence to Long-Term Gout Management
One-year medication possession ratios for allopurinol hover at 52%, jeopardizing treat-to-target goals. Asymptomatic intervals erode urgency, initial flare worsening deters continuation, and branded-drug copays above USD 100 per month discourage persistence. A 2024 UK cohort that added structured education achieved 74% adherence at 18 months, outpacing usual care’s 48%. Manufacturers are testing long-acting injectables and oral fixed doses to lower pill burden, yet regulators demand non-inferiority to optimized monotherapy, delaying approvals. Behavioral nudges via mobile reminders and pharmacist-led counseling are emerging stopgaps while pipeline innovations mature.
*Our forecasts treat driver/restraint impacts as directional, not additive. The impact forecasts reflect baseline growth, mix effects, and variable interactions.
Segment Analysis
By Drug Class: Biologics Edge into Oral Territory
Xanthine oxidase inhibitors, dominated by the widespread use of allopurinol and selective utilization of febuxostat in cases with manageable cardiovascular risks, captured 46.34% of the gout therapeutics market revenue in 2025. Uricosurics are projected to grow at a strong 9.54% CAGR, driven by the increasing adoption of combination treatment protocols and the anticipated launch of next-generation URAT1 antagonists with improved renal safety profiles. Although recombinant uricase accounted for less than 5% of the market size in 2025, it delivered significant value, supported by Krystexxa's premium pricing of approximately USD 18,000 per month. Furthermore, IL-1 targeted agents, such as canakinumab, are addressing the flare-prophylaxis segment for patients intolerant to NSAIDs and colchicine, thereby expanding treatment options without directly reducing urate levels.
Pricing pressures are reshaping the oral therapeutics segment, with colchicine's generic price dropping below USD 0.50 per tablet in most markets. NSAIDs and corticosteroids contribute limited long-term value as clinical guidelines increasingly discourage their chronic use. Meanwhile, microbiome-based enzymes that metabolize dietary purines are emerging as potential oral alternatives to biologics, contingent on successful phase-I safety outcomes. However, the lack of FDA guidance on regulatory endpoints for microbiome therapeutics presents a significant challenge for sponsors. With additional febuxostat generics entering global markets, the impending patent cliffs highlight the critical need for innovation beyond traditional xanthine oxidase inhibition strategies.


By Route of Administration: Convenience Meets Refractory Need
Oral formulations held 80.32% of the 2025 gout therapeutics market share, reflecting patient preference and guideline alignment for first-line therapy. Injectable products, though accounting for only 20% of volume, are projected to grow at a 9.67% CAGR as recombinant uricase and IL-1 biologics gain broader reimbursement. Serum urate thresholds dictate modality; uncomplicated hyperuricemia responds to oral allopurinol, whereas refractory disease with tophi or renal compromise warrants infusion-center therapy. The gout therapeutics market size captured by injectables could widen further if monthly subcutaneous SEL-212 gains 2026 approval, shifting administration from hospitals to specialty pharmacies.
Long-acting injectables may improve adherence by cutting exposure to initial flare bursts that deter continuation. Encapsulation technologies aim to enable oral delivery of large-molecule uricase, yet bioavailability challenges persist. Payers increasingly structure value-based contracts tying reimbursement to documented urate reduction, pressing manufacturers to supply real-world evidence. Should oral biologic delivery succeed, the current oral-injectable dichotomy would blur, intensifying competition on pricing and adherence outcomes.
By Disease Type: Imaging-Guided Management Reshapes Demand
Chronic refractory gout controlled 52.43% of 2025 revenue because patients cycling through multiple failed regimens ultimately land on high-cost biologics. The gout therapeutics market share for tophaceous gout is set to swell, as dual-energy CT reveals subclinical tophi in up to 40% of patients previously labeled non-tophaceous. Early detection supports escalation to aggressive urate-lowering therapy, reducing surgical debridement and disability. Orphan-drug designations and seven-year exclusivity for several tophaceous indications underpin investment enthusiasm.
Acute flare management remains symptomatic, consuming NSAIDs, colchicine, and corticosteroids, with limited differentiation. Nonetheless, acute flares generated 25% of U.S. gout spending in 2024 through emergency-department presentations, validating payer interest in digital-first management pathways that flag prodromal markers. Regulatory openness to surrogate imaging endpoints in tophus resolution trials could shorten development timelines. Should early-intervention strategies reduce the prevalence of chronic refractory conditions, pipeline allocation may tilt toward preventive modalities.
Geography Analysis
North America retained 42.43% of 2025 global gout therapeutics market value. High obesity prevalence above 40% in several U.S. states and Medicare Part B coverage for infused biologics sustain premium demand. Private payers are expanding site-of-care options, contracting with ambulatory-infusion centers to trim hospital overhead. Canada’s publicly funded systems list generics readily, but biologic uptake lags outside private plans, creating disparate patient access. Mexico remains price-sensitive; generic allopurinol dominates, with biologics confined to metropolitan specialty hospitals.
Asia-Pacific is forecast to lead growth at an 8.43% CAGR through 2031. China’s gout population exceeded 17 million in 2025, clustered along affluent coastal provinces where seafood and alcohol intake are highest. Japan benefits from universal insurance and early adoption of treat-to-target practice, supporting steady febuxostat sales despite global safety concerns. India’s diagnosis gap persists; rheumatologist density is under 0.1 per 100,000 inhabitants, and branded biologics often exceed monthly household income. However, tele-rheumatology pilots in urban centers are beginning to chip away at unmet need.
Europe’s reimbursement gatekeepers, including NICE and Germany’s G-BA, subject biologics to stringent cost-effectiveness tests. Pegloticase access is restricted to oral-therapy failures, capping volume. Southern European markets favor low-cost colchicine, while France’s community pharmacies report brisk generic febuxostat turnover following 2024 patent expiry. Eastern Europe shows nascent demand, handicapped by limited specialist access and share-of-wallet constraints. The Middle East and Africa contribute modest revenue; Gulf states mirror Western therapy patterns among expatriate populations, whereas sub-Saharan markets remain early in epidemiologic transition. South America centers on Brazil and Argentina, where public formularies reimburse generics, and patient-assistance programs bridge affordability gaps for biologics.

Competitive Landscape
The global gout therapeutics market is undergoing a significant transformation. While the top five companies are projected to account for approximately 60% of the 2025 revenue, emerging players, including biosimilar pegloticase developers and niche biotech firms, are steadily eroding the incumbents' market share. Amgen's USD 27.8 billion acquisition of Horizon Therapeutics highlights the strategic importance of orphan-priced gout assets with minimal generic competition. Novartis is leveraging its extensive immunology portfolio to promote IL-1 therapies, while Takeda's 2024 acquisition of Atom Bioscience adds a preclinical oral uricase to its pipeline, further diversifying its portfolio.
Biotech companies are focusing on reducing immunogenicity, advancing oral delivery of biologics, and exploring microbiome engineering. Selecta Biosciences' immune-tolerance platform, if successful, could eliminate infusion reactions and significantly expand the market for uricase therapy. XORTX is repurposing xanthine oxidase inhibitors for kidney injury, demonstrating the potential for indication expansion. Additionally, digital health integrations are becoming a standard feature in product launches, with manufacturers bundling connected urate meters with initial doses to collect adherence and outcome data, which strengthens their position in payer negotiations. Patent filings for CRISPR-based modulation of hepatic urate synthesis indicate the potential future role of gene editing, though commercialization remains beyond the current forecast period.
Consolidation is expected to continue as large pharmaceutical companies seek inflammation franchises with differentiated mechanisms and orphan-drug economics. At the same time, generic competition is intensifying for established oral treatments, driving price-based competition, particularly in emerging markets with constrained payer budgets. Companies are strategically balancing high-margin biologics with volume-driven generics, while digital adherence programs serve as both clinical differentiators and tools for generating real-world evidence.
Gout Therapeutics Industry Leaders
Horizon Therapeutics plc
Takeda Pharmaceutical Company Ltd
AstraZeneca
Novartis AG
Selecta Biosciences
- *Disclaimer: Major Players sorted in no particular order

Recent Industry Developments
- February 2026: Crystalys Therapeutics initiated patient dosing at European clinical sites for its Phase 3 RUBY study evaluating dotinurad, a next-generation URAT1 inhibitor for gout treatment.
- December 2025: Sobi entered into a definitive agreement to acquire Arthrosi Therapeutics, Inc. (Arthrosi), a private, late-stage biotechnology company developing a next-generation treatment for gout. The acquisition strengthens Sobi’s gout franchise by adding pozdeutinurad (AR882), an investigational next-generation, once-daily oral URAT1 inhibitor currently being evaluated in two fully recruited global Phase 3 clinical studies for the potential management of progressive and tophaceous gout and expected to read out in 2026.
- October 2025: Biopharmaceutical company Crystalys Therapeutics launched with a USD 205 million Series A financing round, aiming to address the significant unmet medical needs of people living with gout.


Research Methodology Framework and Report Scope
Market Definitions and Key Coverage
Our study defines the gout therapeutics market as prescription drugs that lower serum urate or control acute gout inflammation, including xanthine-oxidase inhibitors, uricosurics, biologic uricases, colchicine, NSAIDs, corticosteroids, interleukin-1 blockers, and pipeline URAT1 inhibitors delivered through oral or injectable routes across all care settings. We treat every product as new, branded, or generic revenue recognized by manufacturers before distributor margins, and we convert all currencies to constant 2024 USD for clean comparison.
Scope exclusion: vaccines, over-the-counter dietary supplements, and surgical interventions are outside this assessment.
Segmentation Overview
- By Drug Class
- Xanthine Oxidase Inhibitors
- Uricosurics
- Recombinant Uricase
- IL-1 Inhibitors
- Colchicine
- NSAIDs
- Corticosteroids
- Other Classes
- By Route Of Administration
- Oral
- Injectable
- By Disease Type
- Acute Gout
- Chronic Refractory Gout
- Tophaceous Gout
- Geography
- North America
- United States
- Canada
- Mexico
- Europe
- Germany
- United Kingdom
- France
- Italy
- Spain
- Rest of Europe
- Asia-Pacific
- China
- Japan
- India
- Australia
- South Korea
- Rest of Asia-Pacific
- Middle East & Africa
- GCC
- South Africa
- Rest of Middle East & Africa
- South America
- Brazil
- Argentina
- Rest of South America
- North America
Detailed Research Methodology and Data Validation
Primary Research
Our analysts held structured interviews with rheumatologists, hospital pharmacists, and payor-policy managers across North America, Europe, and Asia-Pacific. These conversations sharpened assumptions on drug persistence, boxed-warning impact, and average selling prices, thereby plugging gaps left by secondary data and guiding final triangulation.
Desk Research
We began with disease prevalence and treatment-rate baselines from open data sets such as the Global Burden of Disease, CDC NHANES, WHO Global Health Observatory, and Eurostat. Regulatory approvals and clinical-trial registries helped us log launch timelines and label expansions, while customs shipment dashboards and IMS health audit snapshots illustrated regional demand pockets. Annual reports, investor decks, and Form 10-Ks of leading developers were mined through D&B Hoovers and Dow Jones Factiva to retrieve therapy revenue splits, price corridors, and pipeline milestones. Additional context came from specialty-society guidelines, peer-reviewed journals, and patent analytics from Questel. This list is illustrative only; many other credible feeds were consulted for cross-checks and clarification.
Market-Sizing & Forecasting
A top-down prevalence-to-treated-cohort build was created, and then selective bottom-up supplier roll-ups of sampled ASP × volume validated totals and highlighted leakage. Key variables include diagnosed gout prevalence, urate-lowering therapy penetration, biologic share shift after safety advisories, regional reimbursement ceilings, and mean annual treatment intensity. Multivariate regression combined with scenario analysis projected each driver under baseline, optimistic, and restrained outlooks, and results were converted to a single midpoint forecast.
Data Validation & Update Cycle
Outputs pass through anomaly checks, peer review, and senior sign-off. We refresh every model once a year, with interim pulses triggered by material label changes, guideline updates, or disruptive launches, ensuring clients always receive a recently audited view.
Why Our Gout Therapeutics Baseline Commands Reliability
Published market values frequently diverge because firms apply different product mixes, price metrics, and refresh cadences. We acknowledge these contrasts upfront so decision-makers can benchmark confidently.
Key gap drivers include inclusion of over-the-counter uric-acid supplements by some publishers, currency conversions at spot rather than average annual rates, unvalidated uptake curves for late-stage biologics, and shorter update cycles that miss February 2025 boxed-warning revisions.
Benchmark comparison
| Market Size | Anonymized source | Primary gap driver |
|---|---|---|
| USD 3.03 B (2024) | Mordor Intelligence | - |
| USD 2.82 B (2024) | Global Consultancy A | Excludes recombinant uricase class and uses retail-sales values before manufacturer rebates |
| USD 2.40 B (2024) | Regional Consultancy B | Applies conservative therapy rate of 17 % vs our validated 23 % and omits Japan |
| USD 3.22 B (2025) | Trade Journal C | Uses list prices without country-specific discount factors and projects uniform CAGR |
The comparison shows that, by selecting a clear product scope, applying real-world discount rates, and revisiting inputs after every regulatory shift, Mordor Intelligence delivers a balanced baseline that remains transparent, traceable, and repeatable for strategic planning.


Key Questions Answered in the Report
What is the projected value of the gout therapeutics market by 2031?
It is forecast to reach USD 6.67 billion, growing at a 8.11% CAGR over 2026-2031.
Which drug class currently holds the largest share?
Xanthine oxidase inhibitors led with 46.34% of 2025 revenue.
Which region is expected to grow fastest?
Asia-Pacific is projected to expand at an 8.43% CAGR through 2031.
What innovation may reduce pegloticase infusion reactions?
SEL-212 combines pegloticase with an immune-tolerance particle and maintained urate targets in 71% of patients to month 9.
How are payers using digital tools in gout management?
Insurers bundle smartphone urate meters and virtual consults to cut emergency visits and monitor adherence.
What safety concern limits febuxostat usage in the EU?
Cardiovascular risk prompted EMA restrictions, confining it to patients intolerant of allopurinol.
Page last updated on:


