Electric Commercial Vehicle Battery Pack Market Size and Share
Market Overview
| Study Period | 2020 - 2031 |
|---|---|
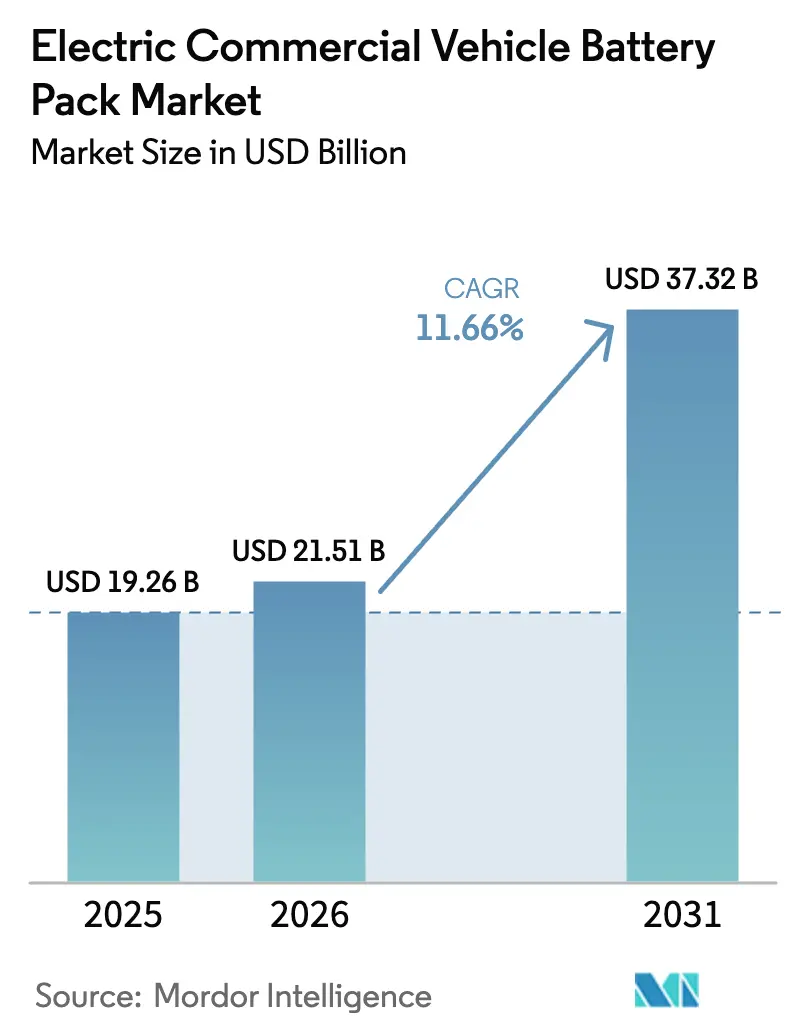
| Market Size (2026) | USD 21.51 Billion |
| Market Size (2031) | USD 37.32 Billion |
| Growth Rate (2026 - 2031) | 11.66% CAGR |
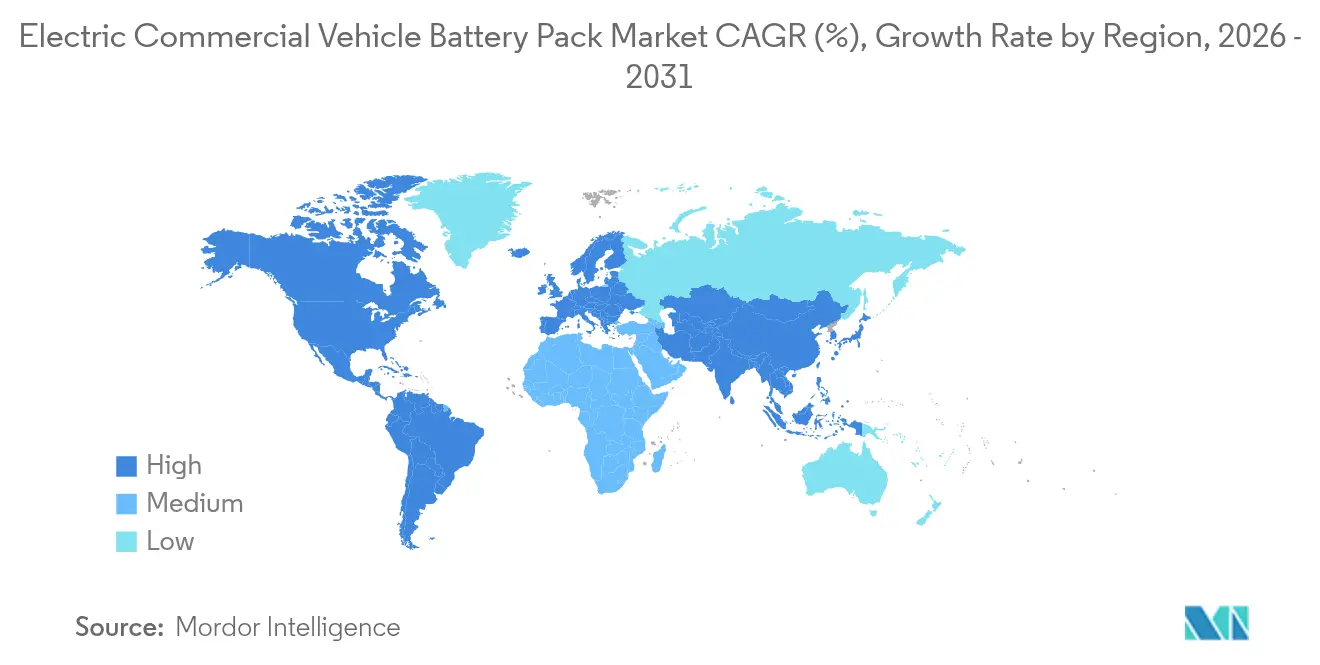
| Fastest Growing Market | Europe |
| Largest Market | Asia-Pacific |
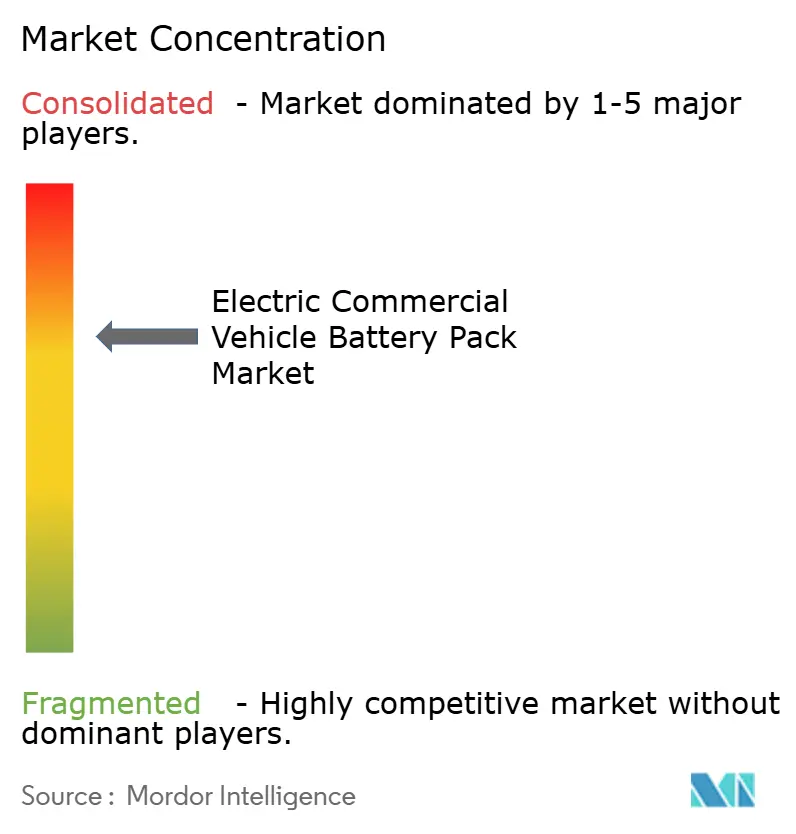
| Market Concentration | Medium |
Major Players *Disclaimer: Major Players sorted in no particular order Image © Mordor Intelligence. Reuse requires attribution under CC BY 4.0. | |
Electric Commercial Vehicle Battery Pack Market Analysis by Mordor Intelligence
The electric commercial vehicle battery pack market size in 2026 is estimated at USD 21.51 billion, growing from 2025 value of USD 19.26 billion with 2031 projections showing USD 37.32 billion, growing at 11.66% CAGR over 2026-2031. Growth rests on falling pack prices that are expected to dip below the pivotal mark in 2025, sharpening cost parity with diesel drivetrains. Rapid e-commerce expansion, zero-emission mandates, and energy-dense cell-to-pack (CTP) designs further bolster adoption, while megawatt-charging standards shorten refueling times for long-haul fleets. Asia-Pacific holds the manufacturing advantage, yet Europe leads policy-driven demand acceleration. The competitive landscape shows moderate concentration as vertically integrated leaders scale upstream to secure lithium, nickel, and separator supplies.
Key Report Takeaways
- By vehicle type, light commercial vehicles held 60.74% of electric commercial vehicle battery pack market share in 2025, whereas medium and heavy-duty trucks are on track for a 14.63% CAGR through 2031.
- By propulsion type, battery electric vehicles captured 97.52% share in 2025 and are projected to post a 12.07% CAGR to 2031.
- By battery chemistry, lithium iron phosphate led with 41.95% share in 2025, while lithium manganese iron phosphate is set for a 31.62% CAGR through 2031.
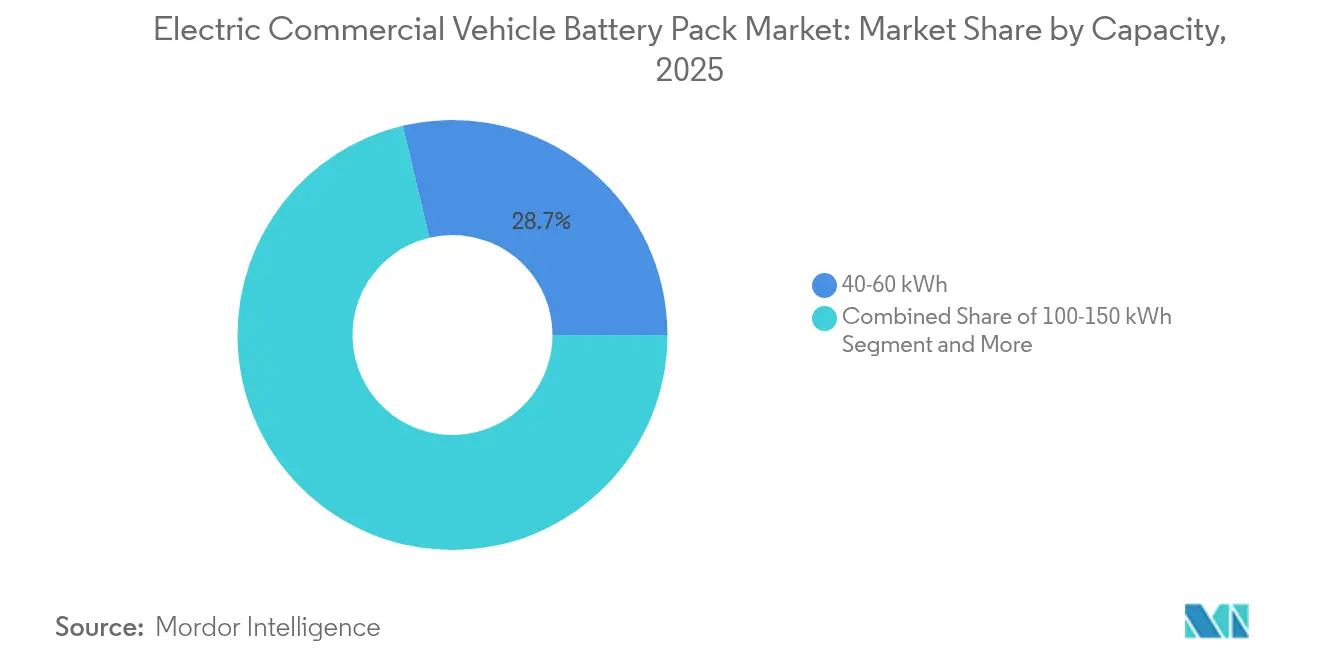
- By capacity, the 40–60 kWh range commanded 28.72% of electric commercial vehicle battery pack market size in 2025, whereas the 100–150 kWh band should expand at 16.58% CAGR to 2031.
- By battery form, prismatic cells accounted for 46.08% share in 2025, yet pouch cells are poised for an 17.65% CAGR by 2031.
- By voltage class, 400–600 V systems dominated with 62.54% share in 2025 as above-800 V packs accelerate at 12.84% CAGR on the back of megawatt charging.
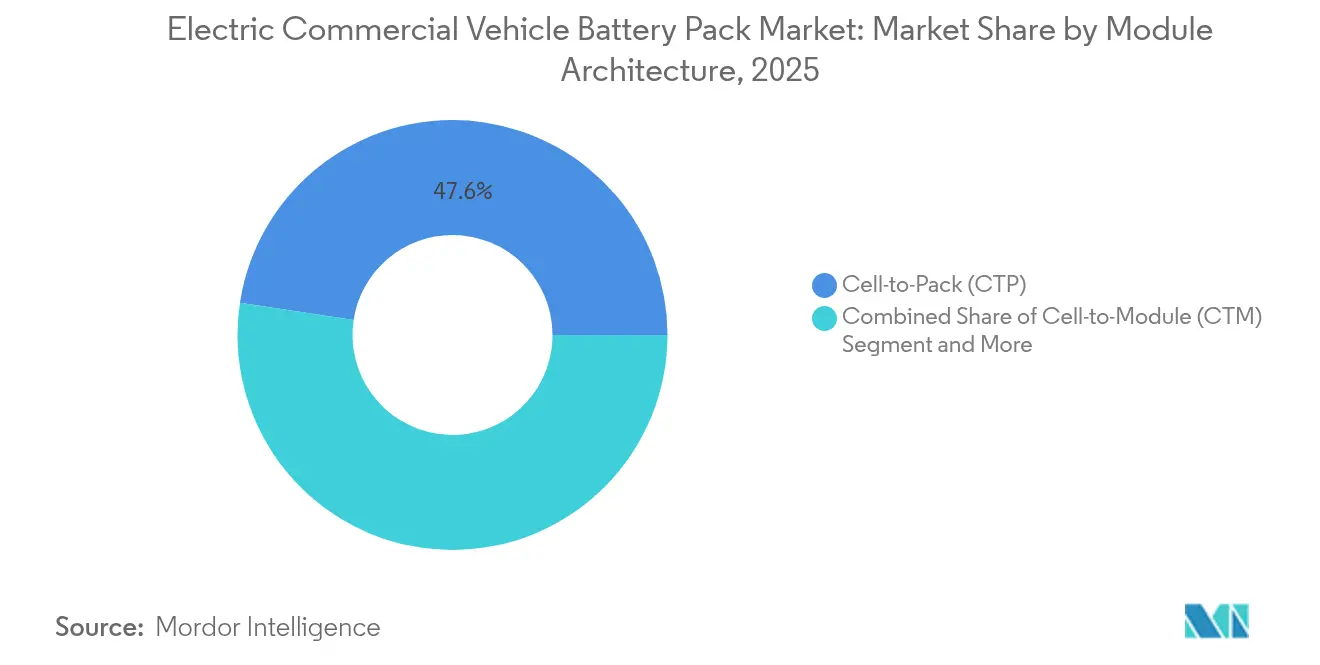
- By module architecture, cell-to-pack designs secured 47.61% share in 2025 and are growing at 13.11% CAGR.
- By component, anode accounted for 68.12% share in 2025, yet separators are poised for an 12.44% CAGR by 2031.
- By geography, Asia-Pacific retained 47.21% share in 2025, while Europe is forecast for a 16.91% CAGR to 2031.
Note: Market size and forecast figures in this report are generated using Mordor Intelligence’s proprietary estimation framework, updated with the latest available data and insights as of 2026.
Global Electric Commercial Vehicle Battery Pack Market Trends and Insights
Drivers Impact Analysis*
| Driver | (~) % Impact on CAGR Forecast | Geographic Relevance | Impact Timeline |
|---|---|---|---|
| Battery Pack Cost Below USD 90/kW | +3.2% | Global; early China, Europe | Short term (≤ 2 years) |
| Zero-emission Fleet Mandates | +2.8% | North America, Europe, China | Medium term (2-4 years) |
| Urban Last-mile Electrification | +2.1% | Global urban cores | Short term (≤ 2 years) |
| High-energy LFP Chemistries | +1.9% | Asia-Pacific, expanding to North America and Europe | Medium term (2-4 years) |
| Cell to Pack Adoption | +1.5% | Global, led by Chinese OEMs | Long term (≥ 4 years) |
| Megawatt Charging Standard | +1.3% | Europe, North America initially | Long term (≥ 4 years) |
| Source: Mordor Intelligence | |||


Battery-Pack Costs Falling Below USD 90/kWh in 2025
Manufacturing scale, cathode optimization, and vertical integration are playing a crucial role in driving significant reductions in pack prices over time. Cost parity unlocks TCO advantages in urban delivery and regional haul duty cycles, especially where regenerative braking maximizes kWh efficiency. CATL has already reported sub-USD 100/kWh production for high-volume LFP cells, demonstrating the influence of Chinese economies of scale. Stable lithium prices since the 2024 correction have added margin headroom, motivating fleet operators to accelerate their procurement schedules. The virtuous cycle of higher demand attracting new capacity keeps the cost-down trajectory intact through the forecast window.
Zero-Emission Mandates for HD Vehicles in US/EU/China
The EPA Phase 3 rule insists that significant share of new urban delivery trucks be zero emission by 2032, while the EU targets a 90% CO2 cut in heavy-duty vehicles by 2040. China’s updated dual-credit system forces OEMs to earn new-energy credits equal to a notable share of output in 2024. These regulations give cell suppliers predictable demand signals justifying multibillion-dollar gigafactories. Credit trading adds revenue upside for early movers and cost penalties for laggards, sharpening competition. Regional phase-in schedules let global brands pilot technology in compliant zones before spreading worldwide.
Urban Last-Mile Electrification Driven by E-Commerce
Amazon’s purchase commitment for 100,000 electric vans and DHL’s 60% electrified last-mile target by 2030 are expanding demand for 40–80 kWh packs optimized for stop-and-go duty cycles. Low-emission zones in London and Paris restrict access to diesel vans, essentially mandating electric alternatives [1]“Electrifying Last-Mile Delivery,” Transport & Environment, transportenvironment.org. Urban distribution centers now prioritize quick-turn charging and thermal robustness, as vehicles may charge multiple times per day. Micro-fulfillment strategies shorten trip distances but increase delivery frequency, favoring packs with high cycle life over those with maximum capacity. Penalties, such as congestion charges, give electric fleets an immediate cost advantage, thereby accelerating their adoption.
Commercial Adoption of High-Energy LFP/LFP Chemistries
LFP now delivers 180–200 Wh/kg, due to advanced doping and nano-coatings, making it viable for medium-range commercial use without the high costs associated with nickel and cobalt. LMFP adds manganese to increase energy density while maintaining the cobalt-free bill of materials. Fleets prize the more than 4,000 cycle life and thermal stability over maximum gravimetric performance. The chemistry’s simplified supply chain hedges against geopolitical risk tied to nickel and cobalt sources. Lower raw-material exposure also delivers price predictability that CFOs prefer when planning multi-year fleet rollouts.
Restraints Impact Analysis*
| Restraint | (~) % Impact on CAGR Forecast | Geographic Relevance | Impact Timeline |
|---|---|---|---|
| Critical Minerals Price Volatility | –1.8% | Global; highest in import-reliant regions | Short term (≤ 2 years) |
| Sparse Heavy-duty Charging | –1.5% | North America, Europe lag; China leads | Medium term (2-4 years) |
| Thermal Runaway Risk | –0.9% | Middle East, Southeast Asia, Southern United States/EU | Long term (≥ 4 years) |
| Weight Based Road Taxes | –0.7% | European Union | Medium term (2-4 years) |
| Source: Mordor Intelligence | |||
Critical-Minerals Price Volatility (Li, Ni, Co)
Lithium carbonate has experienced a significant decline from its previous peak but remains highly sensitive to supply disruptions in Chile and Australia, complicating cost forecasts. Nickel swings tied to Indonesian export policies and Russian supply disruptions add further uncertainty, particularly for high-nickel chemistries. Cobalt’s concentration in the Democratic Republic of the Congo raises ethical sourcing challenges that are reflected in OEM ESG disclosures. Price turbulence compresses margins and forces inventory hedging, nudging manufacturers toward vertical integration. Chemistry shifts to LFP and LMFP are partially defensive moves against the volatility of nickel-cobalt.
Sparse Public HD Charging Infrastructure
In 2024, the availability of public chargers capable of delivering megawatts remained significantly limited compared to the widespread presence of stations for passenger electric vehicles. Capital costs per site stretch high, scaring off private investors unless utilization milestones are guaranteed. Utilities require long lead times for multi-megawatt interconnects, allowing project timelines to exceed fleet procurement cycles. The chicken-and-egg dilemma slows OEM sales because operators want sight of chargers before placing orders. Government funding, such as the United States NEVI program, offers relief but remains tangled in permitting bottlenecks.
*Our forecasts treat driver/restraint impacts as directional, not additive. The impact forecasts reflect baseline growth, mix effects, and variable interactions.
Segment Analysis
By Vehicle Type: Fleet Electrification Drives Segment Dynamics
Light commercial vehicles captured 60.74% of the electric commercial vehicle battery pack market share in 2025, thanks to intensive last-mile parcel demand and the availability of 40–80 kWh packs that strike a balance between cost and payload. The segment benefits from urban depot charging networks that eliminate range anxiety and from city policies that ban diesel vans during peak hours. Parcel giants retrofit depots with 400 V chargers, accelerating night-time turnaround and minimizing daytime dwell. Telemetry data show that average daily mileage remains low, validating smaller pack strategies that lower acquisition cost. Insurance premiums also fall because electric vans feature fewer moving parts and advanced ADAS stacks tied to OEM telematics.
Medium and heavy-duty trucks are on pace for a 14.63% CAGR as pack prices fall and megawatt charging enables 45-minute refuels on mandated driver breaks. Battery capacities in the 300–800 kWh band now provide 500-km operational envelopes, opening regional haul lanes. Fleet trials in California and the EU Rhine corridor confirm TCO parity with a rise in diesel prices. OEM order books for 2026 delivery windows have grown significantly compared to 2023, signaling a scaling inflection. Policy incentives, such as the United States Inflation Reduction Act’s cell credit, further tighten economics, supporting high-voltage architectures.


By Propulsion Type: BEV Dominance Reflects Technology Maturity
Battery electric vehicles held 97.52% propulsion share in 2025, a ratio that cements maturity and simplifies service training across multinational fleets. The electric commercial vehicle battery pack market benefits from BEV simplicity, which lowers parts inventories and eliminates complex after-treatment systems, supporting its 12.07% CAGR growth. Pack degradation analytics now predict residual capacity with significant accuracy, enabling risk-based warranty models that fleet CFOs accept. Garage technicians appreciate unified diagnostics over the dual drivetrain complexity of PHEVs, thereby shortening their learning curves.
Plug-in hybrids still occupy rural logistics niches yet face headwinds as charging deserts recede and battery densities rise. Policy frameworks seldom grant the same zero-emission zone privileges to PHEVs, undermining last-mile value propositions. Manufacturers have curtailed new PHEV truck programs, steering R&D toward pure electric and fuel-cell variants. As megawatt charging spreads, the relevance of PHEVs may collapse altogether, freeing suppliers to focus on a single propulsion supply chain.
By Battery Chemistry: LFP Leadership with LMFP Emergence
Lithium iron phosphate (LFP) commanded 41.95% electric commercial vehicle battery pack market share in 2025 by delivering cycle life above 4,000 cycles—twice that of nickel-based chemistries—while costing less. Fleet case studies report maintenance savings because thermal runaway events are rarer, lowering insurance premiums. LFP’s flat discharge curve also simplifies state-of-charge estimation, easing route planning apps.
Lithium manganese iron phosphate (LMFP) is clocking a 31.62% CAGR by adding energy density yet preserving cobalt-free material lists. OEMs trial LMFP packs in commercial vehicles, where weight budgets are tight.Supply chains leverage existing LFP factories with only cathode line tweaks, compressing time-to-market versus new chemistries. Nickel-rich NMC persists in payload-critical segments but its share erodes as LMFP scales.
By Capacity: Mid-Range Dominance with High-Capacity Growth
Packs in the 40–60 kWh bracket absorbed 28.72% market share in 2025, a sweet spot for urban delivery vans that average 120 km per shift and recharge overnight. Fleets appreciate that more miniature packs lighten gross vehicle weight, reclaiming payload lost to batteries. Cost models reveal a notable payback where congestion charges and carbon levies tax diesel.
The 100–150 kWh category is growing at a 16.58% CAGR because regional haul and Class 6 trucks require 300-km autonomy without compromising cargo capacity. As megawatt chargers arrive, planners design duty cycles around 30-minute mid-shift top-ups, shrinking the required onboard kWh. OEM warranty data indicate capacity fade after 800 cycles, aligning with five-year fleet replacement cycles. Buyers are increasingly specifying modular designs, allowing packs to be resized as routes evolve.
By Battery Form: Prismatic Leadership with Pouch Growth
Prismatic cells delivered a 46.08% share due to their structural rigidity, which allows packs to serve as chassis elements, trim frame steel, and increase volumetric efficiency . OEMs integrate side-impact beams directly into the pack enclosure, meeting Euro NCAP truck safety targets without the need for extra subframes. Cooling plates fit neatly between the wide, prismatic faces, enhancing temperature uniformity during fast charging.
Pouch cells, growing at an 17.65% CAGR, offer lower internal resistance and superior heat dissipation, which is critical for transit buses that require quick charging every two loops. Though mechanically less rigid, pouches drop weight and enable creative stair-step pack geometries under low-floor bus decks. Suppliers now laminate ceramic-coated separators to reduce swelling, a former barrier to commercial use. Cylindrical designs fade in share but persist where passenger-car supply chains offer price leverage.
By Voltage Class: Mid-Voltage Dominance with High-Voltage Growth
Systems in the 400–600 V band owned 62.54% share, balancing charger availability, safety norms, and legacy component costs. Aftermarket technicians are comfortable with 600 V lock-out protocols, speeding service turnaround. Component bins such as contactors, fuses, and DC-DC converters are widely stocked, minimizing downtime for fleets.
Above-800 V architectures, scaling at 12.84% CAGR, unlock 1 MW-plus charging that shrinks dwell from hours to sub-hour windows. Thermal modeling shows higher inverter efficiency, which translates into usable range gains on 500-km lanes. Suppliers have launched silicon-carbide power modules, allowing compact inverters that fit under cab floor panels. Safety standards now mandate dual-redundant isolation monitoring, raising upfront cost but alleviating driver concerns.
By Module Architecture: CTP Leadership Drives Integration
Cell-to-pack (CTP) designs secured a 47.61% share by eliminating modules and their aluminum housings, thereby delivering a higher gravimetric density. BYD’s Blade Battery doubles as a crash rail, clearing European side-impact tests without extra bracing. Assembly line takt time decreases because robots place cells directly into final enclosures, driving the segment's growth trajectory at a 13.11% CAGR.
Module-to-pack (MTP) provides a transitional roadmap for legacy factories, allowing suppliers to retain some module tooling while achieving density improvements. Field service teams appreciate that MTP allows for partial pack swaps, a maintenance advantage not found in fully structural designs. Thermal propagation barriers become more complex, yet early field data show low failure rates per million cell cycles.
By Component: Anode Dominance with Separator Growth
Anodes represented 68.12% of the value content in 2025, as silicon-enhanced graphite edged out energy density. Start-ups are piloting silicon nanowire blends that absorb swelling stresses, aiming to extend charge cycles. Graphite demand has shifted toward natural flake sources as synthetic supplies tighten due to ESG audits.
Separator spending is rising at a 12.44% CAGR because ceramic-coated films are mandatory in high-temperature markets, such as the Middle East. Solid-state research spills over into polymer-rich hybrid separators that promise higher puncture resistance. Cathode value shrinks modestly as fleets switch to cobalt-free LFP/LMFP, redirecting R&D budgets toward electrolyte additives that widen the 800 V operating window.
Geography Analysis
Asia-Pacific commanded 47.21% electric commercial vehicle battery pack market share in 2025, anchored by China’s cradle-to-grave supply chains that compress costs to the lowest global levels. Domestic subsidies, ranging from cell output grants to toll exemptions, enhance the competitiveness of local OEMs, which now export packs to ASEAN and Latin America. India’s Production-Linked Incentive scheme further fuels regional gigafactory announcements, turning the subcontinent into a rising secondary hub.
Europe is projected to have a 16.91% CAGR through 2031, driven by the Fit-for-55 emissions caps and funding tiers for alternative-fuel infrastructure. Cross-border corridor projects along the Rhine-Alpine axis offer megawatt charging every 120 km, giving haulers the confidence to electrify long-haul lanes. Tax credits under Germany’s program subsidize battery truck premiums, pulling forward orders into 2026 build slots. Supplier localization is mandatory under EU Battery Regulation rules, creating openings for regional cathode and separator plants.
North America’s trajectory hinges on the Inflation Reduction Act incentives that pay USD 35/kWh for packs with local content thresholds . California’s Advanced Clean Fleets rule sets early targets that ripple through nationwide logistics contracts. Grid readiness remains patchy outside coastal metros, yet utilities have queued notable truck-charging interconnects for 2025-2027. Mexico eyes maquiladora expansions to supply OEMs In United States tariff-free, offering lower labor costs while meeting content rules.

Competitive Landscape
The top suppliers include CATL, BYD, LG Energy Solution, Panasonic, and Samsung SDI, which collectively control a notable share, signaling moderate consolidation. Vertical integration into lithium conversion and separator coating enables leaders to shield their margins from raw-material price spikes. CATL’s significant design for Class 8 trucks leverages 255 Wh/kg pack density to satisfy weight-constrained segments. BYD exploits captive vehicle channels to absorb Blade Battery capacity before selling excess to third-party OEMs.
Joint ventures proliferate: Stellantis and Samsung SDI in Indiana, Ford and SK On in Tennessee, and Volvo with Northvolt in Sweden, each aligning regional supply with local-content mandates. Software emerges as a differentiator; LG Energy Solution’s AI-driven BMS extends usable SOH by adapting charge profiles on the fly. Smaller challengers, such as ProLogium, court niche markets with solid-state prototypes, positioning themselves for second-wave adoption.
Geopolitics weigh heavily. The United States Treasury restricts credits for packs containing “foreign entity of concern” materials, prompting Korean and Japanese firms to source lithium from Australia and Canada. Chinese giants answer with localized facilities in Hungary and Thailand, hedging against export duties. As safety rules mature, certification agility becomes a moat; incumbents maintain in-house UL 2580 labs, shortening time-to-market for new models.
Electric Commercial Vehicle Battery Pack Industry Leaders
Contemporary Amperex Technology Co., Limited (CATL)
BYD Company Ltd.
LG Energy Solution, Ltd.
Panasonic Holdings Corporation
Samsung SDI Co., Ltd.
- *Disclaimer: Major Players sorted in no particular order

Recent Industry Developments
- September 2025: Ashok Leyland and CALB announced a joint battery plant in India targeting bus and truck packs, integrating Chinese process expertise with Indian assembly capabilities.
- August 2025: Leapmotor began supplying in-house battery packs to commercial OEMs, signaling a strategic shift toward BYD-style vertical integration.
- June 2025: Neuron Energy launched Gen 2 lithium-ion packs for light commercial fleets in India, promising lower cost per kilometer and higher cycle life.
- September 2024: CATL unveiled the Tectrans series for heavy-duty trucks, featuring variants optimized for superfast charging and extended range.


Global Electric Commercial Vehicle Battery Pack Market Report Scope
Bus, LCV, M&HDT are covered as segments by Body Type. BEV, PHEV are covered as segments by Propulsion Type. LFP, NCA, NCM, NMC, Others are covered as segments by Battery Chemistry. 15 kWh to 40 kWh, 40 kWh to 80 kWh, Above 80 kWh, Less than 15 kWh are covered as segments by Capacity. Cylindrical, Pouch, Prismatic are covered as segments by Battery Form. Laser, Wire are covered as segments by Method. Anode, Cathode, Electrolyte, Separator are covered as segments by Component. Cobalt, Lithium, Manganese, Natural Graphite, Nickel are covered as segments by Material Type. Asia-Pacific, Europe, Middle East & Africa, North America, South America are covered as segments by Region.| Light Commercial Vehicle (LCV) |
| Medium and Heavy-Duty Truck |
| Bus |
| BEV (Battery Electric Vehicle) |
| PHEV (Plug-in Hybrid Electric Vehicle) |
| LFP (Lithium Iron Phosphate) |
| LMFP (Lithium Manganese Iron Phosphate) |
| NMC (Lithium Nickel Manganese Cobalt Oxide) |
| NCA (Lithium Nickel Cobalt Aluminum Oxide) |
| LTO (Lithium-Titanium-Oxide) |
| Others (LCO, LMO, NMX, Emerging Battery Technologies, etc.) |
| Below 15 kWh |
| 15-40 kWh |
| 40-60 kWh |
| 60-80 kWh |
| 80-100 kWh |
| 100-150 kWh |
| Above 150 kWh |
| Cylindrical |
| Pouch |
| Prismatic |
| Below 400 V |
| 400-600 V |
| 600-800 V |
| Above 800 V |
| Cell-to-Module (CTM) |
| Cell-to-Pack (CTP) |
| Module-to-Pack (MTP) |
| Anode |
| Cathode |
| Electrolyte |
| Separator |
| North America | United States |
| Canada | |
| Rest of North America | |
| South America | Brazil |
| Argentina | |
| Rest of South America | |
| Europe | Germany |
| France | |
| Italy | |
| United Kingdom | |
| Sweden | |
| Rest of Europe | |
| Asia-Pacific | China |
| Japan | |
| India | |
| South Korea | |
| Thailand | |
| Rest of Asia-Pacific | |
| Middle East and Africa | United Arab Emirates |
| Saudi Arabia | |
| South Africa | |
| Rest of Middle East and Africa |
| By Vehicle Type | Light Commercial Vehicle (LCV) | |
| Medium and Heavy-Duty Truck | ||
| Bus | ||
| By Propulsion Type | BEV (Battery Electric Vehicle) | |
| PHEV (Plug-in Hybrid Electric Vehicle) | ||
| By Battery Chemistry | LFP (Lithium Iron Phosphate) | |
| LMFP (Lithium Manganese Iron Phosphate) | ||
| NMC (Lithium Nickel Manganese Cobalt Oxide) | ||
| NCA (Lithium Nickel Cobalt Aluminum Oxide) | ||
| LTO (Lithium-Titanium-Oxide) | ||
| Others (LCO, LMO, NMX, Emerging Battery Technologies, etc.) | ||
| By Capacity | Below 15 kWh | |
| 15-40 kWh | ||
| 40-60 kWh | ||
| 60-80 kWh | ||
| 80-100 kWh | ||
| 100-150 kWh | ||
| Above 150 kWh | ||
| By Battery Form | Cylindrical | |
| Pouch | ||
| Prismatic | ||
| By Voltage Class | Below 400 V | |
| 400-600 V | ||
| 600-800 V | ||
| Above 800 V | ||
| By Module Architecture | Cell-to-Module (CTM) | |
| Cell-to-Pack (CTP) | ||
| Module-to-Pack (MTP) | ||
| By Component | Anode | |
| Cathode | ||
| Electrolyte | ||
| Separator | ||
| By Geography | North America | United States |
| Canada | ||
| Rest of North America | ||
| South America | Brazil | |
| Argentina | ||
| Rest of South America | ||
| Europe | Germany | |
| France | ||
| Italy | ||
| United Kingdom | ||
| Sweden | ||
| Rest of Europe | ||
| Asia-Pacific | China | |
| Japan | ||
| India | ||
| South Korea | ||
| Thailand | ||
| Rest of Asia-Pacific | ||
| Middle East and Africa | United Arab Emirates | |
| Saudi Arabia | ||
| South Africa | ||
| Rest of Middle East and Africa | ||


Market Definition
- Battery Chemistry - Various types of battery chemistry considred under this segment include LFP, NCA, NCM, NMC, Others.
- Battery Form - The types of battery forms offered under this segment include Cylindrical, Pouch and Prismatic.
- Body Type - Body types considered under this segment include, LCV (light commercial vehicle), M&HDT (medium & heavy duty trucks)and buses.
- Capacity - Various types of battery capacities inldude under theis segment are 15 kWH to 40 kWH, 40 kWh to 80 kWh, Above 80 kWh and Less than 15 kWh.
- Component - Various components covered under this segment include anode, cathode, electrolyte, separator.
- Material Type - Various material covered under this segment include cobalt, lithium, manganese, natural graphite, nickel, other material.
- Method - The types of method covered under this segment include laser and wire.
- Propulsion Type - Propulsion types considered under this segment include BEV (Battery electric vehicles), PHEV (plug-in hybrid electric vehicle).
- ToC Type - ToC 2
- Vehicle Type - Vehicle type considered under this segment include commercial vehicles with various EV powertrains.
| Keyword | Definition |
|---|---|
| Electric vehicle (EV) | A vehicle which uses one or more electric motors for propulsion. Includes cars, buses, and trucks. This term includes all-electric vehicles or battery electric vehicles and plug-in hybrid electric vehicles. |
| PEV | A plug-in electric vehicle is an electric vehicle that can be externally charged and generally includes all electric vehicles as well as plug-electric vehicles as well as plug-in hybrids. |
| Battery-as-a-Service | A business model in which the battery of an EV can be rented from a service provider or swapped with another battery when it runs out of charge |
| Battery Cell | The basic unit of an electric vehicle's battery pack, typically a lithium-ion cell, that stores electrical energy. |
| Module | A subsection of an EV battery pack, consisting of several cells grouped together, often used to facilitate manufacturing and maintenance. |
| Battery Management System (BMS) | An electronic system that manages a rechargeable battery by protecting the battery from operating outside its safe operating area, monitoring its state, calculating secondary data, reporting data, controlling its environment, and balancing it. |
| Energy Density | A measure of how much energy a battery cell can store in a given volume, usually expressed in watt-hours per liter (Wh/L). |
| Power Density | The rate at which energy can be delivered by the battery, often measured in watts per kilogram (W/kg). |
| Cycle Life | The number of complete charge-discharge cycles a battery can perform before its capacity falls under a specified percentage of its original capacity. |
| State of Charge (SOC) | A measurement, expressed as a percentage, that represents the current level of charge in a battery compared to its capacity. |
| State of Health (SOH) | An indicator of the overall condition of a battery, reflecting its current performance compared to when it was new. |
| Thermal Management System | A system designed to maintain optimal operating temperatures for an EV's battery pack, often using cooling or heating methods. |
| Fast Charging | A method of charging an EV battery at a much faster rate than standard charging, typically requiring specialized charging equipment. |
| Regenerative Braking | A system in electric and hybrid vehicles that recovers energy normally lost during braking and stores it in the battery. |


Research Methodology
Mordor Intelligence follows a four-step methodology in all its reports.
- Step-1: Identify Key Variables: To build a robust forecasting methodology, the variables and factors identified in Step-1 are tested against available historical market numbers. Through an iterative process, the variables required for market forecast are set and the model is built based on these variables.
- Step-2: Build a Market Model: Market-size estimations for the historical and forecast years have been provided in revenue and volume terms. Market revenue is calculated by multiplying the volume demand with volume-weighted average battery pack price (per kWh). Battery pack price estimation and forecast takes into account various factors affecting ASP, such as inflation rates, market demand shifts, production costs, technological developments, and consumer preferences, providing estimations for both historical data and future trends.
- Step-3: Validate and Finalize: In this important step, all market numbers, variables, and analyst calls are validated through an extensive network of primary research experts from the market studied. The respondents are selected across levels and functions to generate a holistic picture of the market studied.
- Step-4: Research Outputs: Syndicated Reports, Custom Consulting Assignments, Databases & Subscription Platforms


