
Home and Property Improvement
9th JuneA Leading Sanitaryware Company’s Journey in Saudi Arabia
4 Min Read
The Global Swimming Pool Market Report is Segmented by End User (Hospitality & Recreation Pools, Commercial Sports & Fitness Facilities, and More), Revenue Source (Membership/Subscription Revenue, Ticket/Pay-per-Entry Revenue, and More), Pool Size (Standard Commercial Pools, Semi-Olympic Pools, and More), and Geography (North America, South America, and More). The Market Forecasts are Provided in Terms of Value (USD).
Market Overview
| Study Period | 2019 - 2030 |
|---|---|
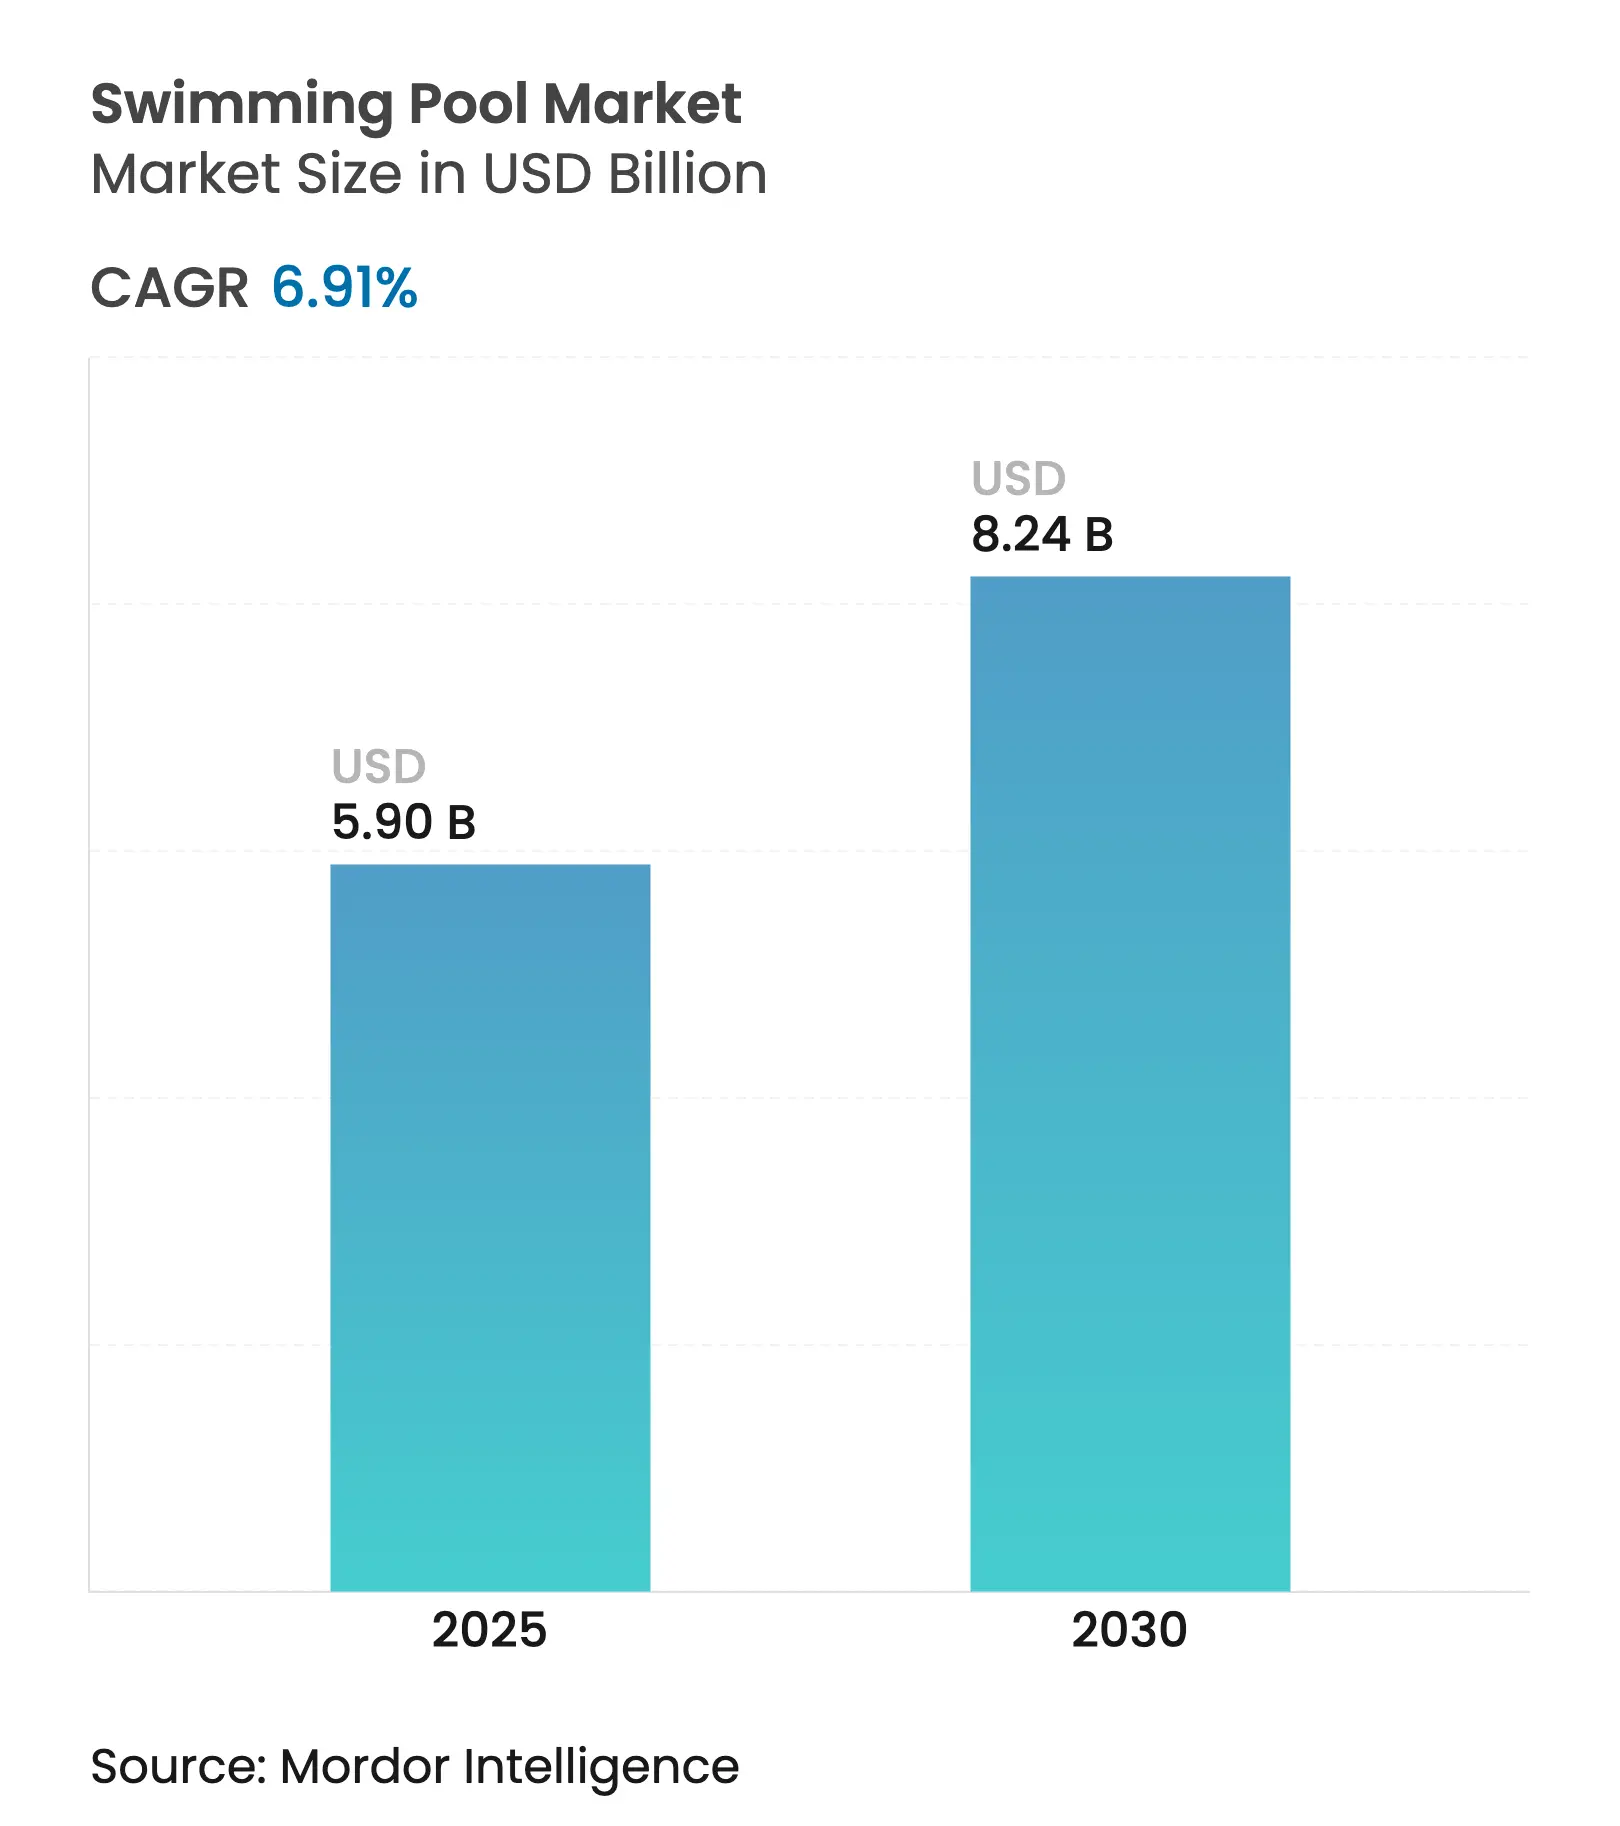
| Market Size (2025) | USD 5.90 Billion |
| Market Size (2030) | USD 8.24 Billion |
| Growth Rate (2025 - 2030) | 6.91 % CAGR |
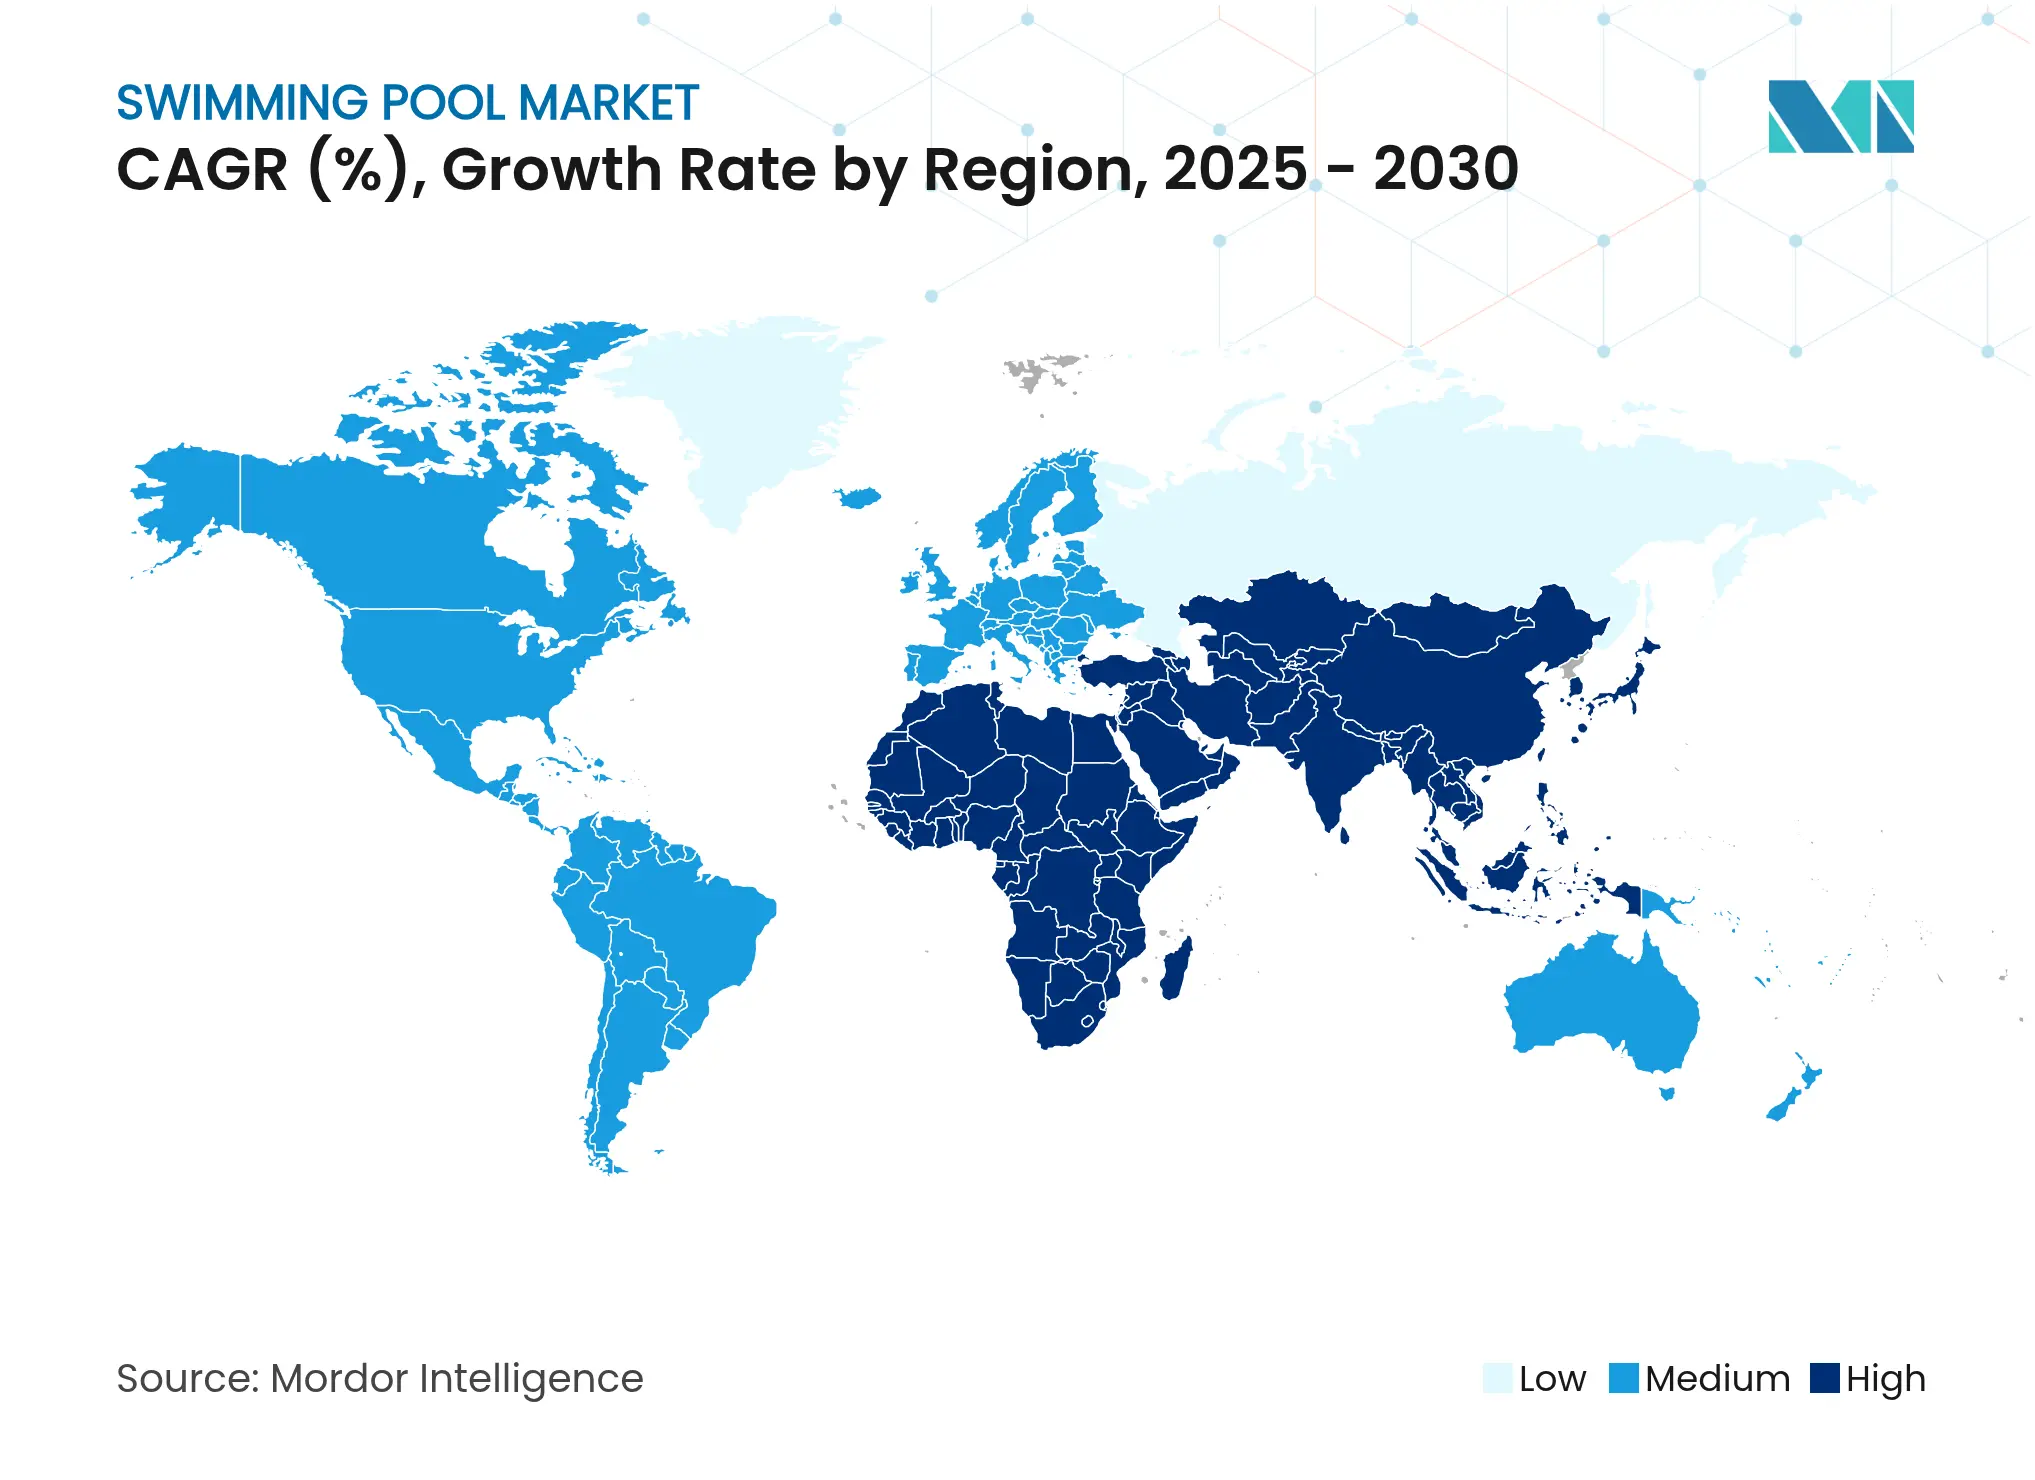
| Fastest Growing Market | Middle East and Africa |
| Largest Market | North America |
| Market Concentration | Low |
Major Players *Disclaimer: Major Players sorted in no particular order. Image © Mordor Intelligence. Reuse requires attribution under CC BY 4.0. |
Rising hotel refurbishments, wellness-driven memberships, and connected-equipment retrofits underpin this growth, while diversified revenue models help facilities offset seasonality and economic swings. Operators weave rooftop pools, spa integrations, and corporate-event packages into their offerings, raising average daily rates and broadening demand beyond vacation travelers. Energy-efficient heaters and variable-speed pumps, frequently supported by local sustainability incentives, curb utility expenditures that can otherwise consume half of a temperate-climate pool’s budget. Emerging markets in the Middle East and Africa contribute outsized growth as tourism mega-projects specify multiple aquatic amenities per property and public planners prioritize recreational infrastructure.
Key Report Takeaways
Drivers Impact Analysis
| Driver | (~) % Impact on CAGR Forecast | Geographic Relevance | Impact Timeline | |||
|---|---|---|---|---|---|---|
Hospitality industry expansion
boosts commercial revenues
Hospitality industry expansion
boosts commercial revenues
| +1.2% | Global, with focus in APAC and MEA | Medium term (2 – 4 years) |
(~) % Impact on CAGR Forecast
:
+1.2%
|
Geographic Relevance
:
Global, with focus in APAC and MEA
|
Impact Timeline
:
Medium term (2 – 4 years)
|
Urban hotels add rooftop pools
Urban hotels add rooftop pools
| +0.8% | North America, Europe, and APAC city centers | Short term (≤ 2 years) | |||
Wellness clubs expand aquatic
memberships
Wellness clubs expand aquatic
memberships
| +1.0% | Global, strongest in North America and Europe | Long term (≥ 4 years) | |||
Franchised swimming schools grow
international footprints
Franchised swimming schools grow
international footprints
| +0.7% | North America, expanding into APAC and Europe | Medium term (2 – 4 years) | |||
Corporate events demand poolside
venues
Corporate events demand poolside
venues
| +0.4% | Primarily North America and Europe | Short term (≤ 2 years) | |||
Energy-efficient smart-pool systems
gain traction
Energy-efficient smart-pool systems
gain traction
| +0.6% | Global, led by North America and Europe | Long term (≥ 4 years) | |||
| Source: Mordor Intelligence | ||||||
Hospitality Industry Expansion Boosts Commercial Revenues
Hotel developers increasingly view pools as revenue centers rather than fixed costs, integrating multi-pool layouts, splash zones, and cabana villages that generate incremental guest spending through day passes and premium room packages. Properties under construction in Saudi Arabia allocate entire rooftop levels to aquatic amenities, reflecting a major specification rate for pools across Vision 2030 projects. Upscale brands introduce wellness-themed swim circuits that combine cold-plunge stations and hydrotherapy jets, allowing hotels to sell spa-plus-stay bundles during low leisure seasons. Moreover, franchise operators report franchisees achieving payback within four years when pools contribute at least one-quarter of total resort ancillaries. Rising RevPAR performance, validated by property appraisers, further encourages lenders to finance aquatic-centric renovations at favorable terms.
Urban Hotels Add Rooftop Pools
Dense metropolitan properties leverage rooftops to create visual differentiation, often commanding 25–40% higher average daily rates than comparable hotels without elevated pools, while providing year-round revenue opportunities through private event bookings and premium cabana rentals. The trend extends beyond luxury segments, with mid-scale brands incorporating rooftop pools as competitive differentiators in dense urban markets where ground-level space is prohibitively expensive. Installation costs are offset by enhanced property valuations and improved occupancy rates during traditionally slower periods.
Wellness Clubs Expand Aquatic Memberships
Gyms and health clubs position pools as core components of holistic wellness programs that blend physical therapy, mindfulness, and cardiovascular training. Post-pandemic parental anxiety fuels a surge in learn-to-swim classes, with operators regularly hitting 115–120% of pre-2020 enrollment caps[1]Leisure DB, “State of the UK Swimming Industry Report 2023,” leisuredb.com. Senior demographics favor aqua-aerobics and hydrotherapy, paying session fees 35% above standard gym classes. Corporate wellness contracts increasingly stipulate aquatic access, leaving employers to absorb memberships as part of healthcare cost-containment strategies. Clubs retrofit adjustable floors and resistance-wave machines to serve diverse class types without adding square footage. Subscription bundles that merge pool and group-exercise access exhibit 20% lower churn than gym-only plans. Finally, digital wearables integrate lap counts and heart-rate data into club apps, boosting member engagement and providing operators with retention analytics.
Franchised Swim Schools Grow International Footprints
Franchise swim schools capitalize on standardized curricula and proven unit economics, attracting multi-unit investors who deploy USD 150,000–300,000 per site. Brands such as Aqua-Tots surpass 5 million lessons annually across 14 nations, leveraging centralized marketing engines that cut customer-acquisition costs by half relative to independent schools[2]Aqua Magazine, "America's Swimming Pool Company Opens Six New Locations," aquamagazine.com. Royalty streams linked to lesson revenues furnish predictable cash flows that meet private-equity hurdle rates, fueling additional area development agreements in India, Mexico, and the Middle East. Curriculum consistency secures insurance approvals at favorable rates, while local hiring frameworks minimize labor volatility. Franchisees benefit from the pooled purchasing of chemicals and equipment. Furthermore, community partnerships with public schools and daycare centers create feeder pipelines that stabilize occupancy across school calendars.
Restraints Impact Analysis
| Restraint | (~) % Impact on CAGR Forecast | Geographic Relevance | Impact Timeline | |||
|---|---|---|---|---|---|---|
High operational costs squeeze
margins
High operational costs squeeze
margins
| -1.1% | Global, most acute in Europe and North America | Short term (≤ 2 years) |
(~) % Impact on CAGR Forecast
:
-1.1%
|
Geographic Relevance
:
Global, most acute in Europe and
North America
|
Impact Timeline
:
Short term (≤ 2 years)
|
Water scarcity regulations limit
operations
Water scarcity regulations limit
operations
| -0.8% | Mediterranean Europe, Western US, Australia | Medium term (2 – 4 years) | |||
Liability insurance premiums keep
rising
Liability insurance premiums keep
rising
| -0.6% | Primarily North America and Europe | Short term (≤ 2 years) | |||
Seasonality restricts utilization in
cold zones
Seasonality restricts utilization in
cold zones
| -0.7% | Northern Europe, Northern US, Canada | Long term (≥ 4 years) | |||
| Source: Mordor Intelligence | ||||||
High Operational Costs Squeeze Margins
Fuel-price shocks have driven annual heating outlays for a standard 25-meter United Kingdom. Pool from GBP 100,000 to GBP 250,000 (USD 125,651 to USD 314,128) since 2022, equal to 65% of total operating expense. Labor shortages compound the pain as qualified lifeguard wages jumped from GBP 15 to GBP 25 (USD 18.84 to USD 31.41) per hour, inflating payroll lines by double digits. Smaller municipal sites respond by shortening hours and concentrating lessons during peak demand to preserve margins, though this compresses accessibility for low-income patrons. Some local authorities transfer management to private concessionaires who leverage centralized purchasing and tech upgrades to restore viability. Debt-service burdens tied to pre-2020 renovation loans become harder to cover, increasing repossession risk. Overall, elevated op-ex erodes free cash flow, slowing renovation cycles and discouraging new entrants with limited capital buffers.
Water Scarcity Regulations Limit Operations
Persistent droughts push regulators to impose strict water-use caps, including Andalusia’s temporary bans on pool refills during 2024 water emergencies[3]Swimming Pool News. "Lonza acquisition of Arch brand completed," swimmingpoolnews.co.uk. Las Vegas enforces a 600-square-foot size limit on new residential pools, while California’s Model Water Efficient Landscape Ordinance requires closed-loop filtration to secure construction permits. Compliance mandates investment in regenerative media filters and on-site recycling tanks that recover up to a huge percent of backwash discharge. Hotels offset costs by integrating desalination or grey-water reuse, allowing regulators to grant exemptions that safeguard tourism revenue. Smaller operators with limited financing options postpone expansion plans, slowing market growth in arid regions. Suppliers of membrane filtration and UV-Ozone sanitation benefit from regulatory pressure, yet overall project pipelines remain vulnerable to prolonged drought declarations.
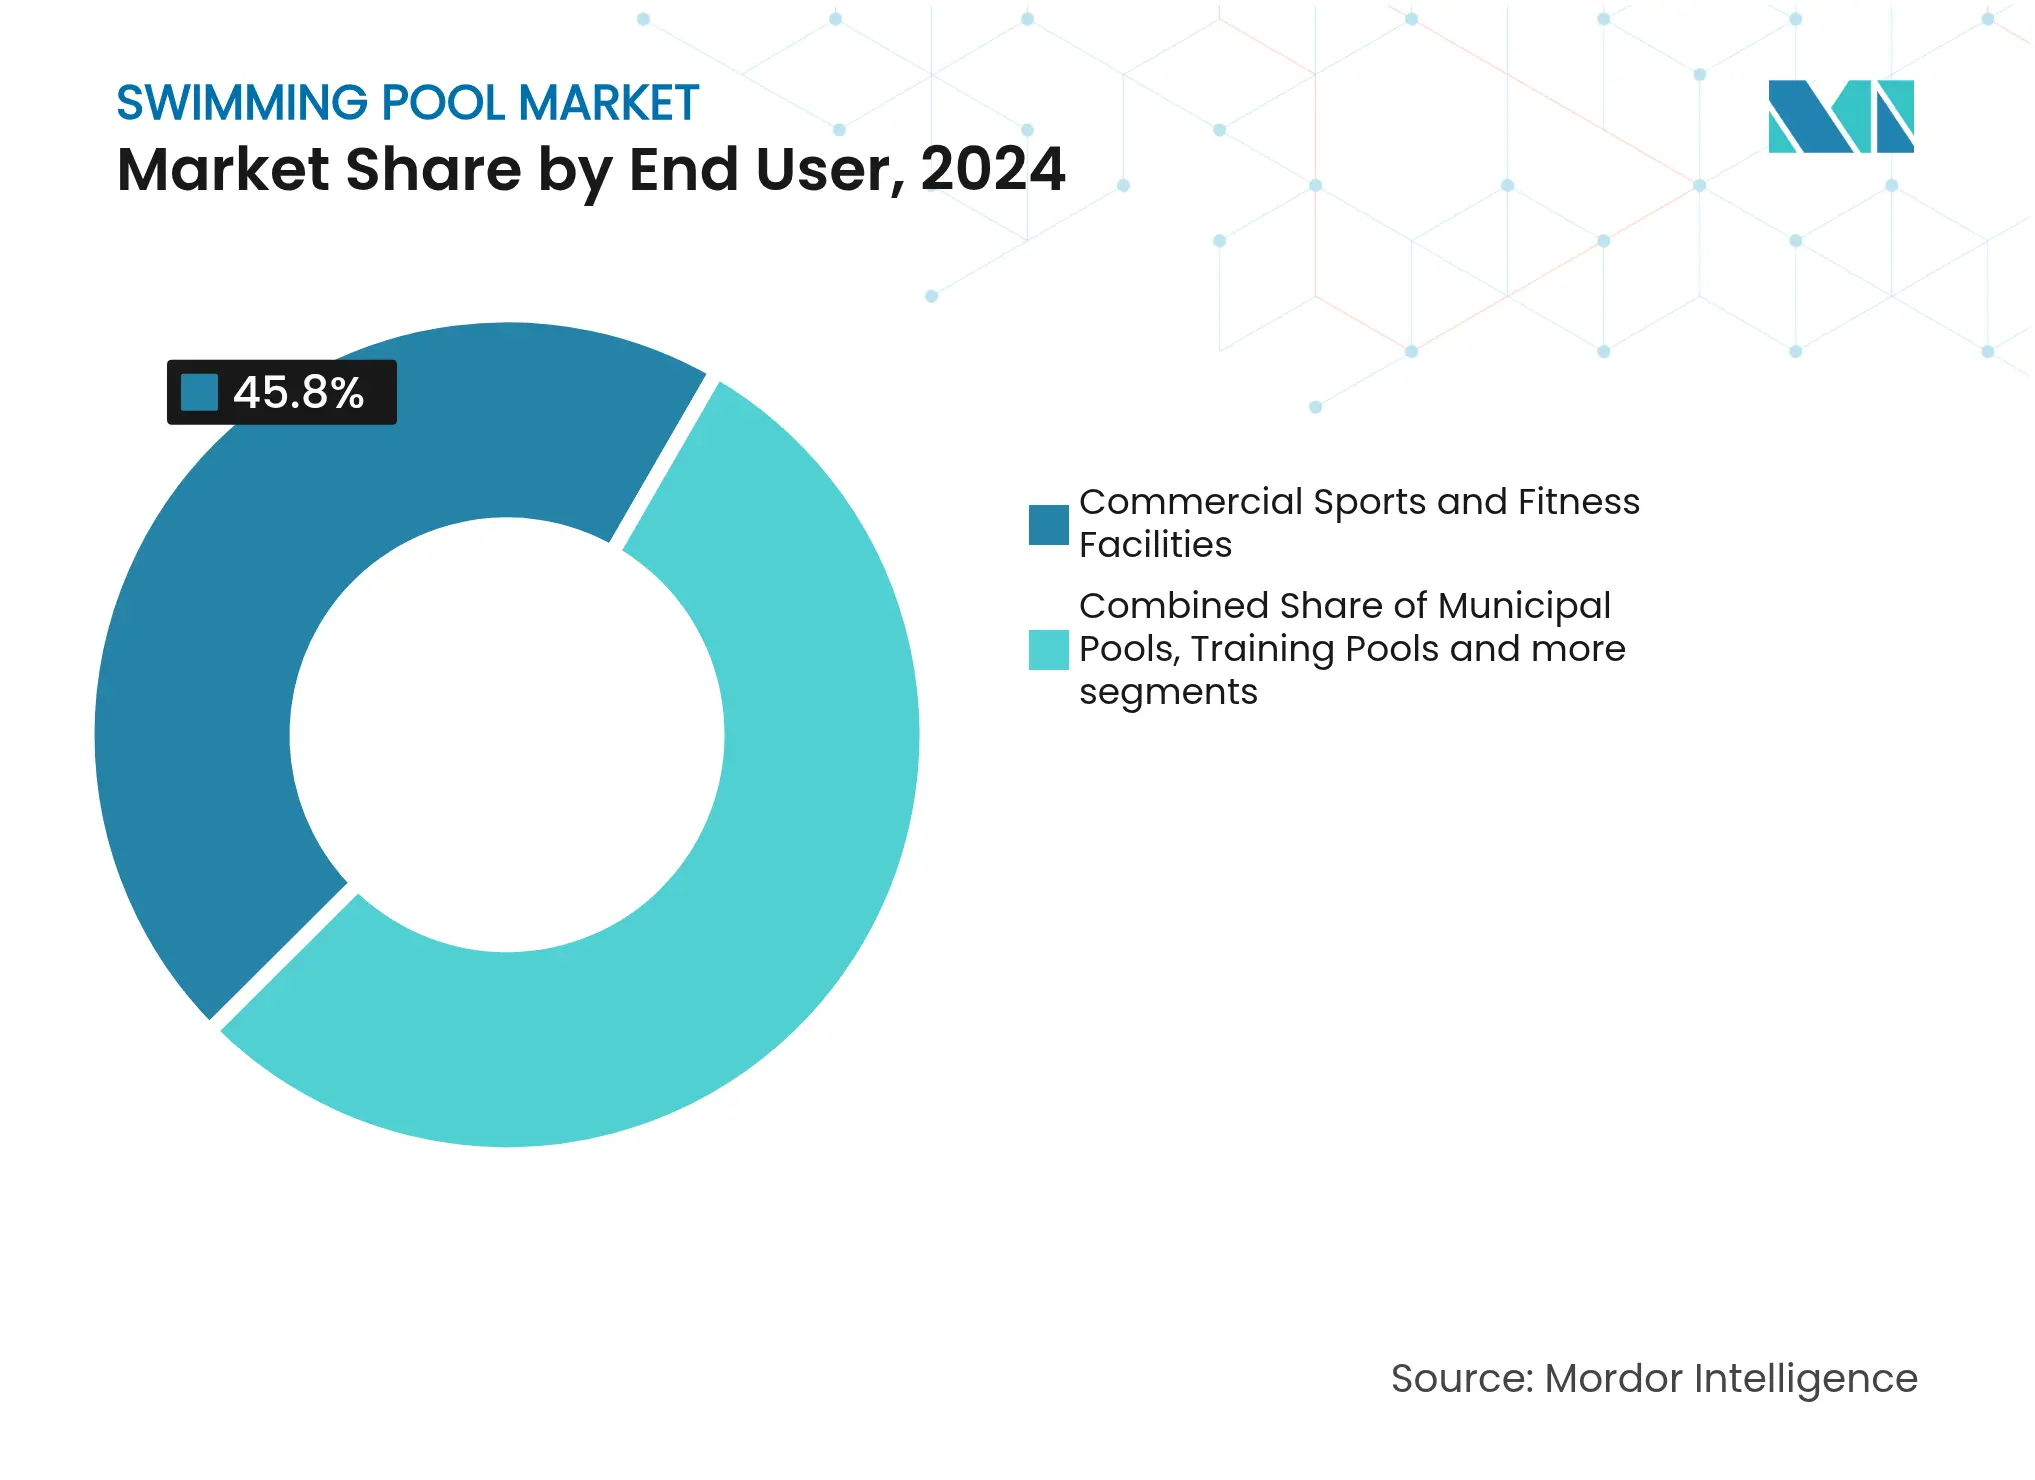
By End User: Fitness Facilities Dominate Market Leadership
Commercial sports and fitness facilities command 45.81% market share in 2024 while simultaneously achieving the fastest growth at 6.50% CAGR through 2030, demonstrating the sector's dual dominance in both scale and momentum. This unprecedented combination reflects the wellness economy's transformation of traditional fitness centers into comprehensive health destinations where pools serve therapeutic, training, and social functions that extend far beyond recreational swimming. Fitness operators capitalize on membership retention benefits, corporate wellness contracts, and premium programming that generates higher per-session revenues than conventional lap swimming, while aquatic therapy and senior fitness classes command premium pricing in aging demographics.
Competition and high-performance training pools represent specialized markets where facility specifications command premium pricing and attract dedicated user communities, benefiting from sports tourism trends and elite athlete training demands that justify advanced filtration systems and competition-standard dimensions.Public and municipal pools face persistent budget constraints and aging infrastructure challenges, driving partnerships with private operators who provide capital investment and operational expertise while preserving public access through hybrid revenue models.
Note: Segment shares of all individual segments available upon report purchase
By Revenue Source: Membership Stability Meets Event Premiums
Membership and subscription fees delivered 53.3% of the swimming pool market size in 2024, anchoring predictable cash flows for both private and public operators. Annual family packages, multi-club passes, and off-peak discounts diversify intake and smooth monthly swings. Operators integrate mobile apps enabling auto-renewal and attendance tracking, increasing retention by 10 percentage points over manual processes. Data analytics inform class scheduling and upsell prompts that elevate average revenue per user. Event and competition rentals outpace at 6.91% CAGR, leveraging pools’ aesthetic and functional flexibility. Corporate hosts value turnkey services—lighting, sound, and branded backdrops—while sports tournaments fill weekday daytime slots otherwise under-utilized by recreational swimmers. Ticketed pay-per-entry formats cater to casual users and tourists but remain vulnerable to weather swings and economic downturns. The “others” category—comprising coaching, food service, and wellness treatments—provides margin-rich upsides when bundled smartly with base memberships, encouraging operators to extend dwell time through on-site cafés and co-located physiotherapy rooms.
Real-time dynamic pricing, guided by occupancy sensors, nudges visitors into shoulder hours, enhancing facility utilization and dropping perceived crowding. Integrated payment kiosks reduce queuing, improving guest satisfaction scores and freeing staff for revenue-generating interactions. Pool operators also partner with swimwear and equipment brands to open pop-up retail corners, capturing impulse purchases from membership cohorts. Advertising screens near turnstiles sell space to local businesses, creating micro-revenue streams that, while modest individually, compound across large-footfall venues. Collectively, these layered income channels illustrate the sector’s pivot from single-ticket dependence toward diversified monetization and higher resilience.
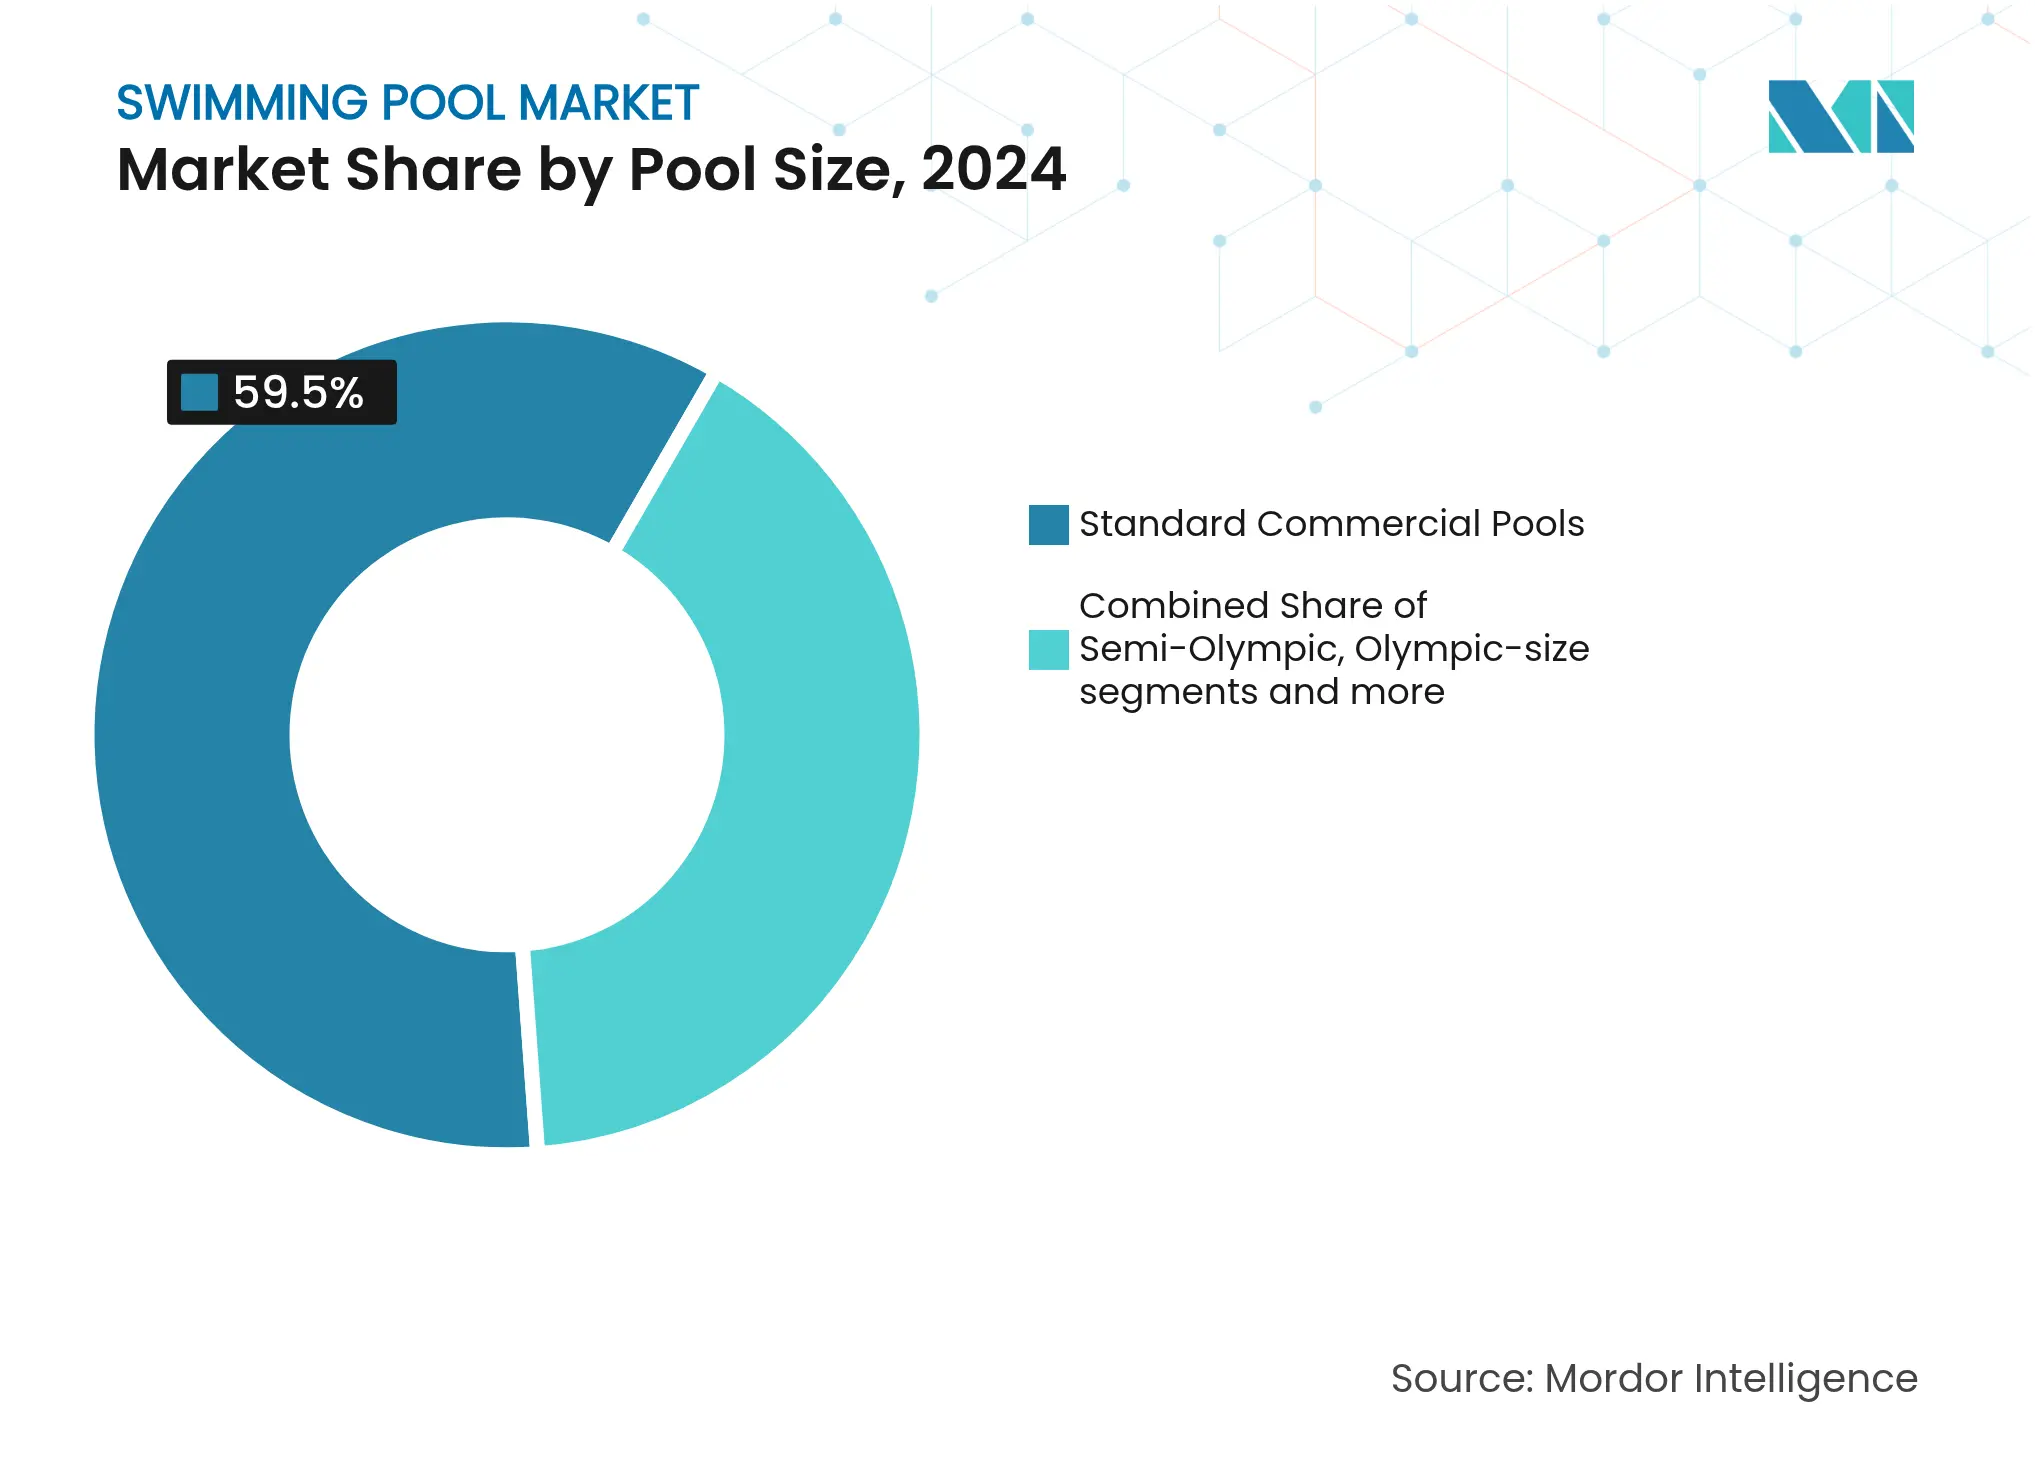
By Pool Size: Standard Pools Lead, Specialty Designs Differentiate
Standard commercial pools made up 59.5% of the swimming pool market in 2024, prized for straightforward maintenance and compatibility with group lessons and lap scheduling. Rectangular 25-meter configurations align with regulatory standards, simplifying plan reviews and funding approvals. Replacement cycles focus on mechanical upgrades, variable-speed pumps, and LED lighting—rather than structural redesigns, shortening downtime and capital requirements. Semi-Olympic and Olympic pools cater to clubs and universities that demand competition compliance, drawing grant funding and sponsorships. These larger basins offer flexible partitioning, allowing operators to host simultaneous events and community lessons.
Specialty and theme-based pools grow at 5.91% CAGR, reflecting travelers' appetite for Instagram-friendly experiences and wellness immersion. Infinity edges merging with ocean horizons and rooftop glass cantilevers create iconic imagery that drives marketing cut-through. California’s 2025 flexible-demand standard accelerates smart control adoption across all pool sizes, compelling operators to retrofit automation that synchronizes filtration, lighting, and chemical dosing. Suppliers bundle controllers with analytics dashboards, offering small facilities subscription financing to bypass upfront capex. Industry adoption of prefabricated stainless-steel shells speeds installation, reducing disruption to adjacent hotel operations and enabling phased expansions aligned with occupancy trends.
Note: Segment shares of all individual segments available upon report purchase
North America anchored 33.6% of global revenues in 2024 as entrenched pool culture, high single-family home ownership, and well-developed distribution networks undergird sales. Yet the region’s growth is tilting from new installations to renovation, energy retrofits, and connected-device upgrades. Florida and Arizona logged double-digit residential builds, whereas drought-afflicted California saw permitting delays offset by strong demand for variable-speed pumps mandated statewide from 2025. Pool Corporation’s 434 sales centers underscore scale advantages, although the distributor’s 10.7% sales dip in 2023 highlighted sensitivity to mortgage rates and macro sentiment. Overall, replacement cycles rather than green-field construction will define North American growth vectors within the swimming pool market.
Asia-Pacific represents the fastest-growing territory at 6.15% CAGR, driven by expanding middle classes, rapid urbanization, and government tourism pushes in Thailand, Vietnam, and India. Chinese robotics maker Aiper secured USD 137 million to expand production, signaling investors’ confidence in regional pool ownership gains. Australia remains an outlier with the world’s highest pool density per capita, reinforcing aftermarket volumes for heating, covers, and mineral sanitation systems. In emerging ASEAN markets, aspirational buyers gravitate toward above-ground and fiberglass solutions that mitigate land scarcity and cost barriers. Consequently, manufacturers leveraging localized production and flexible financing capture a disproportionate share in this leg of the swimming pool market.
Europe blends mature penetration with regulatory leadership on sustainability. The EU’s Energy-Performance-of-Buildings directive obliges member states to tighten efficiency standards, steering public funds toward renovation and heat-pump adoption. Fluidra’s solid margin expansion amid temperate summer weather illustrates how portfolio diversification and efficiency programs buffer climatic volatility. Mediterranean resorts continue to upgrade outdoor lagoons, while Northern Europe channels wellness budgets into indoor hydrotherapy facilities. As water tariffs rise, Northern utilities now subsidize cover installations, accelerating payback periods and stimulating smart-device adoption in the swimming pool market.
Market Concentration
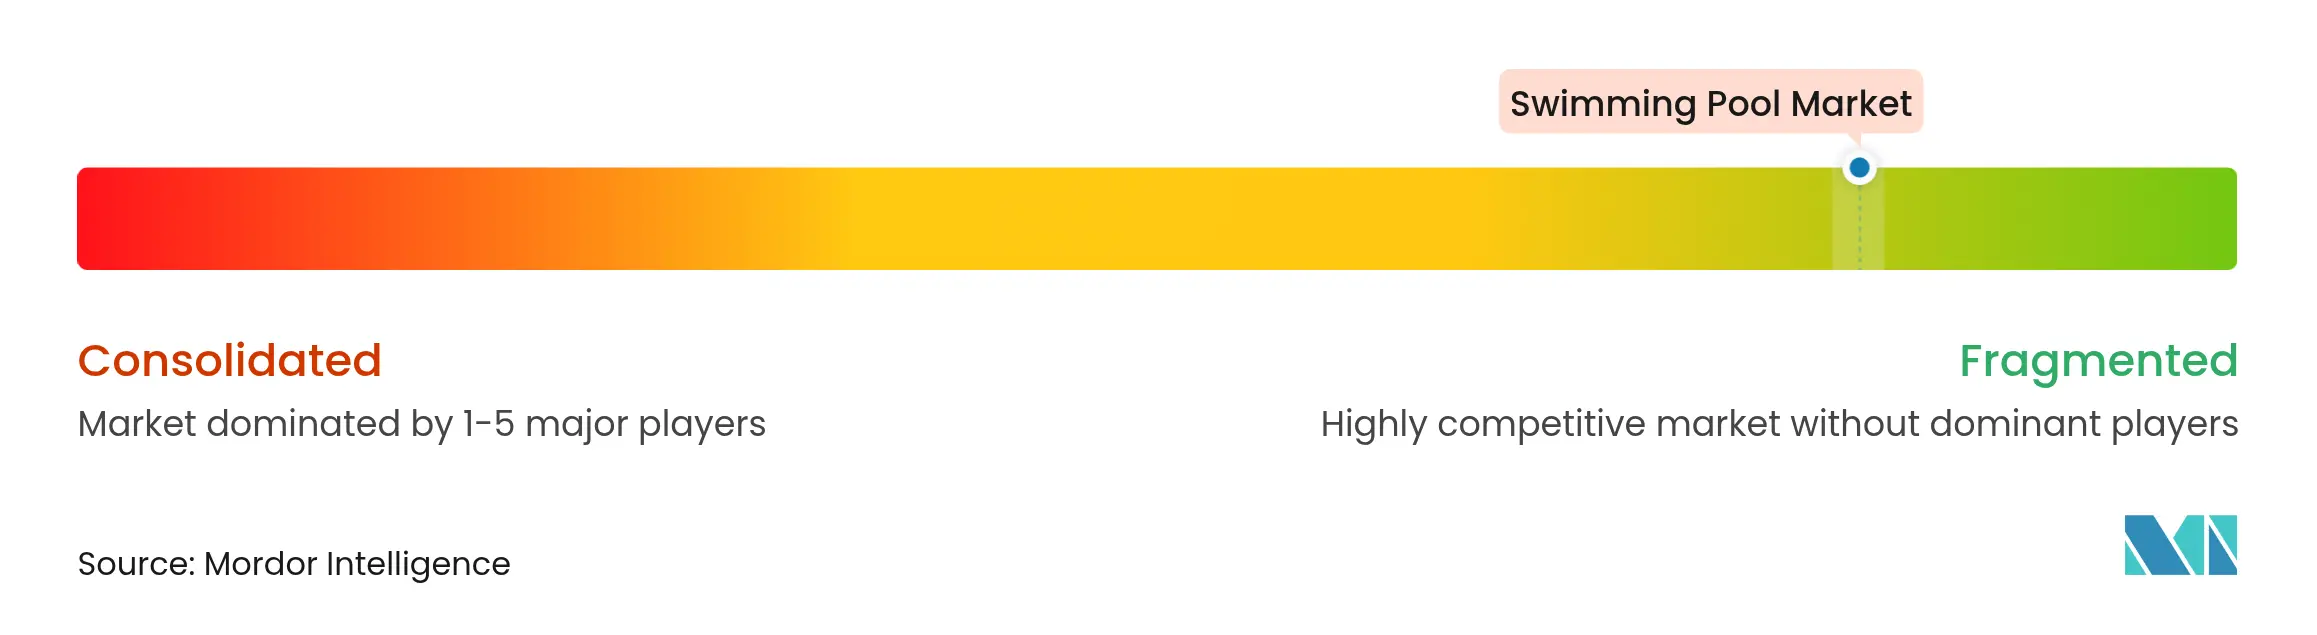
The swimming pool market balances equipment manufacturers with thousands of local service firms, creating moderate fragmentation tempered by accelerating consolidation. Top equipment suppliers such as Fluidra and Pentair control just under half of global pump, filter, and heater sales, benefiting from extensive distributor networks and R&D pipelines focused on sensor-embedded devices. Mid-tier manufacturers differentiate via specialized applications, wave generators, movable floors, and ozone-UV sanitation, capturing niche share while often licensing patents from larger rivals. Technology firms enter the space by offering IoT controllers that integrate seamlessly with property-management systems, shifting competition from hardware margins to recurring software subscriptions.
Service and maintenance constitute a heavily localized segment where scale players execute roll-up strategies. Companies like Pool Troopers and SPS PoolCare acquire mom-and-pop operators, unifying marketing, procurement, and scheduling under centralized CRMs that raise technician utilization from 65% to 80%. Franchise platforms provide brand equity and training standards, enabling single-territory owners to secure commercial contracts historically reserved for legacy incumbents. Private-equity investors funnel capital into these roll-ups, attracted by predictable route income, low capex intensity, and cross-sell potential for chemical deliveries, minor repairs, and equipment upgrades. Barriers to entry remain moderate, but regulatory compliance around chemical handling and insurance requirements privileges operators able to standardize safety protocols across regions.
Innovation intensity shapes competitive hierarchies. Patent filings tracked by WikiPatents show Pentair targeting solar harvesting, winterization automation, and secure cloud connectivity, underscoring a pivot toward integrated ecosystems that lock in aftermarket parts demand. Suppliers bundle equipment with financing and performance guarantees, easing client capex constraints and securing multi-year maintenance contracts. In emerging markets, partnerships between global manufacturers and local installers bridge skill gaps, while government-driven hotel pipelines create opportunities for turnkey providers able to deliver design-build-operate solutions. Overall, competitive advantage tilts toward firms aligning hardware, software, and service to deliver measurable cost savings and regulatory compliance to facility owners.

*Disclaimer: Major Players sorted in no particular order
1. Introduction
2. Research Methodology
3. Executive Summary
4. Market Landscape
5. Market Size & Growth Forecasts
6. Competitive Landscape
7. Market Opportunities & Future Outlook
A complete background analysis of the Global Swimming Pool Market, which includes an assessment of the national accounts, economy, and emerging market trends by segments, significant changes in the market dynamics, and market overview is covered in the report.
A Leading Sanitaryware Company’s Journey in Saudi Arabia
4 Min Read
Strategic Expansion in the Russia Laundry Appliances Market
3 Min Read
Unlocking Saudi Arabia’s Regional Tourism Growth Potential
5 Min Read
When decisions matter, industry leaders turn to our analysts. Let’s talk.