
Steel Sections Market Size and Share
Market Overview
| Study Period | 2020 - 2031 |
|---|---|
| Market Size (2026) | USD 384.95 Billion |
| Market Size (2031) | USD 479.26 Billion |
| Growth Rate (2026 - 2031) | 4.48 % |
| Fastest Growing Market | Asia-Pacific |
| Largest Market | Asia-Pacific |
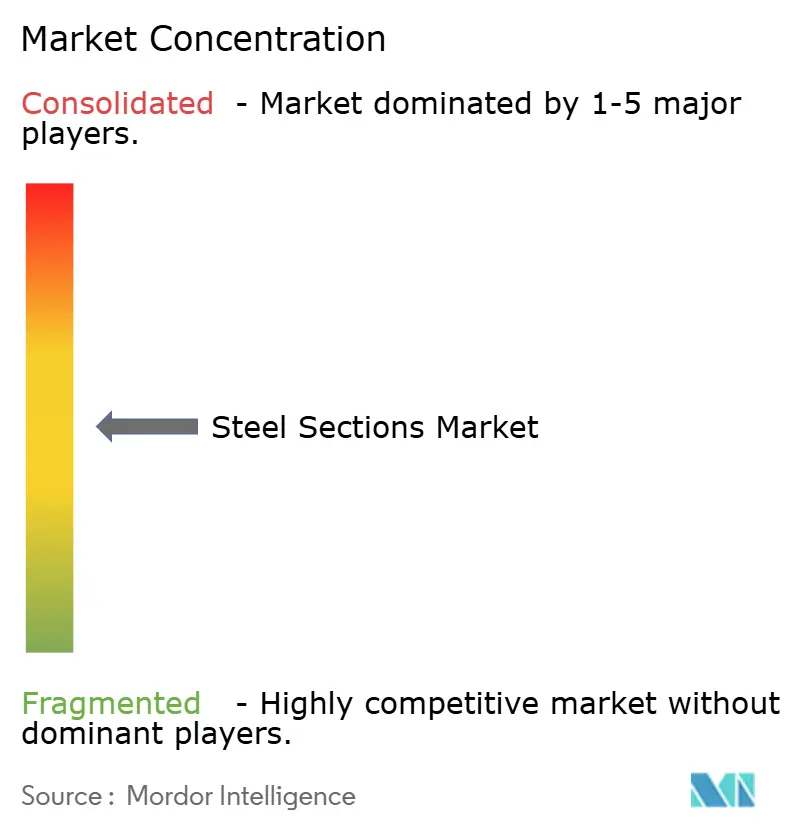
| Market Concentration | Medium |
Major Players *Disclaimer: Major Players sorted in no particular order Image © Mordor Intelligence. Reuse requires attribution under CC BY 4.0. | |
Steel Sections Market Analysis by Mordor Intelligence
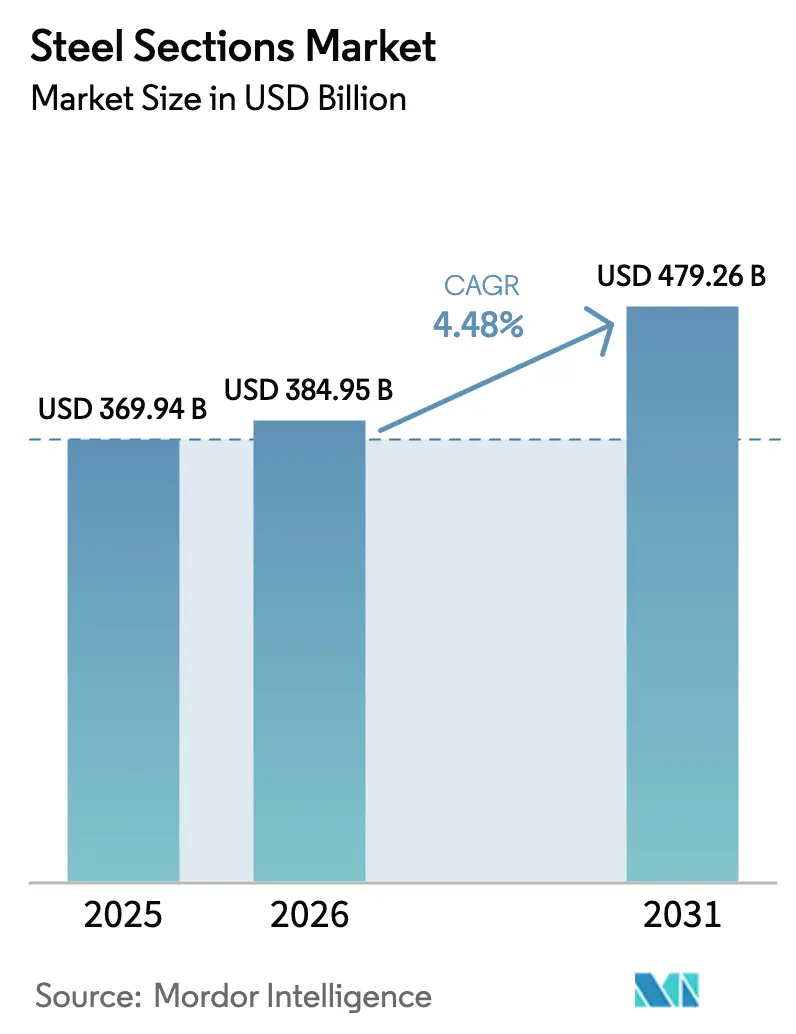
The Steel Sections Market size was valued at USD 369.94 billion in 2025 and is estimated to grow from USD 384.95 billion in 2026 to reach USD 479.26 billion by 2031, at a CAGR of 4.48% during the forecast period (2026-2031).
Robust public-works pipelines in Asia-Pacific, a widening preference for modular buildings, and rising demand for low-carbon grades are sustaining this trajectory. Governments in China, India, and Saudi Arabia continue to lock in multi-year procurement contracts that smooth mill utilization, while automotive and aerospace original-equipment makers specify high-strength profiles to lighten platforms without sacrificing crash energy absorption. Parallel decarbonization mandates in the European Union and the United Kingdom are amplifying the price premium for low-emission steel sections, nudging producers toward electric-arc furnaces and hydrogen-based direct-reduction. At the same time, digital design tools such as Building Information Modeling (BIM) and digital twins are reducing onsite waste and reinforcing steel’s competitiveness against substitute materials. Raw-material volatility and skilled-labor shortages will temper margins but are unlikely to derail the medium-term growth outlook.
Key Report Takeaways
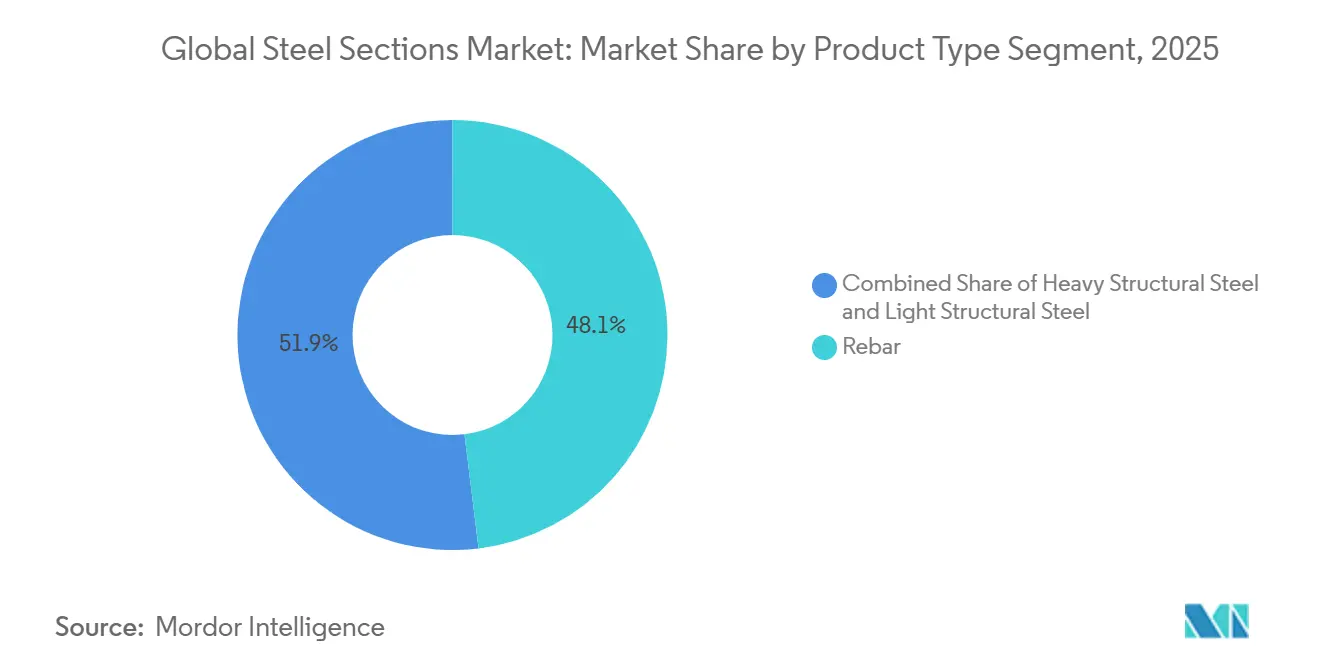
- Rebar led with a 48.07% steel sections market share in 2025, while heavy structural steel is forecast to expand at a 5.36% CAGR through 2031.
- Construction accounted for 34.41% of 2025 end-user revenue; aerospace and automotive applications are projected to exhibit the fastest growth at 5.37% CAGR to 2031.
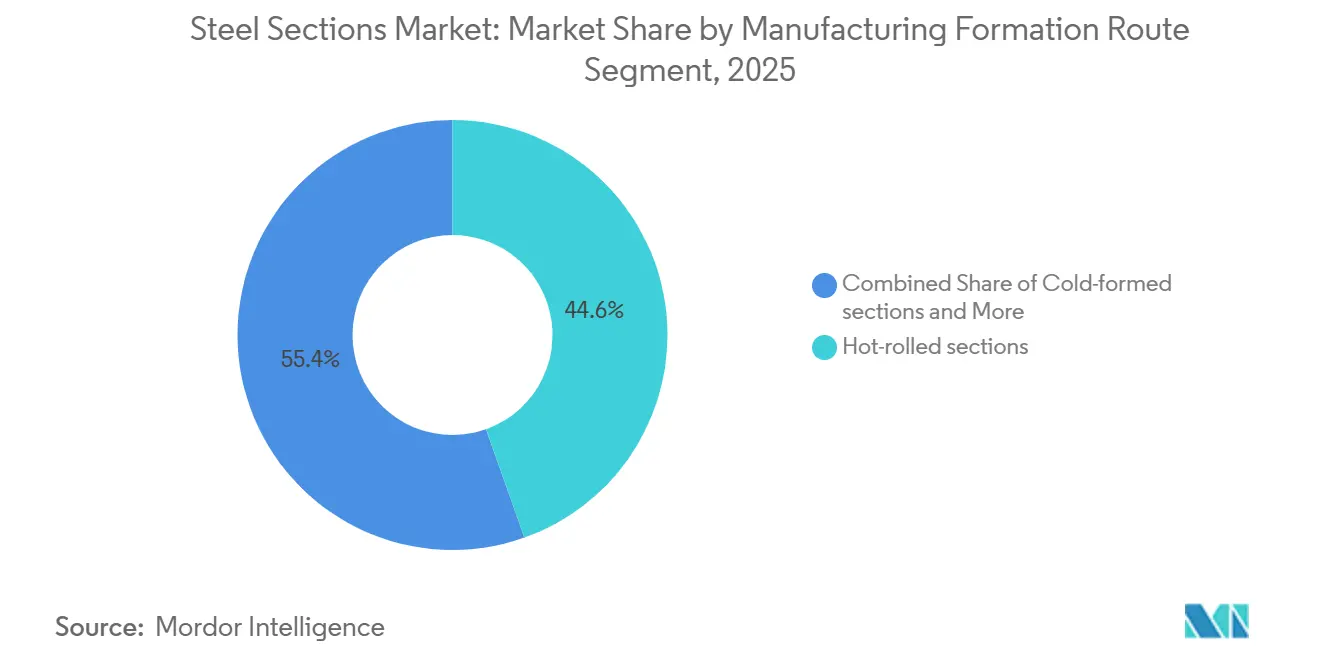
- Hot-rolled sections captured 44.56% of 2025 volume, whereas cold-formed alternatives are poised to rise at a 6.25% CAGR during the outlook period.
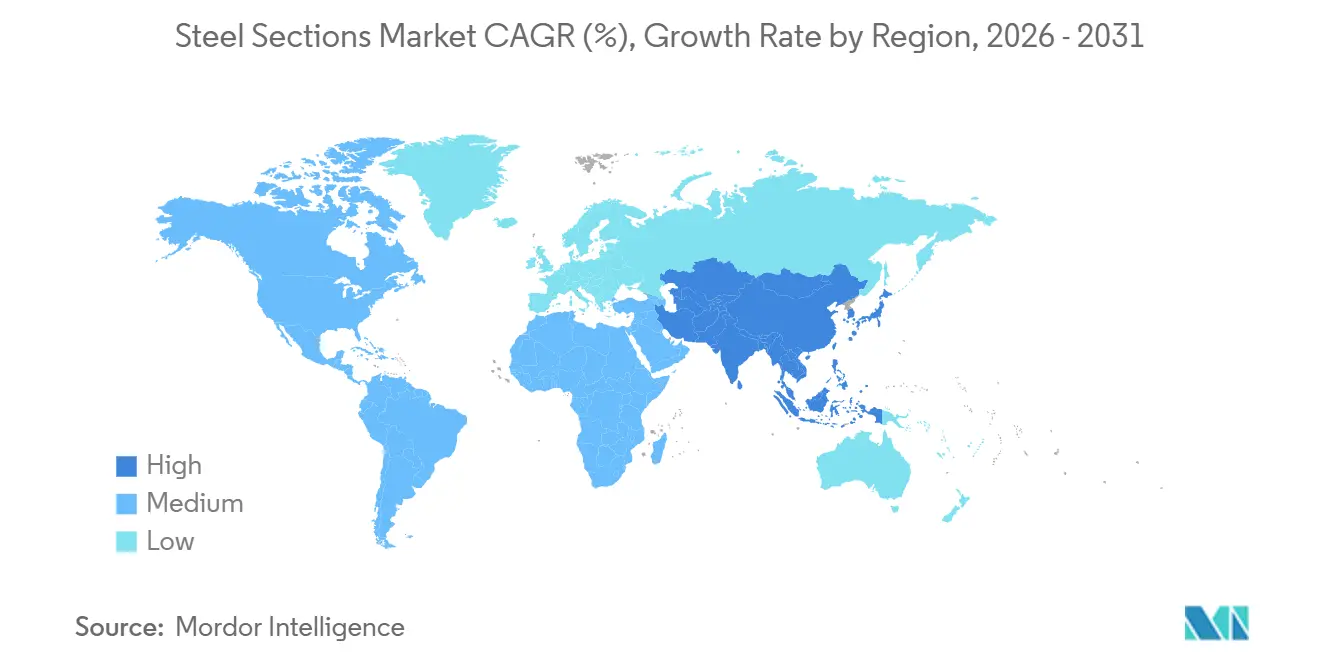
- Asia-Pacific commanded 70.22% of global demand in 2025, but the Middle East and Africa region is on track for the fastest expansion at 6.45% CAGR to 2031.
Note: Market size and forecast figures in this report are generated using Mordor Intelligence’s proprietary estimation framework, updated with the latest available data and insights as of January 2026.
Global Steel Sections Market Trends and Insights
Drivers Impact Analysis*
| Drivers | (~) % IMPACT ON CAGR FORECAST | Geographic Relevance | Impact Timeline |
|---|---|---|---|
| Infrastructure mega-projects in Asia and Middle East & North Africa | +1.2% | Asia-Pacific, Middle East & Africa | Medium term (2-4 years) |
| Modular and off-site construction adoption | +0.8% | Global | Medium term (2-4 years) |
| Decarbonization premium for low-carbon sections | +0.7% | Europe, North America, export-oriented Asia | Long term (≥ 4 years) |
| Tightening seismic codes driving section upgrades | +0.6% | Asia-Pacific, North America, Latin America | Long term (≥ 4 years) |
| Digital design minimizing waste | +0.5% | Global | Medium term (2-4 years) |
| Advanced HSLA and weather-resistant steels | +0.4% | Global | Long term (≥ 4 years) |
| Source: Mordor Intelligence | |||


Infrastructure Mega-Projects Reshape Regional Demand Profiles
Asia-Pacific and Middle East programs are locking in long-duration supply contracts that stabilize mill output. India’s National Infrastructure Pipeline sets aside USD 1.4 trillion for transport, energy, and urban projects through 2025, absorbing over 200,000 tonnes of structural sections every year[1]World Bank, “World Bank Infrastructure Monitor 2024,” worldbank.org. Saudi Arabia’s Vision 2030 pledges USD 500 billion to NEOM and related ventures, translating to a cumulative requirement exceeding 10 million tonnes of structural sections over the decade. Sub-Saharan investments, such as Mauritania’s new iron-ore rail link, further diversify demand and encourage mills to align product mix with project specifications. Producers benefit from predictable offtake volumes, allowing more favorable raw-material contracts and reducing exposure to spot-price swings. This driver sustains the steel sections market by underpinning baseline consumption even when private construction cycles soften.
Modular Construction Accelerates Cold-Formed Adoption
Off-site fabrication trims build schedules by 30%–40% and reduces site labor, driving preference for lightweight cold-formed profiles. In the United Kingdom, residential starts using modular techniques rose to 7% in 2024 from 3% in 2020, bolstered by a 15% capital-cost subsidy for projects exceeding 50% off-site content. Weight savings of 30%–40% curb foundation loads and crane requirements, while nested framing systems sidestep transport width limits. Japan’s revised fire-resistance rules now permit cold-formed sections in 10-story buildings, expanding the addressable market by roughly 40%. As supply chains mature, cost parity with hot-rolled beams is expected in many medium-rise applications, providing a clear growth corridor for the steel sections market.
Decarbonization Premiums Reward Low-Carbon Producers
Green-procurement policies in Europe and North America attach clear premiums, USD 50–150 per tonne, for steel sections with embedded carbon below defined thresholds. The European Union’s Carbon Border Adjustment Mechanism will extend full tariffs by 2026, mirroring EU ETS carbon pricing and increasing landed costs for high-emission imports by up to USD 108 per tonne. ArcelorMittal and POSCO have each committed multibillion-dollar retrofits or pilot lines to capture this premium. Early movers secure lucrative supply agreements with automakers and infrastructure developers pursuing scope-3 emissions cuts, reinforcing a virtuous cycle that channels capital toward low-carbon capacity and expands the addressable steel sections market.
Tightening seismic codes driving section upgrades
Earthquake-prone jurisdictions are strengthening structural regulations, forcing developers to specify premium steel sections with higher yield strength and toughness. Japan’s 2024 amendment to the Building Standard Law mandates yield strengths above 400 MPa and Charpy impact toughness of 27 joules at −20 °C, accelerating the replacement of lower-grade profiles. In California, the introduction of special moment-resisting frames for buildings over 50 m has increased steel section intensity by up to 20% per project. Similar regulatory upgrades in Indonesia, Chile, and Mexico have created a bifurcated market, where premium sections command price uplifts of 10–15%. Producers that have invested early in thermo-mechanical control processing (TMCP) technologies are capturing first-mover advantages. Over time, continued code harmonization is expected to embed higher-specification sections as a structurally resilient and recurring revenue stream for the global steel sections market.
Restraints Impact Analysis*
| Restraints | (~) % IMPACT ON CAGR FORECAST | Geographic Relevance | Impact Timeline |
|---|---|---|---|
| Volatile iron-ore and scrap prices | -0.5% | Global | Short term (≤ 2 years) |
| Rising trade-remedy barriers | -0.4% | Global | Medium term (2-4 years) |
| Carbon-intensity penalties (CBAM-type mechanisms) | -0.3% | Europe, North America, Asia exporters | Long term (≥ 4 years) |
| Skilled welder and fabricator shortages | -0.3% | Global | Medium term (2-4 years) |
| Source: Mordor Intelligence | |||
Raw-Material Price Volatility Compresses Margins
Iron ore and coking coal prices swung 20%–25% intra-year in 2024 as weather disruptions and Chinese production quotas reshaped seaborne flows. Scrap-dependent electric-arc furnaces faced an 18% jump in European scrap prices after Turkey restricted exports. Although new futures contracts on the London Metal Exchange offer hedging, low liquidity limits accessibility for mid-tier mills. Tight working capital forces smaller producers to throttle output, further tightening supply and perpetuating volatility, thereby tempering growth prospects for the steel sections market.
Trade-Remedy Measures Fragment Global Supply Chains
Forty-seven new anti-dumping or safeguard orders hit steel products in 2024, the most since 2016[2]OECD, “OECD Steel Market Developments Q4 2024,” oecd-ilibrary.org. U.S. Section 232 tariffs kept domestic coil prices 12% above global averages. India extended safeguard duties of up to 15% on selected sections through 2026. Multinational mills must now operate redundant capacities in multiple jurisdictions, inflating fixed costs and eroding the economies of scale that once underpinned the steel sections market.
*Our forecasts treat driver/restraint impacts as directional, not additive. The impact forecasts reflect baseline growth, mix effects, and variable interactions.
Segment Analysis
By Product Type: Rebar Dominates Yet Heavy Structural Steel Gains Momentum
Rebar captured 48.07% of the steel sections market revenue in 2025, reflecting its entrenched role in reinforced concrete for residential towers, bridges, and transit projects[3]EUROFER, “Economic and Steel Market Outlook 2024-2025,” eurofer.eu. The segment benefits from synchronized public works outlays in Asia-Pacific and Africa, where urbanization continues to set new records. High-volume contracts, such as India’s metro expansions, guarantee steady mill loading and encourage investment in micro-alloyed bar to meet stringent seismic requirements. However, growth moderates when private housing cycles cool, as witnessed in Europe’s 2024 downturn. To differentiate, producers now bundle rebar with digital tracking tags that confirm heat numbers and mechanical properties, reducing counterfeit risk on large job sites.
Heavy structural steel, though holding a smaller base, is set to record a 5.36% CAGR to 2031, the fastest in this category. Demand stems from aerospace and automotive platforms shifting toward advanced high-strength profiles to offset battery mass. Thermo-mechanical control processing lets mills deliver yield strengths above 700 MPa without downstream heat treatment, slashing energy use by 15%. Hollow sections for wind-turbine towers and transmission pylons also ride the renewable-energy build-out. Collectively, these trends secure a robust outlook for the steel sections market.


By End-User Industry: Construction Leads as Aerospace and Automotive Accelerate
Construction accounted for 34.41% of 2025 demand, cementing its position as the largest consumer of steel sections market volume. Asian megacities add high-rise apartment blocks and mass-transit corridors, while the United States embarks on bridge rehabilitation financed by the Infrastructure Investment and Jobs Act. Contractors favor hot-rolled beams for speed of erection and compatibility with digital-twin project controls. In Europe, a 3.5% contraction in 2024 permits trigger inventory run-downs but does not alter the structural need for seismic retrofits or energy-efficient façades that still rely on rebar and cold-formed profiles.
Aerospace and automotive applications will expand at a 5.37% CAGR, the quickest among end users. Battery-electric vehicles require lightweight crash-management structures, prompting OEMs to specify closed-section profiles exceeding 1,000 MPa. Aircraft producers adopt titanium-steel hybrids for fuselage frames, yet still rely on ultra-high-strength steel for landing-gear fittings. As electric-vehicle penetration reaches 50% of global sales by 2030, high-strength sections’ share in the steel sections market will widen correspondingly.
By Manufacturing / Formation Route: Hot-Rolled Remains Core as Cold-Formed Surges
Hot-rolled sections accounted for 44.56% of the 2025 volume, underscoring their versatility in heavy-duty applications such as bridges and offshore structures. High finishing temperatures ensure ductility and uniform microstructure across thick webs and flanges, essential for cyclic loading in seismic zones. Producers are layering digital sensors onto finishing lines, cutting scrap by 3 percentage points, and enhancing yield as raw-material prices stay volatile.
Cold-formed alternatives will register the fastest growth at 6.25% CAGR through 2031 as modular construction gains share. Roll-forming at ambient temperature produces lighter profiles with tighter dimensional tolerances, ideal for wall studs, purlins, and modular frames. Yet thickness limits of roughly 6 mm confine use to low- to mid-rise buildings. Hybrid solutions, combining hot-rolled cores with cold-formed cladding, are emerging for taller modules, opening fresh pathways for the steel sections market.
Geography Analysis
Asia-Pacific generated 70.22% of the steel sections market revenue in 2025, powered by China’s Belt and Road extensions, India’s USD 1.4 trillion National Infrastructure Pipeline, and Southeast Asian metro builds. Even as China’s real-estate deleveraging cut rebar demand by 12 million tonnes in 2024, high-speed rail and renewable projects partially offset the decline, demonstrating the region’s diversified pull. Japan and South Korea push metallurgical frontiers, exporting quenching and self-tempering know-how to partners in Vietnam and Indonesia. Rapid urban growth means that Asia-Pacific will remain the anchor for the steel sections market through 2031.
The Middle East and Africa will post the fastest regional CAGR at 6.45%, lifted by Saudi Arabia’s USD 500 billion Vision 2030 projects and Gulf cross-border rail corridors[4]Vision 2030, “Official Vision 2030 Website,” vision2030.gov.sa. African governments pursue port and logistics networks to move mineral exports efficiently, illustrated by Mauritania’s 42 km iron-ore railway. Limited domestic capacity keeps the region reliant on imports, creating opportunities for Asian and European mills to establish joint ventures or service centers that deepen market penetration.
Europe and North America trace divergent paths. Tight monetary policy squeezed European residential starts, pushing regional consumption down 3.5% in 2024. CBAM-related uncertainty encourages early adoption of low-carbon grades, supporting price resilience despite weaker volumes. North America recorded a 2.1% uptick in non-residential construction, led by data-center and manufacturing plant investments eligible for green tax credits. Latin America’s rebound adds incremental tons, although currency swings and political risk temper long-range forecasts. Collectively, these dynamics sustain a geographically diversified steel sections market while reinforcing Asia’s leadership.

Regulatory Landscape
Steel sections trade and carbon compliance rules are tightening across major consuming regions, increasing documentation and cost-of-entry requirements for exporters. In the European Union, Regulation (EU) 2026/1384 takes effect on 1 July 2026 and updates the safeguard architecture through revised tariff-rate quotas and a melt-and-pour provision, which raises the value of origin traceability for long products and structural sections entering the EU.
Decarbonization-linked policy signals are also sharpening. China’s NDRC lowered the allowable CO2 emissions intensity benchmark for crude steel to 1.72 metric tons per tonne in June 2026, while India’s Ministry of Commerce implemented a 12.5% export tax on iron ore and pellets effective 1 July 2026, affecting raw-material flows into domestic steelmaking. In parallel, the OECD Steel Committee has highlighted enhanced import monitoring and circumvention detection in mid-2026, reinforcing a broader trend toward stricter enforcement of trade-remedy and reporting requirements that can influence cross-border steel sections supply.
Value Chain Analysis
The steel sections value chain runs from upstream iron ore, coking coal, and scrap procurement, through primary steelmaking (BF-BOF and EAF routes), semi-finished production (billets, blooms, slabs), and rolling and forming into rebar, hot-rolled shapes, and cold-formed profiles. It then extends into fabrication (cutting, drilling, welding), coating/galvanizing, distribution through service centers, and delivery to construction, industrial, and mobility end users. Integrated producers with captive raw materials and coordinated steelmaking to downstream rolling can retain a structural cost advantage, while the shift toward low-emission sections adds steps around product-level emissions measurement, traceability, and third-party verification.
Buyer demand for shorter lead times, consistent tolerances, and project-ready documentation is also pushing downstream capability depth as a differentiator. For instance, Tata Steel links upstream steelmaking with downstream tube and pipe manufacturing, including higher-integrity line-pipe capabilities, while distribution and value-added processing footprints extend through acquisitions such as Steel Dynamics taking full ownership of New Process Steel (completed December 2025). On the supply side, additions in global iron ore capacity in 2026 keep contracting strategy and inventory discipline front and center for section mills, while participation in sustainability reporting by dozens of companies and associations is standardizing KPIs that increasingly feed into procurement decisions.
Competitive Landscape
The top 10 producers control about 50% of global capacity, placing the steel sections market in a moderate-concentration tier. ArcelorMittal’s USD 1.84 billion carbon-capture retrofit in Belgium and France exemplifies incumbent strategy: extend asset life, cut emissions intensity by 30%, and command a green premium from European buyers. POSCO’s hydrogen-based direct-reduction pilot aims for 1 million tonnes of low-carbon output by 2030, safeguarding access to CBAM-regulated markets.
Vertical integration is gaining traction. Several integrated mills bought scrap-processing firms in 2025 to guarantee feedstock for electric-arc furnaces. Others formed joint ventures with modular-building specialists to capture the cold-formed share. Nippon Steel licenses its quenching technology to Vietnamese partners, spreading process know-how while locking in royalty revenue. Meanwhile, British Steel’s USD 635 million Network Rail supply contract secures base-load volume for its long-product lines.
Digitalization and advanced metallurgy continue to separate leaders from laggards. Mills that embed real-time sensors on rolling lines have shaved scrap rates by 3 points, equating to a USD 15–20 per tonne cost edge at current raw-material prices. Patent filings for next-generation HSLA chemistries grew 12% in 2024, concentrated in Japan and South Korea. Smaller regional producers risk market exit if they cannot access capital for emissions abatement or digital upgrades, hinting at consolidation ahead.
Steel Sections Industry Leaders
Tata Steel
Vallourec
Yuantai Derun Group
Anyang Steel Group
Youfa Steel Pipe Group
- *Disclaimer: Major Players sorted in no particular order

Market Opportunities and Future Outlook
A clearer opportunity is emerging around low-carbon, traceable steel sections that can satisfy tightening buyer expectations and border requirements while still fitting project schedules. EU-facing supply is being reshaped by the July 2026 implementation of Regulation (EU) 2026/1384, including melt-and-pour provisions, which increases the value of transparent supply chains. That, in turn, is pushing mills and service centers to invest in origin traceability and product documentation that can travel with rebar, beams, and hollow sections.
Beyond compliance-led demand, capacity modernization and downstream moves are creating openings in fast-growing construction and infrastructure corridors, particularly across Asia. Tata Steel has outlined major expansion and technology adoption plans, including a reported INR 10,000 crore investment program in Jharkhand through 2028 focused on lower-carbon ironmaking routes (HIsarna and EasyMelting Technology), and it is scaling its Tubes Division alongside infrastructure and industrial build-outs. In energy and offshore infrastructure, demand for line pipe and coated products points to opportunities for higher-specification steelmaking and finishing: Vallourec secured a 26,000-ton seamless carbon steel line-pipe contract for Angola’s Greater PAJ offshore development (announced June 2026), and it also advanced Guyana-related line-pipe awards and coating-capability investments in Brazil (announced May 2026), reinforcing the commercial case for metallurgical differentiation and downstream finishing capacity.
Recent Industry Developments
- July 2026: Vallourec obtains GSCC certification for its decarbonization pathway, highlighting a CASEI reduction to 1.16 tCO2e/ton for hot-rolled steel in 2025. The certification signals progress on low-emission steel and opens premium-market opportunities. It strengthens ESG positioning and may enable access to green procurement segments in regulated markets.
- June 2026: Vallourec was awarded a major contract by Azule Energy for 26,000 tons of seamless carbon steel line pipes for the Greater PAJ offshore development in Angola. The contract underscores subsea line-pipe demand and reinforces Vallourec's tubulars leadership in offshore projects. It monetizes offshore exposure and supports a high-value order book across regions.
- May 2026: Vallourec secured two line pipe contracts from ExxonMobil Guyana Limited for Hammerhead and Longtail projects, plus coating-plant upgrade investment in Serra, Brazil. The deals expand offshore line-pipe and coating capacity and support premium tubulars. The action strengthens Latin America offshore footprint and coating capability upgrades.


Research Methodology Framework and Report Scope
Market Definition and Coverage
For this methodology, the steel sections market covers the sales value of long steel sections used in buildings and industrial structures, across standard shapes and sizes that move through mills, service centers, and fabricators into end use.
Scope exclusions: It does not count downstream fabrication-only services, on-site erection labor, or unrelated flat steel products (such as plates and coils).
Segmentation Overview
- By Product Type
- Heavy Structural Steel
- Light Structural Steel
- Rebar
- By End-user Industry
- Residential Construction
- Manufacturing
- Power & Utilities
- Commercial & Infrastructure Construction
- Oil & Gas
- Others (aerospace, automotive, etc.)
- By Manufacturing / Formation Route
- Hot-rolled sections
- Cold-formed sections
- Others (welded, built up)
- By Geography
- North America
- United States
- Canada
- Mexico
- South America
- Brazil
- Argentina
- Peru
- Rest of South America
- Europe
- United Kingdom
- Germany
- France
- Italy
- Spain
- BENELUX (Belgium, Netherlands, and Luxembourg)
- NORDICS (Denmark, Finland, Iceland, Norway, and Sweden)
- Rest of Europe
- Asia-Pacific
- China
- India
- Japan
- Australia
- South Korea
- ASEAN (Indonesia, Thailand, Philippines, Malaysia, Vietnam)
- Rest of Asia-Pacific
- Middle East and Africa
- Saudi Arabia
- United Arab Emirates
- Qatar
- Kuwait
- Turkey
- Egypt
- South Africa
- Nigeria
- Rest of Middle East and Africa
- North America
Data Sources, Market Sizing, and Validation
Desk Research
Desk work started by aligning the product boundary with how steel sections are reported in public industry statistics, and then mapping demand to construction and manufacturing activity. We typically refer to sources such as World Steel Association datasets, UN Comtrade trade statistics, national statistics offices for construction output and housing starts, and customs or port authorities where trade detail is published.
To ground pricing and cost movements, we also review public inflation series, energy and raw material indicators from agencies such as the World Bank, and technical publications and standards bodies that describe section types and usage. Company annual reports, investor presentations, and reputable press are used to cross-check capacity additions, utilization commentary, and regional shipment direction. In selected places, we also use paid subscriptions for company financials and intelligence, news and financials, an import export shipment-level database, and metals and minerals capacity and pricing context. The desk sources listed here are illustrative, and many other public documents were also used for data collection, validation, and clarification.
Primary Interviews and Surveys
Primary work was used to validate the demand pool, pricing logic, and regional mix for steel sections, since public data can lag and product mapping differs by country. We spoke with a mix of mills, distributors, service centers, fabricators, and large buyers, and inputs were checked across APAC, EMEA, and the Americas so assumptions did not lean on one geography. Where numbers disagreed, follow-up questions were used to confirm what was included (for example, rebar versus structural shapes) and how typical contract pricing behaves over the year.
Distribution of primary research fieldwork respondents
| Company type | Respondent position | Region |
|---|---|---|
| Top tier: 29% | CXOs: 12% | APAC: 47% |
| Mid tier: 57% | Functional/Unit leaders: 34% | EMEA: 32% |
| Smaller Players: 14% | Managers: 54% | Americas: 21% |
Market-Sizing & Forecasting
Sizing begins with a top-down build where production, trade flows, and apparent consumption signals are reconstructed by region, then filtered into steel sections based on the share that goes into structural and reinforcement applications. The totals are corroborated using selective bottom-up approximations, such as rolling up sampled supplier revenues by region and applying observed average selling prices to estimated shipment volumes, and then adjusting the model only when the checks point to a consistent gap.
Key inputs used in the model include construction output and permitting momentum, infrastructure and industrial capex timing, rebar and structural shape demand intensity by end use, import dependency ratios, and section price progression in major regions. Because the market is cyclical and pricing can move quickly, we use scenario analysis supported by a simple multivariate regression layer, where demand drivers (construction and industrial activity) and price indicators are tested together. When bottom-up data is incomplete in smaller countries, we fill gaps using trade proxies and peer-market intensity ratios, and the final numbers are kept traceable to a clear set of steps.
Data Validation & Update Cycle
Validation is done through triangulation across independent signals, then through analyst review before final sign-off. We compare the modeled totals against checks like regional steel production direction, trade balance movements, and visible construction cycles, and we flag anomalies when a country trend breaks the expected link between activity and consumption.
If the variance is material, assumptions are revisited and primary contacts may be re-engaged to confirm product splits, pricing timing, or the impact of policy changes. Reports are refreshed annually, with interim updates when major events shift capacity, trade rules, or the demand outlook. Before delivery, an analyst performs a fresh pass on the newest data releases so clients receive an updated view.
Mordor Intelligence's Global Steel Sections Market Sizing Compared With Other Published Estimates
Published market sizes for steel sections can differ because each publisher draws the line around products and routes differently, and because pricing and currency timing choices can shift the value number. Differences also show up when sources rely more on capacity claims versus realized demand, or when older base years are carried forward without rechecking the latest trade and construction signals.
Trade balances for long steel, regional crude steel direction, and construction output series are used as evidence to keep Mordor Intelligence aligned to an apparent consumption view that separates structural shapes and rebar from adjacent steel categories before value is applied. The spread usually comes down to whether rebar is fully included, how hot-rolled versus other formation routes are treated, and whether average selling prices are updated using contract timing and region mix or assumed as a single global trend.
Benchmark comparison
| Source | Market Size | Gaps in Research Methodology |
|---|---|---|
| Mordor Intelligence | USD 369.94 B (2025) | |
| Industry Association A | USD 352.10 B (2025) | Uses a tighter definition centered on structural shapes and excludes a large share of rebar value, and it applies a conservative price deck that is not re-timed to regional contract cycles. |
| Global Consultancy B | USD 401.80 B (2025) | Bundles fabricated structural components and related services into the sections total, and it inflates value using aggressive average selling price escalation assumptions across all regions. |
Across the three figures, the main takeaway is that product boundaries and price timing drive most of the gap, not the underlying direction of demand. By keeping inputs anchored to observable demand signals and applying prices with a region-aware logic, the estimate stays repeatable and easier to audit when new data is released.


Key Questions Answered in the Report
What is the current value of the global steel sections market?
The steel sections market size is USD 384.95 billion in 2026 and is projected to reach USD 479.26 billion by 2031.
Which region leads demand for steel sections?
Asia-Pacific accounted for 70.22% of 2025 revenue, driven by large infrastructure programs in China, India, and Southeast Asia.
Which end-user segment is growing the fastest?
Aerospace and automotive applications show the highest forecast CAGR at 5.37% through 2031 as electric-vehicle platforms adopt high-strength profiles.
How will decarbonization policies affect steel sections suppliers?
The EU Carbon Border Adjustment Mechanism and similar policies will add up to USD 108 per tonne for high-carbon imports, favoring producers that invest in low-emission routes.
What manufacturing route is gaining share quickest?
Cold-formed sections are advancing at a 6.25% CAGR as modular construction adoption accelerates worldwide.
Are raw-material price swings a major risk?
Yes, 20%–25% volatility in iron-ore and scrap prices compresses margins, particularly for smaller mills lacking hedging tools.
Page last updated on:


 Your data is secure and never sold or shared.


