Market Overview
| Study Period | 2020 - 2031 |
|---|---|
| Forecast Data Period | 2026 - 2031 |
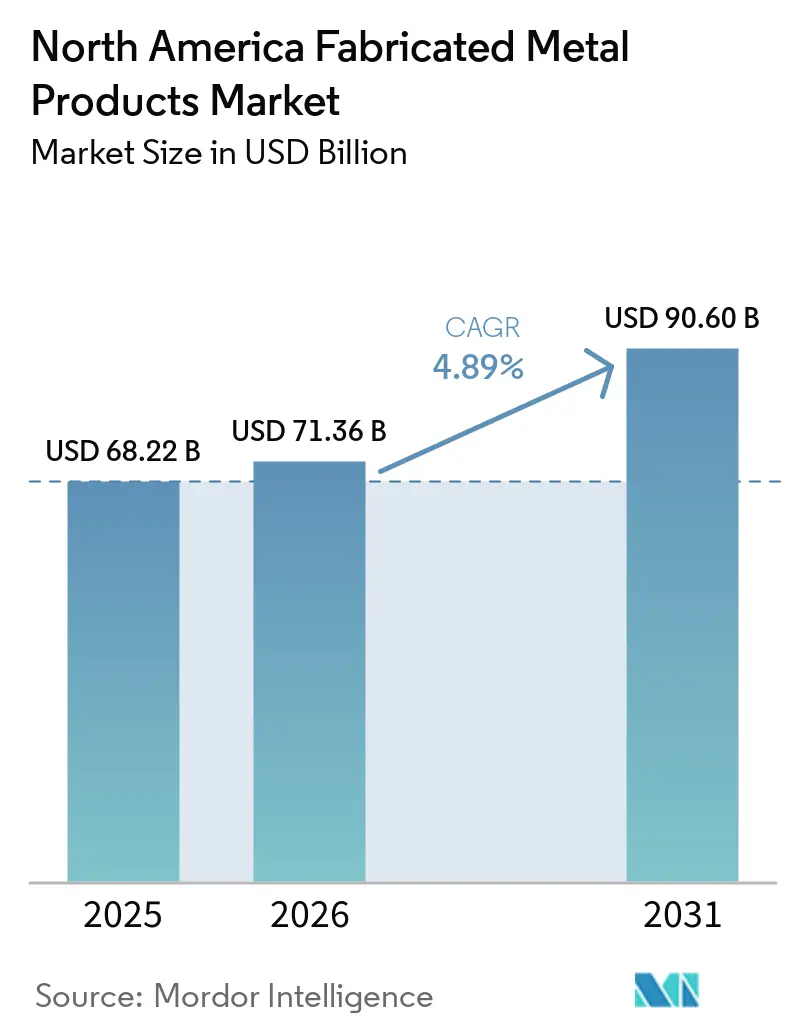
| Base Year Market Size (2025) | USD 68.22 Billion |
| Market Size (2026) | USD 71.36 Billion |
| Market Size (2031) | USD 90.60 Billion |
| Growth Rate (2026 - 2031) | 4.89% CAGR |
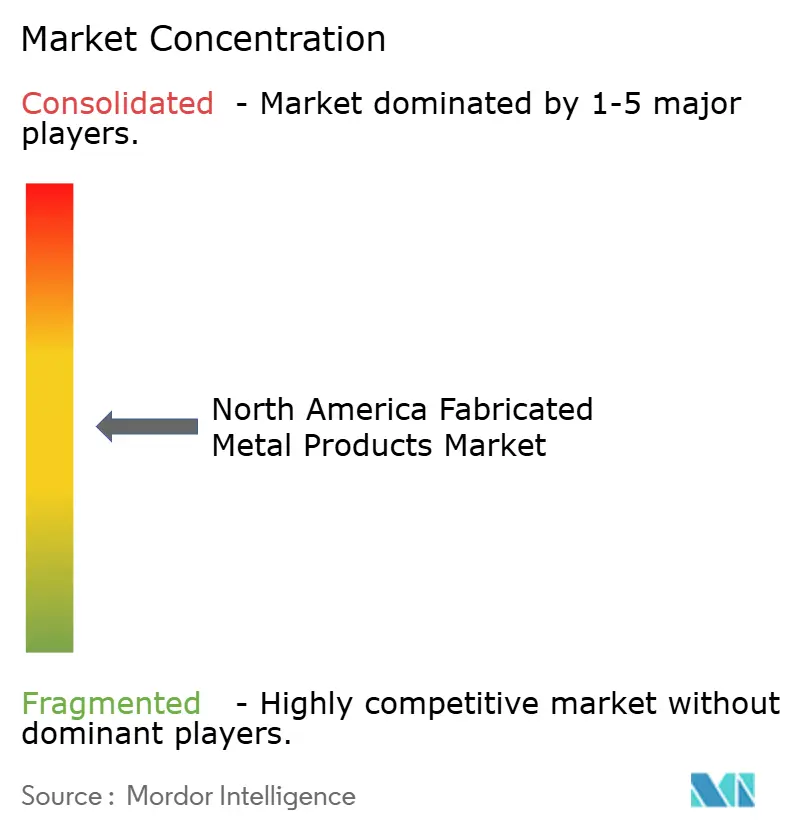
| Market Concentration | Medium |
Major Players
*Disclaimer: Major Players sorted in no particular order Image © Mordor Intelligence. Reuse requires attribution under CC BY 4.0. |
|
North America Fabricated Metal Products Market Analysis by Mordor Intelligence
The North America Fabricated Metal Products Market size is expected to increase from USD 68.22 billion in 2025 to USD 71.36 billion in 2026 and reach USD 90.60 billion by 2031, growing at a CAGR of 4.89% over 2026-2031.
The sector is transitioning from legacy job shops to highly automated operations that deploy collaborative robots, artificial-intelligence (AI) vision systems, and low-carbon steel certified through Environmental Product Declarations (EPDs). Reshoring tied to the United States-Mexico-Canada Agreement (USMCA) is channeling foreign direct investment into the region, while electric-vehicle (EV) lightweighting pushes aluminum usage higher. Hyper-automation is offsetting persistent welder shortages, although capital intensity limits adoption by shops with annual revenues below USD 10 million. Meanwhile, sustainability tenders from automotive and data-center customers reward fabricators that document cradle-to-gate emissions.[1]American Institute of Steel Construction. "Environmental Product Declarations." Accessed March 5, 2026. https://www.aisc.org/
Key Report Takeaways
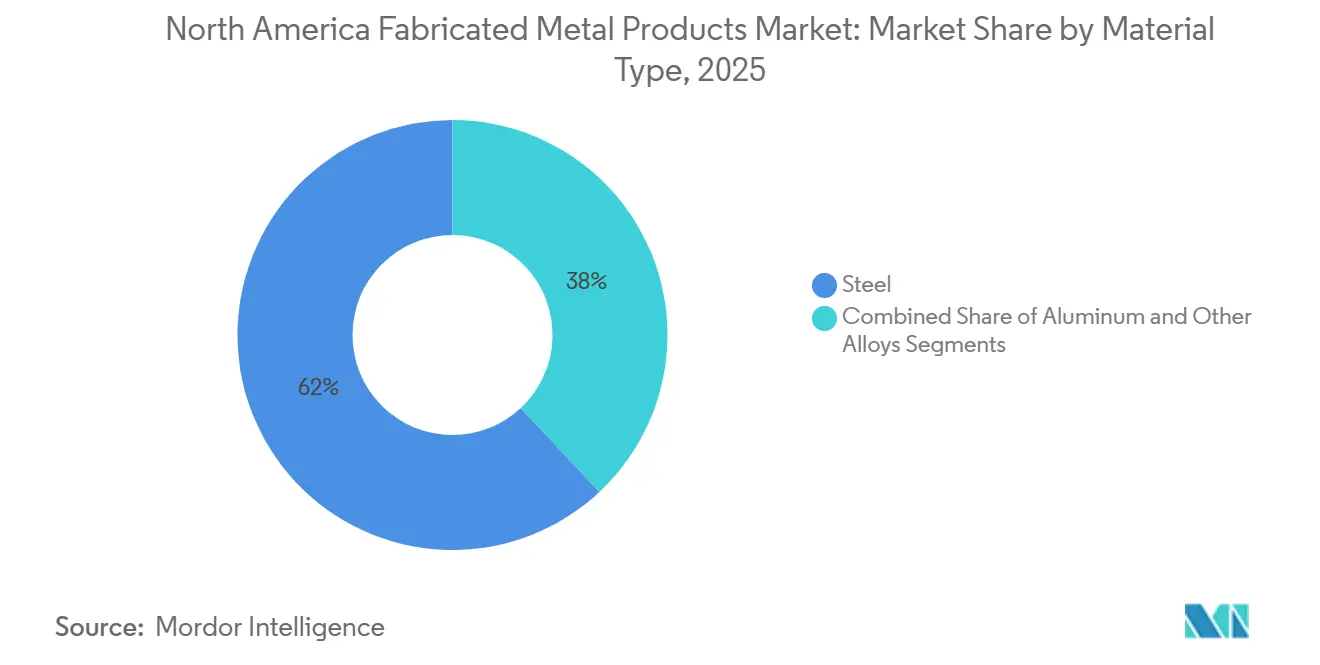
- By material type, steel led with 61.98% of the North America fabricated metal products market share in 2025, while aluminum is advancing at a 5.91% CAGR through 2031.
- By fabrication process, machining accounted for 41.09% of the North America fabricated metal products market size in 2025, but the Others category, stamping plus additive manufacturing, is set to climb at a 7.02% CAGR to 2031.
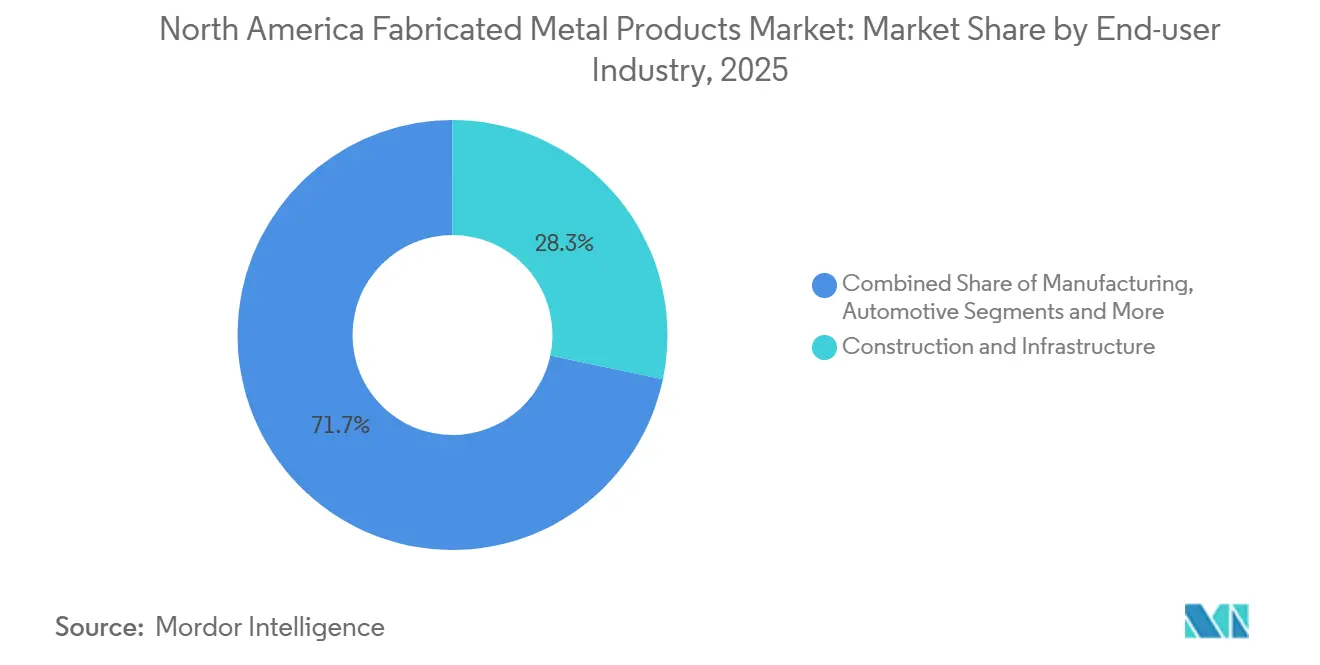
- By end-user industry, construction and infrastructure held 28.29% share in 2025, whereas power and utilities is projected to expand at a 6.57% CAGR through 2031.
- Geographically, the United States commanded 71.31% revenue in 2025, yet Mexico is forecast to grow fastest at a 5.43% CAGR on the back of automotive and aerospace nearshoring.
Note: Market size and forecast figures in this report are generated using Mordor Intelligence’s proprietary estimation framework, updated with the latest available data and insights as of 2026.
North America Fabricated Metal Products Market Trends and Insights
Drivers Impact Analysis*
| Drivers | (~) % Impact on CAGR Forecast | Geographic Relevance | Impact Timeline |
|---|---|---|---|
| EV-led lightweighting demand across auto and battery-electric buses | +1.3% | United States, Mexico (Bajío automotive corridor) | Medium term (2-4 years) |
| Hyper-automation of job shops (cobots, AI vision, 5-axis lasers, IoT cells) | +1.1% | United States, Canada (Ontario, Quebec) | Long term (≥4 years) |
| Reshoring and nearshoring accelerated by USMCA local-content rules | +0.9% | United States, Mexico, Canada | Short term (≤2 years) |
| AI-server and edge-data-center rack build-boom | +0.8% | United States (hyperscalers), Canada | Short term (≤2 years) |
| OEM sustainability tenders for low-carbon green steel and EPD-certified parts | +0.7% | United States, Canada | Medium term (2-4 years) |
| Source: Mordor Intelligence | |||
EV-Led Lightweighting Demand Across Auto and Battery-Electric Buses
Automotive original-equipment manufacturers (OEMs) are swapping mild steel for 6000-series aluminum extrusions to cut vehicle mass and extend driving range. The Aluminum Association projects 556 pounds per vehicle (PPV) of aluminum by 2030, up 100 PPV from 2025 levels. Fabricators respond by installing friction-stir welding cells and servo presses that can handle thinner gauges without distortion. Bajío-region suppliers serving Tesla and BMW are early adopters, aided by Mexico’s preferential USMCA status. Although adhesive bonding and self-piercing rivets raise process complexity, they deliver joints compatible with mixed-material bodies. Stronger OSHA dust-control rules for aluminum grinding add compliance cost but also level the safety playing field.[2]Aluminum Association. "Aluminum in Passenger Vehicles." Accessed March 5, 2026. https://www.aluminum.org/
Hyper-Automation of Job Shops (Cobots, AI Vision, 5-Axis Lasers, IoT Machining Cells)
Collaborative-robot weld cells built around Universal Robots’ UR20 model now tackle small-batch production with 98% first-pass yield. Vision systems from Cognex provide real-time seam tracking, while TRUMPF’s TruLaser platform predicts nozzle wear and auto-corrects cutting parameters. Mazak’s SMOOTH AI aggregates spindle-load data to trigger predictive maintenance alerts that trim unplanned downtime by 20%. Despite productivity gains, a fully automated line can cost more than USD 2 million, pushing smaller shops toward NIST-backed shared-automation centers in Ohio and Michigan. Over the long term, facilities that master lights-out production position themselves for higher-margin aerospace and medical work.
Reshoring and Nearshoring Accelerated by USMCA Local-Content Rules
The USMCA’s 75% regional-value threshold for autos and 70% steel-and-aluminum sourcing requirement have redirected supply chains from Asia to North America. Mexico attracted USD 40 billion of foreign direct investment in 2023, with 80% originating from U.S. OEMs. Fabricators in Monterrey and Saltillo are equipping lines with Bystronic fiber lasers to meet ISO 9001 quality metrics. Canada benefits through the Strategic Innovation Fund, which co-finances advanced manufacturing, though chokepoints such as the Ambassador Bridge highlight the need for dual-sourced capacity. In the short term, reshoring underpins baseline demand, while over the medium term it compresses lead times and reduces tariff exposure.
AI-Server and Edge-Data-Center Rack/Enclosure Build-Boom
Generative-AI workloads demand higher rack density and liquid cooling, pushing fabricators toward stainless-steel manifold welding and leak-proof pressure testing. The Open Compute Project expects 21-inch racks to exceed 70% of new installations by 2030. About 40% of data-center builds in 2025 included liquid cooling, quadruple the 2023 share. Panel Built’s modular battery-energy-storage (BESS) enclosures shorten utility-scale project schedules by 50%. Fabricators that certify designs to TIA-942 seismic standards win contracts that smaller shops cannot pursue. Because AI racks are high-mix and low-volume, automation plus quick-change tooling becomes a decisive capability.[3]Open Compute Project. "21-Inch Rack Standards." Accessed March 6, 2026. https://www.opencompute.org/
Restraints Impact Analysis*
| Restraints | (~) % Impact on CAGR Forecast | Geographic Relevance | Impact Timeline |
|---|---|---|---|
| Steel and aluminum price-spike volatility after 2025 tariff reset | −0.9% | United States, Canada | Short term (≤2 years) |
| Persistent welder/CNC-machinist talent gap despite automation | −0.6% | United States, Canada | Long term (≥4 years) |
| Mandatory Cybersecurity Maturity Model Certification (CMMC) 2.0 costs | −0.5% | United States | Short term (≤2 years) |
| Additive-manufacturing service-bureau substitution for short-run parts | −0.4% | United States | Medium term (2-4 years) |
| Source: Mordor Intelligence | |||
Steel and Aluminum Price-Spike Volatility After 2025 Tariff Reset
Section 232 tariffs of 50% imposed from June 2025 sent Midwest aluminum premiums 54% higher and hot-rolled-coil (HRC) prices up 22%. Fixed-price contracts signed in 2024 suddenly turned loss-making, and every 10% raw-material jump erodes 1.5-2.0 percentage points of operating margin for a typical fabricator. Retaliatory duties from Canada and Mexico further distort regional flows, forcing dual inventories that tie up working capital. While Congress may revisit tariff authority in 2026, uncertainty already defers new capacity investments. In response, larger firms hedge with scrap-based electric-arc-furnace (EAF) suppliers, whereas smaller shops often absorb the cost hit.
Persistent Welder/CNC-Machinist Talent Gap Despite Automation
Quality Magazine forecasts 1.9 million U.S. manufacturing roles going unfilled by 2033. Even with cobots, shops need programmers and maintenance technicians who understand robot calibration and AI vision tuning. Rural regions struggle most, prompting overtime costs that compress profit margins. Macomb Community College’s Michigan Technical Education Center trains 400 welders and machinists annually, yet retirements offset the inflow. The U.S. Department of Labor has expanded apprenticeship funding, but participation lags in Midwestern counties where fabrication clusters are densest. Consequently, wage inflation remains a structural headwind over the forecast horizon.
*Our forecasts treat driver/restraint impacts as directional, not additive. The impact forecasts reflect baseline growth, mix effects, and variable interactions.
Segment Analysis
By Material Type: Aluminum Expansion Outpaces Steel Dominance
Steel commanded 61.98% of the North American fabricated metal products market in 2025, buoyed by bridge beams, oil-and-gas pipe, and heavy equipment. Aluminum, however, is climbing at a 5.91% CAGR through 2031 as battery-pack enclosures, server cold plates, and aerospace parts demand corrosion resistance and thermal conductivity. The North America fabricated metal products market size for aluminum-based fabrications is therefore rising faster than the overall sector, narrowing the gap with steel. Fabricators invest in friction-stir welding to join 6000 and 7000 series extrusions, while automotive OEMs specify 2xxx and 7xxx body-in-white alloys to meet crash standards.
Green-steel offerings such as SSAB Zero and Outokumpu low-carbon stainless steel let steel compete on sustainability credentials, but they cost 10-15% more than commodity grades. By contrast, aluminum benefits from an established recycling ecosystem that already supplies 75% of billet feedstock. As liquid-cooled data centers proliferate, 6061-T6 manifolds and cold plates gain favor over copper because of lower weight and cost. Steel’s stronghold in construction is eroded at the margin by aluminum curtain-wall systems that improve seismic performance. Over the forecast window, aluminum’s share expansion continues, although steel remains irreplaceable in price-sensitive structural applications.


By Fabrication Process: Stamping and Additive Accelerate Inside “Others” Category
Machining generated 41.09% of North America fabricated metal products market revenue in 2025 thanks to aerospace components that demand tolerances tighter than ±0.005 inches. Five-axis mills from DMG MORI and Mazak improve surface finish and shorten setup time, keeping machining indispensable for complex geometries. Yet the “Others” bucket—stamping combined with additive manufacturing will post a 7.02% CAGR to 2031, the fastest within the fabrication process mix. Servo presses fine-tune slide motion to stamp ultra-high-strength steel without cracking, while metal additive builds lattice structures impossible by subtractive routes.
Additive’s strength lies in part consolidation: a single laser-powder-bed build can replace assemblies of welded sheet metal, cutting labor by 20%. Stamping thrives where volumes exceed 100,000 units and per-part cycle time falls below three seconds. As electric-vehicle makers standardize battery-box geometries, progressive-die stamping becomes cost-effective for aluminum lids and endplates. Fabricators that combine 3D-printed tool inserts with conventional dies achieve rapid design changes without full tool re-cuts. Consequently, machining’s share stabilizes as it shifts toward post-processing of additive parts rather than first-cut production.
By End-User Industry: Utilities Overtake Construction in Growth Pace
Construction and infrastructure absorbed 28.29% of 2025 revenue, led by structural steel for bridges and commercial buildings. However, power and utilities will post a 6.57% CAGR to 2031, outpacing every other vertical. Massive investment under the U.S. Infrastructure Investment and Jobs Act channels USD 180 billion into grid upgrades, requiring fabricated steel poles, substation frames, and battery-energy-storage (BESS) housings. Panel Built’s modular enclosures, certified to UL 9540A fire-safety tests, cut on-site hours in half, appealing to utilities constrained by labor shortages.
Manufacturing remains a steady customer for precision fixtures and automation frames, while automotive demand hinges on EV battery-tray volume. Aerospace and defense rely on AS9100-certified shops that machine titanium and aluminum to micrometer tolerances. Oil and gas orders swing with crude prices, yet liquefied-natural-gas (LNG) terminals on the Gulf Coast sustain demand for large-diameter pipe spools. The utilities boom shifts revenue composition toward fabricators skilled in weather-sealed welds and outdoor powder-coating, diversifying the sector beyond cyclical building construction.
Geography Analysis
The United States generated 71.31% of 2025 revenue, anchored by Sun Belt building booms, aerospace clusters in Washington and Texas, and hyperscale data-center builds in Virginia. Yet Mexico is projected to expand at a 5.43% CAGR thanks to USMCA-driven nearshoring that funnels automotive and aerospace work to Bajío-region plants in Guanajuato, Querétaro, and Aguascalientes. Foreign direct investment of USD 40 billion in 2023, 80% from U.S. corporates, financed servo-press lines and laser-cutting cells that meet ISO 9001 standards.
Canada’s fabricated-metal shipments reached CAD 3.8 billion (USD 2.8 billion) in November 2024, propelled by Ontario’s automotive stamping and Quebec’s aerospace machining. Federal grants under the Strategic Innovation Fund co-purchase AI-enabled robots, but cross-border chokepoints like the 2024 Ambassador Bridge shutdown nudged firms to dual-source between U.S. and Canadian sites. Meanwhile, Mexico’s IMMEX program allows duty-free raw-material imports for export-oriented production, trimming landed costs by up to 20% relative to U.S. sourcing.
Tesla’s planned Gigafactory Mexico and BMW’s San Luis Potosí expansion entrench the country’s role as an aluminum-stamping hub for EV structures, while Canadian shops position for low-carbon steel fabrication to serve data-center and renewable-energy clients. Overall, the North America fabricated metal products market gains resilience by distributing capacity across three complementary yet policy-divergent economies.[4]INEGI (Instituto Nacional de Estadística y Geografía). "Mexico Manufacturing GDP Q3 2024." Accessed March 6, 2026. https://www.inegi.org.mx/
Competitive Landscape
Competition is moderately fragmented: the ten largest players hold roughly 25-30% of sector revenue, leaving room for thousands of job shops focused on local customers. Tier 1 fabricators such as O’Neal Manufacturing, Mayville Engineering, and Valmont Industries invest in 5-axis lasers, cobot-equipped weld cells, and cloud-linked machining centers to secure high-value contracts in automotive, aerospace, and utilities. Their scale supports in-house EPD reporting and cyber-security teams, giving them a qualification edge in sustainability- and defense-driven tenders.
Technology suppliers shape competitive dynamics. TRUMPF’s TruLaser 1030 Fiber with AI nozzle monitoring lowers scrap by 15%, while Lincoln Electric bundles power sources, wire, and robot arms into turnkey weld lines that cut cycle times by 30%. DMG MORI’s hybrid LASERTEC 30 SLM couples additive and subtractive in a single build envelope, letting fabricators serve aerospace customers that demand topology-optimized parts without extended lead times. Protolabs leverages an online portal for instant quoting and one-day shipping, forcing traditional shops to digitize front-end workflows or risk customer attrition.
CMMC 2.0 costs catalyze mergers as private-equity platforms roll up regional outfits to spread compliance overhead across multi-site networks. Sustainability demands produce another consolidation wave: only 15% of shops now meet Microsoft- and Google-level carbon-tracking requirements. Those that publish steel EPDs or qualify for hydrogen-reduced SSAB Zero steel can command 10-15% price premiums, cushioning raw-material volatility. In summary, capital access, digital agility, and compliance readiness increasingly dictate market share grabs.
North America Fabricated Metal Products Industry Leaders
-
O’Neal Manufacturing Services
-
Mayville Engineering Company
-
Valmont Industries
-
BTD Manufacturing
-
Kapco Metal Stamping
- *Disclaimer: Major Players sorted in no particular order

Recent Industry Developments
- March 2026: Mayville Engineering Company reported strong Q4 2025 revenues of USD 134.3 million, driven by an aggressive strategic pivot toward fabricating for high-growth data center and critical power markets.
- February 2026: The rollout of USD 39 billion in federal funding under the CHIPS and Science Act is creating a massive new revenue stream for North American metal fabricators.
- June 2025: The implementation of 50% U.S. tariffs on steel and aluminum caused massive price surges, including a 54% jump in aluminum premiums. This has severely compressed fabricator profit margins and disrupted major cross-border supply chains across North America.
- January 2025: Lincoln Electric posted Q4 2024 revenues of USD 1.02 billion, up 9.7% year on year, citing infrastructure welding demand.


North America Fabricated Metal Products Market Report Scope
Fabricated Metal Products are the metal components that are assembled, shaped, or otherwise processed to produce a practical product. Several metalworking techniques, such as rolling, punching, stamping, sintering, welding, and machining, are together referred to as a fabrication. A complete background analysis of the North American Fabricated Metal Products Market, including the assessment of the economy and contribution of sectors in the economy, a market overview, market size estimation for key segments, emerging trends in the market segments, market dynamics and geographical trends, and COVID-19 impact, is covered in the report.
The North American fabricated metal products market is segmented by material type (steel, aluminium, and others), by end-user industry (manufacturing, power and utilities, construction, oil and gas, and other end-user industries), and by country (the United States, Canada, and Mexico). The report offers the market size and forecasts for the North America fabricated metal products market in values (USD billion) for all the above segments.
By Material Type
| Steel |
| Aluminum |
| Other Alloys (Titanium, Copper, etc.) |
By Fabrication Process
| Casting |
| Forging |
| Machining |
| Welding & Tubing |
| Others (Stamping, Additive Manufacturing) |
By End-user Industry
| Manufacturing |
| Power & Utilities |
| Construction & Infrastructure |
| Oil & Gas |
| Automotive |
| Aerospace & Defense |
| Other Industries |
By Geography
| United States |
| Canada |
| Mexico |
| By Material Type | Steel |
| Aluminum | |
| Other Alloys (Titanium, Copper, etc.) | |
| By Fabrication Process | Casting |
| Forging | |
| Machining | |
| Welding & Tubing | |
| Others (Stamping, Additive Manufacturing) | |
| By End-user Industry | Manufacturing |
| Power & Utilities | |
| Construction & Infrastructure | |
| Oil & Gas | |
| Automotive | |
| Aerospace & Defense | |
| Other Industries | |
| By Geography | United States |
| Canada | |
| Mexico |


Key Questions Answered in the Report
How large will North America fabricated metal products demand be by 2031?
It is projected to reach USD 90.60 billion by 2031, reflecting a 4.89% CAGR from 2026.
Which material category is growing fastest in regional fabrication?
Aluminum is advancing at a 5.91% CAGR on the back of EV battery enclosures and data-center cooling hardware.
Why is Mexico’s share of fabricated metal production rising?
USMCA local-content mandates and USD 40 billion of foreign investment are expanding automotive and aerospace fabrication in the Bajío corridor.
What compliance trend is reshaping defense-oriented fabricators?
CMMC 2.0 cybersecurity rules require Level 2 certification, costing USD 3-30 million and driving consolidation.
How are tariffs affecting input costs?
Section 232 tariffs effective June 2025 lifted Midwest aluminum premiums 54% and hot-rolled-coil prices 22%, squeezing margins on fixed-price contracts.
Where are automation investments most visible?
Tier 1 shops deploy cobot-weld cells, AI-guided lasers, and IoT machining centers to overcome labor gaps and win high-value contracts.
Page last updated on:


