Speed Pedelec E-Bike Market Size and Share
Market Overview
| Study Period | 2017 - 2029 |
|---|---|
| Forecast Data Period | 2025 - 2029 |
| Historical Data Period | 2017 - 2023 |
| Market Size (2025) | USD 1.59 Billion |
| Market Size (2029) | USD 2.24 Billion |
| Growth Rate (2025 - 2029) | 8.96% CAGR |
| Market Concentration | Low |
Major Players*Disclaimer: Major Players sorted in no particular order Image © Mordor Intelligence. Reuse requires attribution under CC BY 4.0. | |

Speed Pedelec E-Bike Market Analysis by Mordor Intelligence
The Speed Pedelec E-Bike Market size is estimated at 1.59 billion USD in 2025, and is expected to reach 2.24 billion USD by 2029, growing at a CAGR of 8.96% during the forecast period (2025-2029).
The speed pedelec electric bike industry is undergoing a significant transformation as manufacturers adapt to evolving consumer preferences and technological capabilities. Major industry players are increasingly focusing on developing intelligent control systems and automated transmission technologies to enhance energy efficiency and the riding experience. The integration of advanced features like GPS tracking, smartphone connectivity, and cloud-based diagnostics is becoming standard in premium models, reflecting the industry's shift toward electric mobility and smart urban mobility solutions. This technological evolution is particularly evident in urban markets where consumers demand sophisticated features for daily commuting.
The industry is witnessing substantial innovations in product development and manufacturing processes, with companies investing heavily in research and development. Manufacturers are introducing high-tech electric bicycles with smartphone integration and developing high-end folding electric bicycles, significantly impacting market dynamics. These advancements include the implementation of automatic and semi-automatic transmission systems, improved battery management systems, and enhanced motor efficiency. The focus on lightweight materials and aerodynamic designs is also driving product evolution, making speed pedelecs more appealing to a broader consumer base.
Regional market dynamics reveal varying levels of market maturity and adoption patterns across different geographical areas. In Europe, electric bike sales have experienced remarkable growth, with countries like Germany, Belgium, and the Netherlands leading the market. The APAC region has demonstrated significant market potential, with unit sales reaching approximately 34.8 million in 2023. North America represents an emerging market with increasing adoption rates, particularly in urban areas where bike-sharing operators are expanding their fleets with electric options.
Consumer behavior analysis reveals a notable shift in usage patterns and preferences. A recent transportation research study showed that Norwegian e-bike riders significantly increased their daily cycling distance from 2.1 kilometers to 9.2 kilometers after purchasing an electric bike, demonstrating the potential for speed pedelecs to transform commuting habits. This trend is particularly pronounced among young urban professionals and health-conscious consumers who view electric bicycles as a practical solution for both commuting and recreational purposes. The growing preference for sustainable mobility options has also contributed to increased adoption rates among environmentally conscious consumers.
Global Speed Pedelec E-Bike Market Trends and Insights
The steady global increase in e-bike adoption rates reflects a worldwide shift toward sustainable and efficient personal mobility solutions
- There has been an increase in the demand for electric bicycles in many countries over the past several years. Increased gasoline costs, traffic congestion during rush hours, and the health advantages of exercise are driving the adoption of e-bikes in several countries, including the United Kingdom and the United States. With a greater adoption rate in 2019 compared to other regions, Europe was the primary market for the sales of electric bikes. The increasing demand for e-bikes accelerated the adoption rate in 2019 compared to 2018.
- The bicycle industry was favorably impacted by the rapid global expansion of COVID-19 cases. E-bikes are one of the most practical and affordable solutions for everyday commutes to work and other local locations compared to other means of transportation, which has revolutionized how consumers commute. This has encouraged people to invest in e-bikes, which accelerated their adoption rate in 2020 over 2019 in various countries worldwide.
- The return of commercial operations and the lifting of trade restrictions like lockouts have accelerated the adoption of e-bikes in numerous countries throughout the world. The improvement of import and export activities has been a result of the removal of trade obstacles globally. According to estimates, during the forecast period, the adoption rate of e-bikes will increase in a number of countries worldwide due to consumers' growing interest in them as a result of their features and advantages, such as the ability to exercise while riding, the lack of fuel costs, and cleaner rides.


A global uptick in 5-15 km commutes underscores a universal shift towards moderate commuting distances, aligning with evolving work-life dynamics and urban planning.
- The global bicycle market is made up of several bicycle-friendly regions, including North America, Europe, and Asia-Pacific. Bicycle demand has grown recently among many countries in various regions. People from different countries and regions are gradually shifting to using bicycles for their everyday commutes of 5 to 15 km or other nearby locations such as offices and commercial districts. The APAC region has witnessed the most daily commuters traveling 5 to 15 km among all regions.
- Following the COVID-19 outbreak, which forced the closing of gyms and public transportation in several countries worldwide, many people discovered bicycles to be a secure and isolated method of transportation. People also preferred to exercise during the pandemic by bicycling or going on weekend runs to neighboring sites, which led to an increase in the number of commuters with a daily journey distance of 5 to 15 km in 2020 over 2019 globally. Consumers who commute 5 to 15 km daily are drawn to e-bikes with cutting-edge battery packs that offer an increased range of up to 40 to 45 km.

OTHER KEY INDUSTRY TRENDS COVERED IN THE REPORT
- GDP Per Capita & Buying Power of Consumer
- The global bicycle rental market exhibits a robust growth trajectory, with significant contributions from Asia-Pacific and Europe, driving the worldwide market trend upwards.
- The global Hyper-Local Delivery market is on a significant upward trend, driven mainly by substantial volumes in the US and Asia-Pacific, especially China
- The global bicycle trekker market has been experiencing continuous growth, with a substantial increase in the number of trekkers from 2017 to 2029.
- As traffic and pollution increase, more individuals are choosing bicycles
- Key countries' varying inflation trajectories underscore the nuanced and multifaceted nature of global economic health
- The global E-Bike battery price is on a downward trend, influenced by regional dynamics and significant contributions from Asia-Pacific and Europe.
- Governments are making efforts to provide bicycle infrastructure to increase the use of bicycles
- Advanced Battery Packs Are Encouraging Consumers to Adopt E-bikes
Segment Analysis: Application Type
City/Urban Segment in Speed Pedelec E-Bike Market
The City/Urban segment dominates the global speed pedelec e-bike market, commanding approximately 46% market share in 2024. This significant market position is driven by the increasing adoption of speed pedelecs for urban commuting and last-mile connectivity solutions. The segment's growth is particularly strong in major metropolitan areas where consumers are seeking efficient alternatives to traditional transportation methods. The rise of on-demand food delivery services and courier companies has further bolstered the demand for city/urban speed pedelecs. Additionally, government initiatives promoting sustainable urban mobility and the development of dedicated cycling infrastructure in cities have created a favorable environment for this segment's continued dominance.
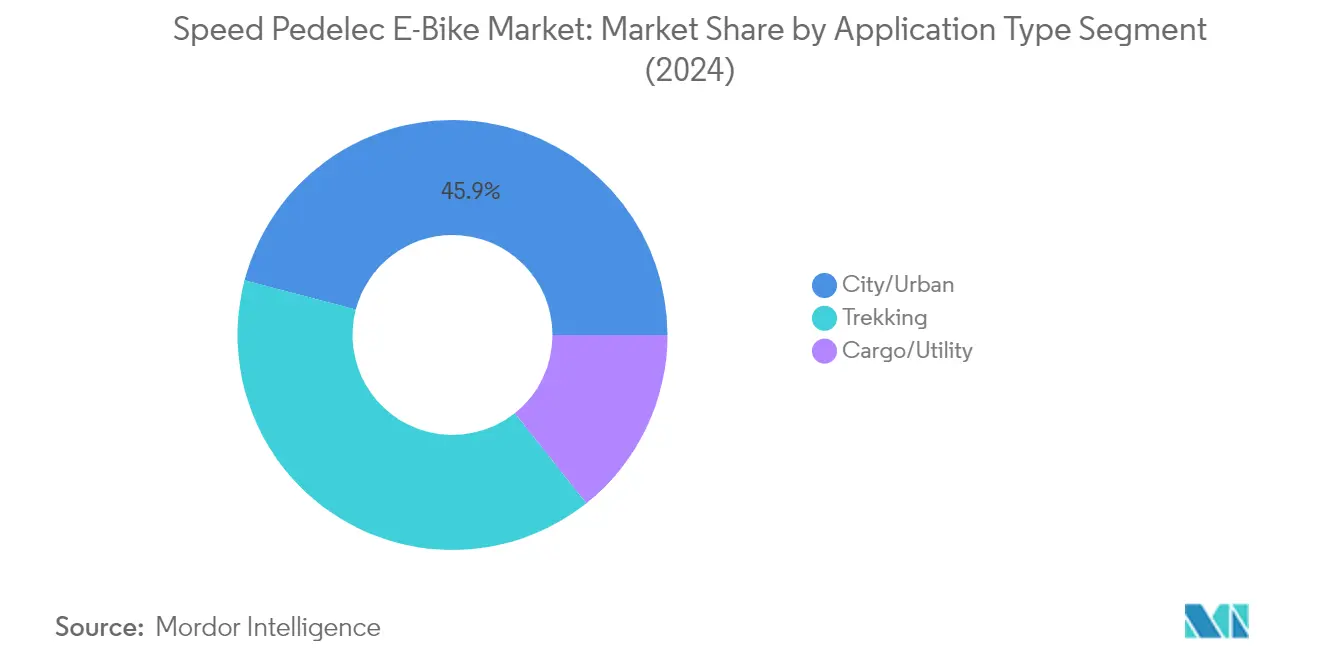

Trekking Segment in Speed Pedelec E-Bike Market
The Trekking segment is emerging as the fastest-growing category in the speed pedelec e-bike market, projected to experience robust growth from 2024 to 2029. This remarkable growth is driven by increasing interest in adventure sports and recreational activities among younger consumers. The segment's expansion is supported by technological advancements in battery technology and motor systems, enabling longer riding ranges and better performance on challenging terrains. Manufacturers are responding to this trend by introducing advanced features such as integrated GPS systems and improved suspension systems specifically designed for trekking applications. The growing popularity of eco-tourism and outdoor activities has also contributed significantly to the segment's acceleration.
Remaining Segments in Application Type
The Cargo/Utility segment represents a crucial component of the speed pedelec e-bike market, addressing specific needs in commercial and logistics applications. This segment has gained particular importance in urban logistics and last-mile delivery services, offering businesses a sustainable and efficient solution for short-distance transportation needs. The segment's value proposition centers on its ability to combine speed with cargo-carrying capacity, making it especially attractive for businesses looking to optimize their delivery operations while maintaining environmental sustainability. The development of specialized cargo-carrying solutions and enhanced battery performance has further strengthened this segment's position in the market.
Segment Analysis: Battery Type
Lithium-ion Battery Segment in Speed Pedelec E-Bike Market
The lithium-ion battery segment dominates the global speed pedelec e-bike market, commanding approximately 75% market share in 2024. This segment's leadership position is driven by lithium-ion batteries' superior energy and power densities, making them the most promising energy storage solution for e-bikes. The shift from lead-acid to lithium-ion batteries has enabled manufacturers to significantly reduce battery pack size and weight while extending operational range. These batteries' lightweight design, longer lifespan, and ability to support extended travel distances have made them the preferred choice among speed pedelec manufacturers and users alike. The segment's growth is further supported by ongoing technological advancements, declining battery costs, and increasing investment in research and development by major manufacturers to enhance performance and efficiency of electric bike batteries.
Lead Acid Battery Segment in Speed Pedelec E-Bike Market
The lead acid battery segment, while holding a significant market presence, faces challenges in maintaining its position due to technological limitations and evolving consumer preferences. These batteries are typically rated for only 30-50% of their actual capacity, with a 600 Ah battery effectively holding up to 300 Ah. The final 20% of charging capacity cannot be achieved quickly, and these batteries have a relatively limited lifespan of 500-1,000 cycles. Despite their lower initial cost compared to lithium-ion alternatives, lead acid batteries' weight disadvantages and performance limitations are causing a gradual shift away from this technology in the speed pedelec market.
Remaining Segments in Battery Type
Other battery technologies in the speed pedelec market include emerging options like Sodium-ion (Na-ion), Nickel-cadmium (NiCd), Nickel-Metal Hydride (NiMH), and various lithium variants such as Lithium Manganese and Lithium Cobalt. These alternative technologies are gaining attention for their potential to offer unique advantages in terms of cost, sustainability, and performance. For instance, sodium-ion batteries are being explored as a complementary technology to lithium-ion batteries due to their abundant natural supply and potentially lower costs. Major manufacturers are actively investigating these alternatives to diversify their battery offerings and address specific market needs, including the development of more efficient electric bike battery solutions.
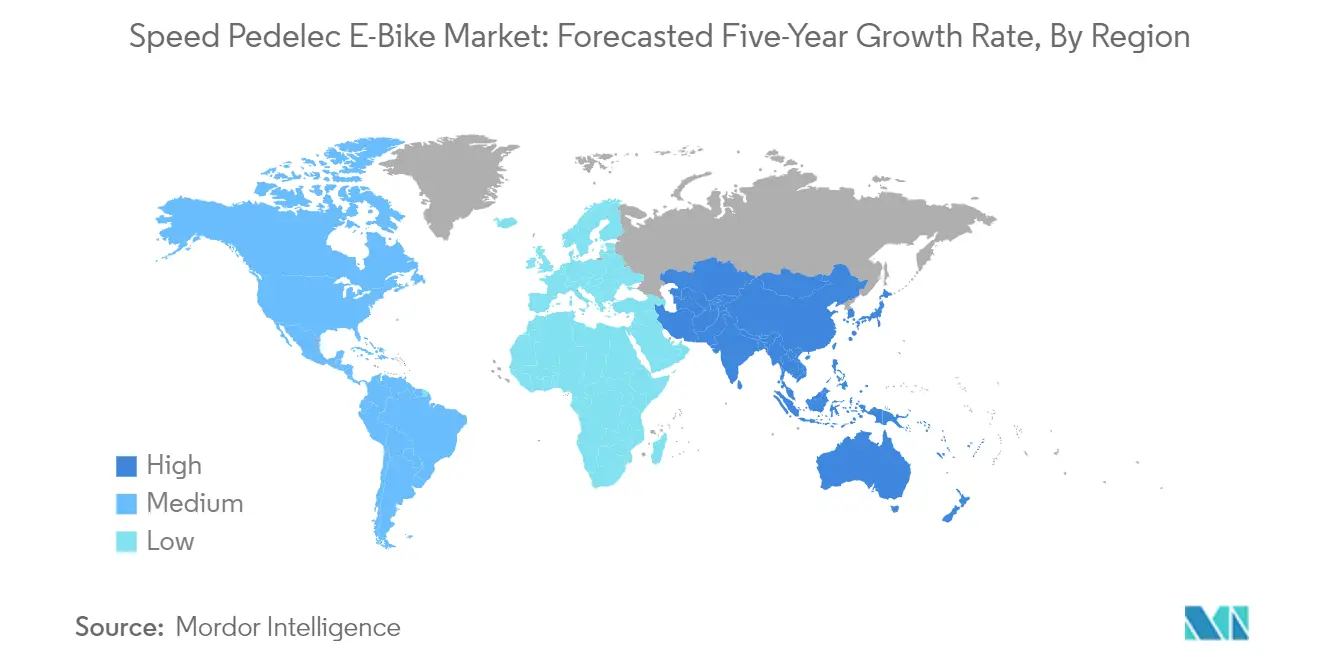
Speed Pedelec E-Bike Market Geography Segment Analysis
Speed Pedelec E-Bike Market in Africa
The African electric bike market is experiencing a transformative phase as manufacturers adopt innovative strategies to capitalize on the potential of electric two-wheelers. The region's relatively lower ownership of individual private transportation compared to industrialized nations positions it favorably for the transition to e-mobility. South Africa leads the regional market with its growing urban mobility solutions and increasing consumer awareness about sustainable transportation options. The market is primarily driven by home charging options, renewable energy integration, and improved vehicle performance capabilities that appeal to the local consumer base.
Speed Pedelec E-Bike Market in Asia-Pacific
The Asia-Pacific electric bicycle market is witnessing substantial growth driven by the increasing adoption of electric bikes as daily transportation modes and growing environmental consciousness. The region benefits from strong government support through various initiatives and incentives, particularly in countries like China, Japan, and South Korea. The presence of major manufacturers and robust supply chains further strengthens the market position in this region.
Speed Pedelec E-Bike Market in China
China dominates the Asia-Pacific pedelec market with approximately 35% market share in 2024. The country's strong manufacturing capabilities, extensive cycling infrastructure, and supportive government policies have created a favorable environment for market growth. The nation has earned the moniker "Kingdom of Bicycles" and continues to lead in both the production and consumption of electric bicycles, with particular strength in urban mobility solutions and last-mile connectivity.
Speed Pedelec E-Bike Market in India
India represents the fastest-growing market in the Asia-Pacific region, with an expected growth rate of approximately 22% from 2024 to 2029. The country's rapid urbanization, increasing environmental awareness, and growing preference for sustainable transportation solutions are driving market expansion. The government's push towards the electric mobility market and the development of supporting infrastructure are creating new opportunities for market players, particularly in urban areas where traffic congestion and pollution concerns are driving the adoption of alternative transportation solutions.
Speed Pedelec E-Bike Market in Europe
Europe represents a mature and sophisticated market for speed pedelec e-bikes, characterized by advanced infrastructure, strong regulatory frameworks, and high consumer awareness. The region benefits from extensive cycling networks, particularly in countries like Germany, the Netherlands, and Belgium. The market is supported by various government initiatives promoting sustainable mobility and reducing carbon emissions in urban areas.
Speed Pedelec E-Bike Market in Germany
Germany leads the European speed pedelec market with approximately 18% market share in 2024. The country's strong automotive heritage, combined with its commitment to sustainable mobility, has created a robust ecosystem for e-bike development and adoption. The nation's extensive cycling infrastructure and strong consumer awareness about environmental benefits have contributed to its market leadership position.
Speed Pedelec E-Bike Market in Poland
Poland emerges as the fastest-growing market in Europe with an expected growth rate of approximately 14% from 2024 to 2029. The country's rapid urbanization, improving cycling infrastructure, and increasing consumer interest in sustainable transportation options are driving market growth. Government initiatives supporting electric mobility and growing environmental consciousness among consumers are creating favorable conditions for market expansion.
Speed Pedelec E-Bike Market in Middle East
The Middle East micro mobility market is witnessing gradual growth as the region embraces sustainable transportation solutions. The market is primarily driven by increasing environmental awareness, government initiatives promoting clean mobility, and growing urbanization. Saudi Arabia emerges as the largest market in the region, while the United Arab Emirates shows the fastest growth potential, supported by smart city initiatives and increasing adoption of sustainable transportation solutions.
Speed Pedelec E-Bike Market in North America
The North American urban mobility market is characterized by growing consumer interest in sustainable transportation and increasing adoption of electric mobility solutions. The region is experiencing significant market expansion driven by improved cycling infrastructure, government incentives, and rising environmental consciousness. The United States leads the market in both size and growth rate, followed by Canada and Mexico, with particular strength in urban mobility solutions and recreational usage.
Speed Pedelec E-Bike Market in South America
The South American electric bicycle market is showing promising growth potential as countries in the region increasingly focus on sustainable transportation solutions. Brazil emerges as both the largest and fastest-growing market in the region, driven by urbanization and growing environmental awareness. The market is characterized by increasing investment in cycling infrastructure, rising consumer interest in alternative transportation modes, and growing support from local governments for sustainable mobility solutions.

Competitive Landscape
Top Companies in Speed Pedelec E-Bike Market
The global speed pedelec market is characterized by continuous product innovation, with leading manufacturers focusing on developing advanced motor technologies, improved battery systems, and enhanced safety features. Companies are demonstrating operational agility through flexible manufacturing processes and robust supply chain management, allowing them to respond quickly to market demands and regional preferences. Strategic moves in the electric bike industry include expanding distribution networks, particularly in emerging markets, and establishing partnerships with technology providers to enhance e-bike capabilities. Major players are also investing in research and development to create lighter frames, more efficient power management systems, and smart connectivity features, while simultaneously expanding their production facilities to meet growing demand across different regions.
Market Dominated by European Manufacturing Giants
The speed pedelec market exhibits a moderate level of consolidation, with established European manufacturers holding significant market share, particularly companies from the Netherlands and Germany. These dominant players leverage their extensive manufacturing expertise, established brand reputation, and comprehensive distribution networks to maintain their market positions. The industry structure is characterized by a mix of large conglomerates that offer diverse mobility solutions and specialized e-bike manufacturers focused exclusively on high-performance electric bicycles.
Merger and acquisition activity in the sector has been notable, with larger companies acquiring smaller, innovative manufacturers to expand their technological capabilities and market reach. This consolidation trend is driven by the need to achieve economies of scale, access new markets, and acquire specialized expertise in electric drivetrain technology. Traditional bicycle manufacturers are also entering the market through strategic acquisitions and partnerships, particularly targeting companies with strong e-bike technology portfolios.
Innovation and Sustainability Drive Future Growth
For incumbent manufacturers to maintain and increase their market share, focusing on technological innovation, particularly in battery efficiency and motor performance, will be crucial. Companies need to invest in developing proprietary technologies while also building strong relationships with component suppliers to ensure competitive advantages. Success factors include establishing robust after-sales service networks, implementing effective warranty programs, and developing user-friendly interfaces that enhance the riding experience.
Emerging players can gain ground by focusing on specific market niches, such as urban commuting or sports performance segments, while developing unique value propositions around sustainability and customization. The electric bicycle industry faces moderate substitution risk from traditional bicycles and other electric mobility industry solutions, making it essential for companies to differentiate their offerings through innovative features and superior performance. Regulatory frameworks, particularly regarding speed limits and usage restrictions, will continue to shape market development, requiring manufacturers to maintain flexibility in their product development strategies and maintain close relationships with regulatory bodies.
Speed Pedelec E-Bike Industry Leaders
Accell Group
Giant Manufacturing Co. Ltd.
Pon Holding B.V.
Trek Bicycle Corporation
Yadea Group Holdings Ltd.
- *Disclaimer: Major Players sorted in no particular order


Recent Industry Developments
- December 2022: As part of its 2023 national dealership promotion plan, Yadea joined the new US Partner Recruitment Drive for its e-bike products. It was reportedly looking for local agents and distributors in the United States as part of its global expansion plans.
- November 2022: Giant unveiled the Stormguard E+, a range of full-suspension e-bikes. These bikes are expected to be available for purchase in Europe in 2023. The E+1 is priced at EUR 7,999, and the E+2 is priced at EUR 6,499.
- May 2022: Cadence Performance acquired the St. Paul's branch of the largest Giant store in the United Kingdom, located at the heart of London.


Global Speed Pedelec E-Bike Market Report Scope
Cargo/Utility, City/Urban, Trekking are covered as segments by Application Type. Lead Acid Battery, Lithium-ion Battery, Others are covered as segments by Battery Type. Africa, Asia-Pacific, Europe, Middle East, North America, South America are covered as segments by Region.| Cargo/Utility |
| City/Urban |
| Trekking |
| Lead Acid Battery |
| Lithium-ion Battery |
| Others |
| Africa | By Country | South Africa |
| Rest-of-Africa | ||
| Asia-Pacific | By Country | Australia |
| China | ||
| India | ||
| Japan | ||
| New Zealand | ||
| South Korea | ||
| Rest-of-APAC | ||
| Europe | By Country | Austria |
| Belgium | ||
| Czech Republic | ||
| Denmark | ||
| Finland | ||
| France | ||
| Germany | ||
| Italy | ||
| Luxembourg | ||
| Netherlands | ||
| Norway | ||
| Poland | ||
| Spain | ||
| Sweden | ||
| Switzerland | ||
| UK | ||
| Rest-of-Europe | ||
| Middle East | By Country | Saudi Arabia |
| United Arab Emirates | ||
| Rest-of-Middle East | ||
| North America | By Country | Canada |
| Mexico | ||
| US | ||
| Rest-of-North America | ||
| South America | By Country | Argentina |
| Brazil | ||
| Rest-of-South America |
| Application Type | Cargo/Utility | ||
| City/Urban | |||
| Trekking | |||
| Battery Type | Lead Acid Battery | ||
| Lithium-ion Battery | |||
| Others | |||
| Region | Africa | By Country | South Africa |
| Rest-of-Africa | |||
| Asia-Pacific | By Country | Australia | |
| China | |||
| India | |||
| Japan | |||
| New Zealand | |||
| South Korea | |||
| Rest-of-APAC | |||
| Europe | By Country | Austria | |
| Belgium | |||
| Czech Republic | |||
| Denmark | |||
| Finland | |||
| France | |||
| Germany | |||
| Italy | |||
| Luxembourg | |||
| Netherlands | |||
| Norway | |||
| Poland | |||
| Spain | |||
| Sweden | |||
| Switzerland | |||
| UK | |||
| Rest-of-Europe | |||
| Middle East | By Country | Saudi Arabia | |
| United Arab Emirates | |||
| Rest-of-Middle East | |||
| North America | By Country | Canada | |
| Mexico | |||
| US | |||
| Rest-of-North America | |||
| South America | By Country | Argentina | |
| Brazil | |||
| Rest-of-South America | |||


Market Definition
- By Application Type - E-bikes considered under this segment include city/urban, trekking, and cargo/utility e-bikes. The common types of e-bikes under these three categories include off-road/hybrid, kids, ladies/gents, cross, MTB, folding, fat tire, and sports e-bike.
- By Battery Type - This segment includes lithium-ion batteries, lead-acid batteries, and other battery types. The other battery type category includes nickel-metal hydroxide (NiMH), silicon, and lithium-polymer batteries.
- By Propulsion Type - Speed pedelec are considered under the scope of this segment. These e-bikes are integrated with an electric motor which deliver power of approximately 500 W and more. The speed limit of such e-bikes are generally 45 km/h (28 mph) in most of the countries.
| Keyword | Definition |
|---|---|
| Pedal Assisted | Pedal-assist or pedelec category refers to the electric bikes that provide limited power assistance through torque-assist system and do not have throttle for varying the speed. The power from the motor gets activated upon pedaling in these bikes and reduces human efforts. |
| Throttle Assisted | Throttle-based e-bikes are equipped with the throttle assistance grip, installed on the handlebar, similarly to motorbikes. The speed can be controlled by twisting the throttle directly without the need to pedal. The throttle response directly provides power to the motor installed in the bicycles and speeds up the vehicle without paddling. |
| Speed Pedelec | Speed pedelec is e-bikes similar to pedal-assist e-bikes as they do not have throttle functionality. However, these e-bikes are integrated with an electric motor which delivers power of approximately 500 W and more. The speed limit of such e-bikes is generally 45 km/h (28 mph) in most of the countries. |
| City/Urban | The city or urban e-bikes are designed with daily commuting standards and functions to be operated within the city and urban areas. The bicycles include various features and specifications such as comfortable seats, sit upright riding posture, tires for easy grip and comfortable ride, etc. |
| Trekking | Trekking and mountain bikes are special types of e-bikes that are designed for special purposes considering the robust and rough usage of the vehicles. These bicycles include a strong frame, and wide tires for better and advanced grip and are also equipped with various gear mechanisms which can be used while riding in different terrains, rough grounded, and tough mountainous roads. |
| Cargo/Utility | The e-cargo or utility e-bikes are designed to carry various types of cargo and packages for shorter distances such as within urban areas. These bikes are usually owned by local businesses and delivery partners to deliver packages and parcels at very low operational costs. |
| Lithium-ion Battery | A Li-ion battery is a rechargeable battery, which uses lithium and carbon as its constituent materials. The Li-Ion batteries have a higher density and lesser weight than sealed lead acid batteries and provide the rider with more range per charge than other types of batteries. |
| Lead Acid Battery | A lead acid battery refers to sealed lead acid battery having a very low energy-to-weight and energy-to-volume ratio. The battery can produce high surge currents, owing to its relatively high power-to-weight ratio as compared to other rechargeable batteries. |
| Other Batteries | This includes electric bikes using nickel–metal hydroxide (NiMH), silicon, and lithium-polymer batteries. |
| Business-to-Business (B2B) | The sales of e-bikes to business customers such as urban fleet and logistics company, rental/sharing operators, last-mile fleet operators, and corporate fleet operators are considered under this category. |
| Business-to-Customers (B2C) | The sales of electric scooters and motorcycles to direct consumers is considered under this category. The consumers acquire these vehicles either directly from manufacturers or from other distributers and dealers through online and offline channel. |
| Unorganized Local OEMs | These players are small local manufacturers and assemblers of e-bikes. Most of these manufacturers import the components from China and Taiwan and assemble them locally. They offer the product at low cost in this price sensitive market which give them advantage over organized manufacturers. |
| Battery-as-a-Service | A business model in which the battery of an EV can be rented from a service provider or swapped with another battery when it runs out of charge |
| Dockless e-Bikes | Electric bikes that have self-locking mechanisms and a GPS tracking facility with an average top speed of around 15mph. These are mainly used by bike-sharing companies such as Bird, Lime, and Spin. |
| Electric Vehicle | A vehicle which uses one or more electric motors for propulsion. Includes cars, scooters, buses, trucks, motorcycles, and boats. This term includes all-electric vehicles and hybrid electric vehicles |
| Plug-in EV | An electric vehicle that can be externally charged and generally includes all-electric vehicles as well as plug-in hybrids. In this report we use the term for all-electric vehicles to differentiate them from plug-in hybrid electric vehicles. |
| Lithium-Sulphur Battery | A rechargeable battery that replaces the liquid or polymer electrolyte found in current lithium-ion batteries with sulfur. They have more capacity than Li-ion batteries. |
| Micromobility | Micromobility is one of the many modes of transport involving very-light-duty vehicles to travel short distances. These means of transportation include bikes, e-scooters, e-bikes, mopeds, and scooters. Such vehicles are used on a sharing basis for covering short distances, usually five miles or less. |
| Low Speed Electric Vehicls (LSEVs) | They are low speed (usually less than 25 kmph) light vehicles that do not have an internal combustion engine, and solely use electric energy for propulsion. |


Research Methodology
Mordor Intelligence follows a four-step methodology in all its reports.
- Step-1: Identify Key Variables: To build a robust forecasting methodology, the variables and factors identified in Step-1 are tested against available historical market numbers. Through an iterative process, the variables required for market forecast are set and the model is built based on these variables.
- Step-2: Build a Market Model: Market-size estimations for the historical and forecast years have been provided in revenue and volume terms. Market revenue is calculated by multiplying the volume demand with volume-weighted average battery pack price (per kWh). Battery pack price estimation and forecast takes into account various factors affecting ASP, such as inflation rates, market demand shifts, production costs, technological developments, and consumer preferences, providing estimations for both historical data and future trends.
- Step-3: Validate and Finalize: In this important step, all market numbers, variables, and analyst calls are validated through an extensive network of primary research experts from the market studied. The respondents are selected across levels and functions to generate a holistic picture of the market studied.
- Step-4: Research Outputs: Syndicated Reports, Custom Consulting Assignments, Databases & Subscription Platforms


