Market Overview
| Study Period | 2020 - 2031 |
|---|---|
| Forecast Data Period | 2026 - 2031 |
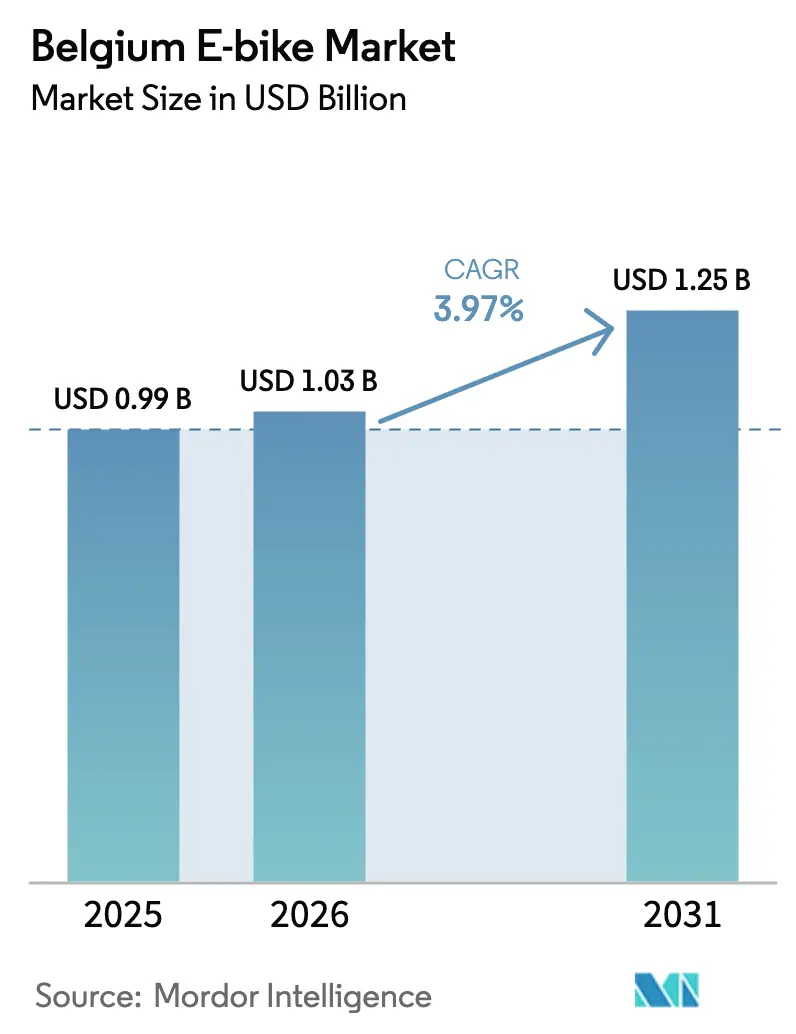
| Base Year Market Size (2025) | USD 0.99 Billion |
| Market Size (2026) | USD 1.03 Billion |
| Market Size (2031) | USD 1.25 Billion |
| Growth Rate (2026 - 2031) | 3.97% CAGR |
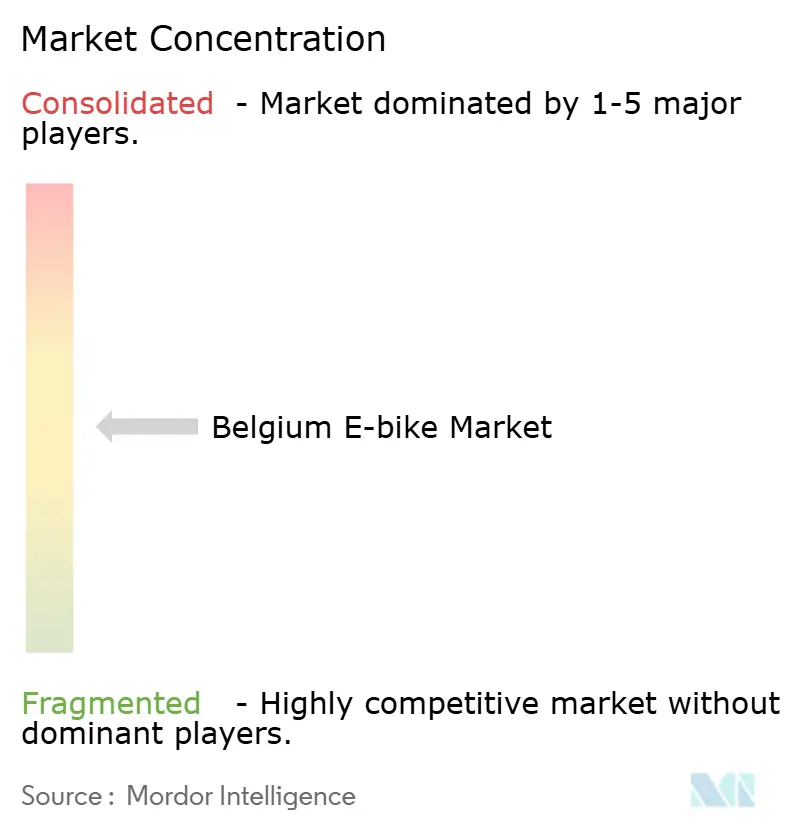
| Market Concentration | Medium |
Major Players*Disclaimer: Major Players sorted in no particular order Image © Mordor Intelligence. Reuse requires attribution under CC BY 4.0. | |
Belgium E-bike Market Analysis by Mordor Intelligence
The Belgium E-bike market size is expected to grow from USD 0.99 billion in 2025 to USD 1.03 billion in 2026 and is forecast to reach USD 1.25 billion by 2031 at 3.97% CAGR over 2026-2031. Steady expansion stems from multi-layered tax incentives, a dense protected-cycle network, and consistent fuel-price pressure that keeps electric two-wheelers attractive for trips between 5 km and 15 km. The regulatory split between 25 km/h pedelecs and 45 km/h speed pedelecs has nurtured distinct sub-segments. At the same time, a five-year extension of EU anti-dumping duties on Chinese imports reshapes sourcing strategies toward European assemblers. Government-backed leasing for federal civil servants and teachers is normalizing E-bike subscriptions, and a fast-maturing second-hand ecosystem encourages short renewal cycles that accelerate technology refresh. At the product level, high-capacity 1,400 Wh batteries and mid-drive motor-gearbox units illustrate how the Belgian E-bike market is pivoting from early adoption toward premium performance positioning.
Key Report Takeaways
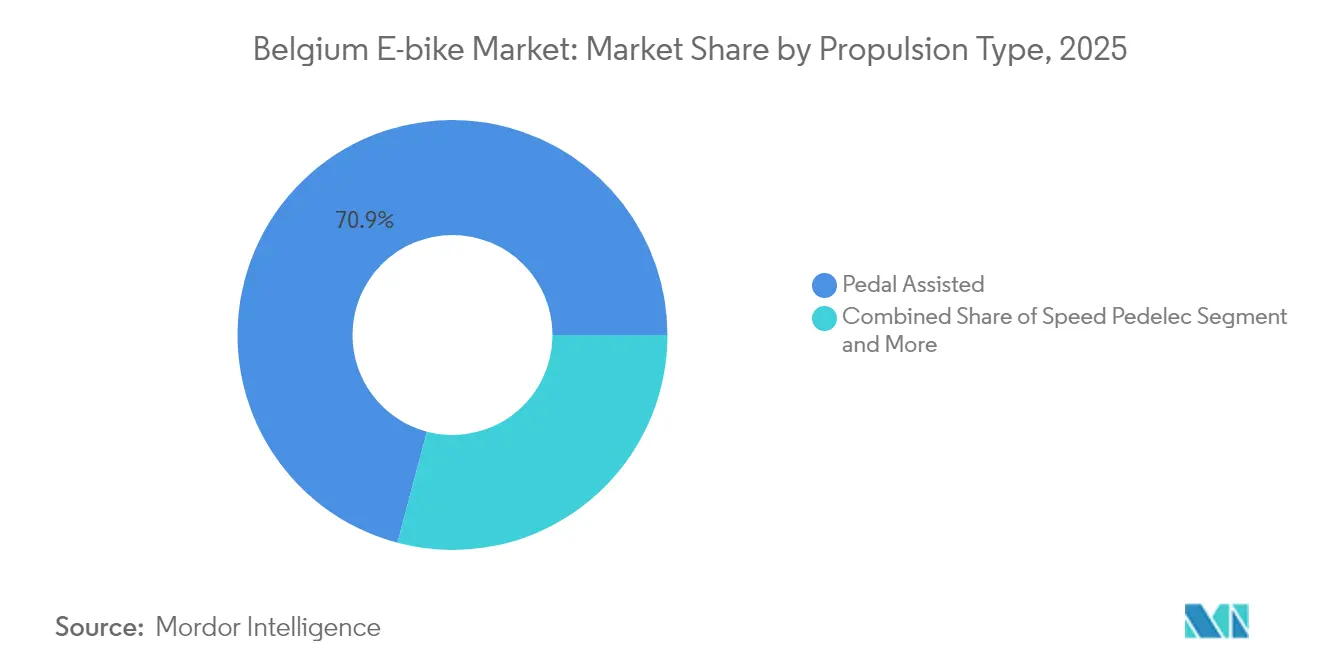
- By propulsion type, pedal-assist systems led with 70.88% of the Belgian E-bike market share in 2025; speed pedelecs are projected to register a 4.02% CAGR through 2031.
- By application type, city/urban models accounted for 64.05% of the Belgium E-bike market size in 2025, while cargo/utility variants are expected to grow at a 4.06% CAGR to 2031.
- By battery type, lithium-ion systems captured 87.35% of the Belgian e-bike market share in 2025 and are advancing at a 4.09% CAGR through 2031.
- By motor placement, hub motors held 56.05% of the Belgian e-bike market share in 2025, while mid-drive systems are forecast to expand at a 4.13% CAGR through 2031.
- By drive system, chain drives commanded 82.95% of 2025 revenue, whereas belt-drive configurations are projected to record the fastest 3.99% CAGR to 2031.
- By motor power, the less than 250 W class represented 66.58% of the Belgian E-bike market size in 2025 and 351–500 W is forecast to expand at 4.16% CAGR over 2026-2031.
- By price band, the USD 1,500–2,499 bracket accounted for 39.45% of the Belgium E-bike market size in 2025; models priced USD 2,500–3,499 are expected to grow at a 4.10% CAGR over 2026-2031.
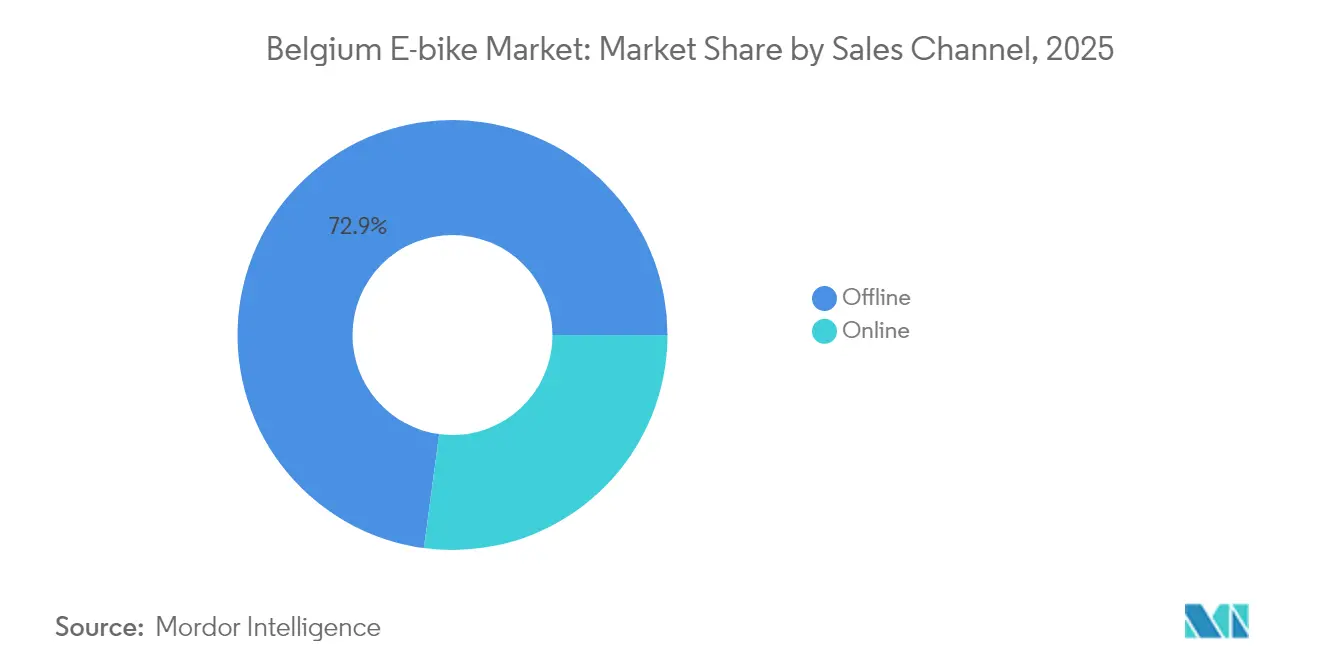
- By sales channel, offline retail maintained 72.88% of 2025 revenue, yet online direct-to-consumer platforms will post a 4.01% CAGR to 2031.
- By end use, personal & family applications captured 63.02% of 2025 demand, while commercial delivery fleets are set to register the highest 4.03% CAGR during the forecast window.
Note: Market size and forecast figures in this report are generated using Mordor Intelligence’s proprietary estimation framework, updated with the latest available data and insights as of 2026.
Belgium E-bike Market Trends and Insights
Drivers Impact Analysis*
| Driver | (~) % Impact on CAGR Forecast | Geographic Relevance | Impact Timeline |
|---|---|---|---|
| Government Purchase Incentives | 0.8% | National, with regional variations in Flanders, Wallonia, Brussels | Medium term (2-4 years) |
| Corporate Mobility-Budget Reforms | 0.7% | National, federal civil servants and education sectors | Medium term (2-4 years) |
| Protected Cycling Infrastructure | 0.6% | National, concentrated in Flanders cycle highway network | Long term (≥ 4 years) |
| Rising Fuel Prices Shifting Commuters | 0.5% | National, urban concentration | Short term (≤ 2 years) |
| Battery-Leasing and Circular-Economy | 0.4% | National, with urban pilot concentration | Medium term (2-4 years) |
| Micro-Hub Speed-Pedelec Logistics | 0.3% | Urban areas, concentrated in Brussels, Antwerp, Ghent | Short term (≤ 2 years) |
| Source: Mordor Intelligence | |||


Government Purchase Incentives For E-Bikes
Stackable subsidies lower out-of-pocket prices by two-fifths when federal mileage allowances of EUR 0.35 per kilometer combine with Flanders’ zero-emission grants highly and Brussels’ Bruxell’Air trade-in vouchers capped [1]“Vademecum Fietsvoorzieningen,” Flemish Government, Flemishgov.be . Municipal schemes, like Wanze's income-graded rebate, broaden eligibility, enabling price-sensitive riders to tap into the Belgian E-bike market sooner. Recently, an expansion of leasing to a significant number of civil servants and education employees has substantially boosted institutional demand, increasing the leasing share of new speed-pedelec registrations. Walloon employers, by claiming identical rebates as individuals, can unlock fleet programs without incurring heavy capital expenses. This intricate structure not only expands the total addressable market but also nurtures predictable multi-year replacement cycles, bolstering supply-chain investments.
Corporate Mobility-Budget Reforms Boosting Fleet Leasing
In 2024, a royal decree allowed federal ministries to offer bicycle leasing as an alternative to company cars. This move significantly boosted the adoption of leased speed-pedelec contracts. The lease packages, which bundle insurance, maintenance, and helmets into a single net salary deduction, have minimized user friction and hastened conversions. Bizbike BV expanded its operations by adding several regional delivery hubs to cater to its growing fleet. Meanwhile, heightened competition among suppliers for service bundles has led to a noticeable reduction in monthly costs compared to the previous year. Vehicles returning from their leases have bolstered a second-hand market channel, which has experienced considerable growth. This channel now provides more affordable units to students and retirees, broadening Belgium's E-bike market appeal beyond just premium buyers.
Expansion Of Protected Cycling Infrastructure
Flanders has established an extensive cycle-highway grid that connects major cities like Antwerp, Ghent, Bruges, and Brussels. These dedicated lanes, designed for high-speed pedelecs in accordance with Vademecum Fietsvoorzieningen guidelines, keep users safe from high-speed traffic. Recent upgrades to the Brussels Ring and the North Sea Port corridor have significantly reduced commute times, encouraging professionals to shift their travel modes. The Bovenlokaal Functioneel Fietsroutenetwerk integrates smaller communes into the main network, ensuring that most door-to-door journeys are safeguarded. To combat theft anxiety—highlighted as a major purchasing concern in recent user surveys—subsidies now cover a substantial portion of the costs for secure public-access bike parking. These infrastructural enhancements not only increase daily usage but also elevate residual values, creating a positive feedback loop for the Belgian E-bike market.
Rising Fuel Prices Shifting Commuters To E-Bikes
Unleaded prices averaged EUR 1.83 per liter in 2024, more than one-tenth above the ten-year mean, encouraging commuters on 5–15 km routes to swap cars for pedelecs [2]“Monthly Fuel Price Statistics 2024,” FPS Finance Belgium, fpsfinance.be . Cost savings compound because electricity enjoys a minimal VAT while fossil fuels are subject to a fair VAT. Survey data from the Brussels Environmental Agency show that users who purchase an e-bike cut car trips by two-fifths and public transport rides by one-fourth during the first six months. Topographic hurdles in hilly Wallonia once deterred adoption; torque-rich mid-drive motors now flatten gradients and invite broader demographics. Employers revising mobility budgets increasingly match kilometer allowances for bike use to company-car stipends, institutionalizing e-bikes as an equal benefit class inside compensation schemes.
Restraints Impact Analysis*
| Restraint | (~) % Impact on CAGR Forecast | Geographic Relevance | Impact Timeline |
|---|---|---|---|
| High Upfront Cost | -0.4% | National, particularly affecting price-sensitive segments | Short term (≤ 2 years) |
| Limited Public Charging Infrastructure | -0.3% | National, with urban concentration gaps | Medium term (2-4 years) |
| Stricter Speed-Pedelec Helmet Rules | -0.2% | National, with higher impact in Flanders due to higher adoption | Long term (≥ 4 years) |
| Component Supply Volatility | -0.2% | EU-wide, affecting Belgian importers and manufacturers | Short term (≤ 2 years) |
| Source: Mordor Intelligence | |||
High Upfront Cost Versus Regular Bicycles
In Belgium, the average retail price for a standard pedelec is relatively high. When factoring in additional costs such as registration, insurance, and helmet compliance, the price for a speed pedelec becomes significantly more expensive. In contrast, conventional bikes are much more affordable, creating a substantial price gap that subsidies only partially address. Many first-time buyers fail to account for the hidden expense of battery replacement, which becomes necessary after a few years of use. Although Chinese brands have the potential to make e-bikes more affordable, anti-dumping penalties significantly increase their costs, limiting their impact. This high cost barrier drives students and low-income workers to opt for refurbished second-hand units or rental models, which restricts the growth of full-price e-bike sales in Belgium in the short term.
Limited Public Charging & Service Infrastructure
Belgium counted fewer than 20 public fast-charge outlets dedicated to light electric vehicles at the end of 2024, with Smappee’s 18-dock site in Dendermonde serving as a rare showcase [3]“Public Charging Projects 2024,” Smappee, smappee.com . Sparse coverage forces commuters to rely on home sockets, complicating usage for apartment dwellers. Service availability also lags: only one-fourth of independent bicycle shops possess technicians trained for CAN bus diagnostics and battery cell balancing. Touring’s mobile maintenance partnership with Origine mitigates downtime but reaches just six provinces. Speed-pedelec servicing is further constrained by moped-class rules, requiring certified mechanics and specialized insurance. Range anxiety and repair bottlenecks will temper the Belgian E-bike market’s otherwise favorable trajectory unless roll-out matches unit sales.
*Our forecasts treat driver/restraint impacts as directional, not additive. The impact forecasts reflect baseline growth, mix effects, and variable interactions.
Segment Analysis
By Propulsion Type: Speed Pedelecs Drive Premium Growth
The propulsion split shows pedal-assist units at 70.88% of 2025 shipments, anchoring mass-market acceptance due to legal parity with bicycles under 25 km/h. Speed pedelecs claimed 4.02% growth till 2031, confirming their status as the premium edge of the Belgium E-bike market size for commuters demanding 45 km/h capability. Though throttle-assist units hold niche status, they remain essential for riders requiring full electric propulsion.
Leasing represents the majority of new speed-pedelec contracts, proving the format’s fit for higher price points. A helmet-usage compliance rate indicates users accept stricter safety rules when performance benefits are tangible. With second-hand volumes expanding significantly, fleet turnover enriches affordability and accelerates technological trickle-down to lower tiers of the Belgian E-bike market.


By Application Type: Cargo Utility Transforms Urban Logistics
City and urban commuters account for 64.05% of 2025 revenue, underlining the country’s dense metropolitan settlement pattern. Cargo and utility models, however, are charting a 4.06% CAGR to 2031 as last-mile operations chase operational gains.
Cargo bikes deliver 28% more parcels per hour than vans in congested zones. Initiatives like bpost’s order for 168 trailer-assisted units and Urbike’s 442,000 deliveries show institutional confidence. EU low-emission regulations tilt cities toward electric cargo fleets, giving the Belgian E-bike market a commercial pivot that broadens average selling price and stabilizes weekday utilization rates.
By Battery Type: Lithium-Ion Dominance Accelerates
Lithium-ion packs supplied 87.35% of 2025 units and track the fastest sub-segment CAGR at 4.09%, buttressed by volumetric energy density improvements that now reach 1,400 Wh on premium models. Lead-acid’s residual niche is deteriorating, while early solid-state prototypes wait for cost breakthroughs.
Battery leasing trials offset EUR 600 (USD 694) replacement shocks and align with circular-economy goals by repurposing modules for stationary storage. Harmonization through IEC/TC 21’s adoption of EN 50604-1 sharpens safety compliance, lowering global homologation costs and reinforcing lithium-ion’s long-term moat in the Belgian E-bike market.
By Motor Placement: Mid-Drive Innovation Challenges Hub Dominance
Rear-hub drives still dominate with a 56.05% share due to cost and retrofit simplicity. Mid-drive systems outperform on hill climbs and center of gravity, fueling a 4.13% CAGR through 2031. Riese & Müller’s Pinion Motor Gearbox Unit raises the legal-speed ceiling to 45 km/h while trimming maintenance intervals, making mid-drive the performance benchmark.
Belt-drive pairings amplify cleanliness and longevity, a decisive edge for fleets logging 10,000 km annually. These traits resonate in the Belgian E-bike market, where varied gradients and all-weather commuting demand robust drivetrains.

By Drive Systems: Belt Drive Gains Premium Traction
Chains remain ubiquitous, accounting for 82.95% of 2025 shipments, yet belt drives are growing at a 3.99% CAGR. Commuters in Flanders cite freedom from grease and quarterly tension checks as major satisfiers. Internal-gear hubs sealed against spray add winter durability, explaining why speed pedelecs sold in 2025’s opening quarter carried belts.
Fleet managers experience reduced downtime and enjoy significant savings on consumables after transitioning to belts. This shift further bolsters the cost-of-ownership argument, which continues to uphold premium pricing in Belgium's E-bike market.
By Motor Power: Mid-Range Power Gains Commercial Appeal
EU regulations lock mainstream pedelecs at 250 W, accounting for 66.58% of 2025 deliveries. The 351-500 W class, registered as speed pedelecs, is expanding fastest at 4.16% due to commercial logistics and hilly commuter corridors. Above-600 W units serve specialized heavy-cargo roles but illustrate how Belgium’s nuanced registration regime underpins power diversity unmatched elsewhere in Europe.
As cargo payload expectations rise and the legal speed limit hits 45 km/h, mid-power motors are set to replace lower-tier hubs in Belgium's e-bike market. This shift is driven by the increasing demand for efficient and high-performance e-bikes, catering to both urban commuters and logistics applications. The trend is projected to continue until 2030, supported by advancements in motor technology and growing consumer preference for enhanced e-bike capabilities.
By Price Band: Premium Segments Drive Value Growth
Units priced USD 1,500–2,499 held 39.45% share in 2025, striking a balance between torque and affordability. Yet the USD 2,500–3,499 band is on a 4.10% CAGR that mirrors consumer appetite for larger batteries and connectivity suites. Corporate leasing unlocks taxable benefits that make USD 3,500-5,999 speed pedelecs attainable, lifting blend ASP across the Belgium E-bike market.
Test-Aankoop has named its top-rated commuter model for 2024. This highlights a growing trend in the market, where consumers demonstrate a willingness to pay a premium when the product's feature set justifies the cost. The model's recognition reflects the increasing importance of value-driven purchasing decisions among mainstream buyers.
By Sales Channel: Online Growth Challenges Traditional Retail
While brick-and-mortar (offline) showrooms commanded 72.88% of turnover in 2025, digital natives like Cowboy used social-media outreach and doorstep test rides to post double-digit order growth, pushing e-commerce to a 4.01% CAGR. Omnichannel hybrids thrive: physical stores partner with web shops for inventory visibility and same-day service slots.
In Belgium's E-bike market, where unit values are high and ownership models prioritize service, mobile repair fleets play a crucial role in bridging trust gaps for online purchases. These fleets not only enhance customer confidence but also provide convenient after-sales support, which is essential for maintaining customer satisfaction in a service-driven market.
By End Use: Commercial Delivery Transforms Market Dynamics
Personal and family riders absorbed 63.02% of 2025 demand, reflecting entrenched leisure and commuting patterns. Commercial delivery, however, is scaling at 4.03% CAGR as cargo bikes clock significantly faster drop rates than vans during congestion.
Regulated low-emission zones in Antwerp and Brussels funnel subsidies and curb-access to electric fleets, making cargo E-bikes the preferred last-mile tool and reinforcing volume resilience in the Belgian E-bike market through 2031.
Geography Analysis
As of early 2025, Flanders leads in both speed-pedelec registrations and second-hand listings, driven by its extensive network of protected lanes spanning thousands of kilometers and the availability of province-level subsidies. During the previous year, East Flanders experienced significant growth in new unit sales, while West Flanders faced a substantial decline, highlighting disparities in the dealer network that require strategic adjustments.
Wallonia and Brussels are making notable progress in catching up. Wallonia is encouraging small-business cargo adoption through generous zero-emission grants for employers, and Liège has significantly increased its total pedelec count in the initial months of 2025. Meanwhile, Brussels is actively promoting E-bike usage through its Bruxell’Air credits, which incentivize residents to deregister cars. This initiative has contributed to a considerable rise in E-bike usage during peak commuting hours.
EU anti-dumping duties, which impose varying rates, are prompting a shift towards sourcing from European assemblers. This development positions Belgium as a key testing ground for premium speed-pedelec technology, which is expected to expand into larger markets such as France and Germany. Additionally, cross-border commuters benefit from Belgium's more lenient speed regulations for pedelecs, which allow higher speeds compared to stricter limits in neighboring countries like the Netherlands. This regulatory advantage continues to drive demand for higher-powered models within Belgium's E-bike market.
Competitive Landscape
The supplier field remains moderately fragmented. Domestic innovators such as Cowboy, Ellio, and Oxford contribute a significant share of the market's unit shipments. Meanwhile, Germany’s Riese & Müller, Gazelle, and Kettler focus on competing through high-spec production. In a notable development, French firm Rebirth acquired a majority stake in Cowboy in September 2025, highlighting a trend of inbound consolidation that emphasizes the value of Belgian regulatory expertise and direct-to-consumer strategies.
Technology stands out as the key differentiator. Premium brands distinguish themselves with advanced features, including high-capacity batteries, integrated motor-gearbox units, and smartphone-linked theft protection. The competition in service coverage is intensifying: Origine-Touring offers mobile workshops with rapid repair services, while Bizbike strengthens customer loyalty through a subscription model that incorporates maintenance into regular fees.
Pilots in the circular economy are repurposing lease-return batteries for stationary storage, creating additional revenue streams while enhancing their ESG credentials. Companies already adhering to stringent quality controls are expected to benefit from harmonized standards under IEC/TC 21, which will reduce compliance challenges and favor agile European manufacturers in Belgium's E-bike market.
Belgium E-bike Industry Leaders
Accell België
Belgian Cycling Factory
Cowboy
Pon Holdings B.V
Royal Dutch Gazelle
- *Disclaimer: Major Players sorted in no particular order

Recent Industry Developments
- January 2025: Velofollies 2025 hosted 300-plus exhibitors across 40,000 m² in Kortrijk, spotlighting extended-range batteries and 20-minute fast-charge modules.
- September 2024: The European Commission adopted Regulation (EU) 2024/2206, extending anti-dumping duties on Chinese E-bike imports by five years.
- September 2024: Cowboy secured EUR 5 million in Series C funding led by Cypress Capital to accelerate global expansion and target full-year profitability in 2025.


Belgium E-bike Market Report Scope
Pedal Assisted, Speed Pedelec, Throttle Assisted are covered as segments by Propulsion Type. Cargo/Utility, City/Urban, Trekking are covered as segments by Application Type. Lead Acid Battery, Lithium-ion Battery, Others are covered as segments by Battery Type.By Propulsion Type
| Pedal Assisted |
| Speed Pedelec |
| Throttle Assisted |
By Application Type
| Cargo/Utility |
| City/Urban |
| Trekking/Mountain |
By Battery Type
| Lead Acid Battery |
| Lithium-ion Battery |
| Others |
By Motor Placement
| Hub (front/rear) |
| Mid-drive |
By Drive Systems
| Chain Drive |
| Belt Drive |
By Motor Power
| Less than 250 W |
| 250–350 W |
| 351–500 W |
| 501–600 W |
| More than 600 W |
By Price Band
| Up to USD 1 000 |
| USD 1 000–1 499 |
| USD 1 500–2 499 |
| USD 2 500–3 499 |
| USD 3 500–5 999 |
| Above USD 6 000 |
By Sales Channel
| Online | |
| Offline | Specialized E-Bike Retailers |
| Traditional Bike Shops | |
| Department Stores & Sporting Goods Chains |
By End Use
| Commercial Delivery | Retail & Goods Delivery |
| Food & Beverage Delivery | |
| Service Providers | |
| Personal & Family Use | |
| Institutional | |
| Others |
| By Propulsion Type | Pedal Assisted | |
| Speed Pedelec | ||
| Throttle Assisted | ||
| By Application Type | Cargo/Utility | |
| City/Urban | ||
| Trekking/Mountain | ||
| By Battery Type | Lead Acid Battery | |
| Lithium-ion Battery | ||
| Others | ||
| By Motor Placement | Hub (front/rear) | |
| Mid-drive | ||
| By Drive Systems | Chain Drive | |
| Belt Drive | ||
| By Motor Power | Less than 250 W | |
| 250–350 W | ||
| 351–500 W | ||
| 501–600 W | ||
| More than 600 W | ||
| By Price Band | Up to USD 1 000 | |
| USD 1 000–1 499 | ||
| USD 1 500–2 499 | ||
| USD 2 500–3 499 | ||
| USD 3 500–5 999 | ||
| Above USD 6 000 | ||
| By Sales Channel | Online | |
| Offline | Specialized E-Bike Retailers | |
| Traditional Bike Shops | ||
| Department Stores & Sporting Goods Chains | ||
| By End Use | Commercial Delivery | Retail & Goods Delivery |
| Food & Beverage Delivery | ||
| Service Providers | ||
| Personal & Family Use | ||
| Institutional | ||
| Others | ||


Market Definition
- By Application Type - E-bikes considered under this segment include city/urban, trekking, and cargo/utility e-bikes. The common types of e-bikes under these three categories include off-road/hybrid, kids, ladies/gents, cross, MTB, folding, fat tire, and sports e-bike.
- By Battery Type - This segment includes lithium-ion batteries, lead-acid batteries, and other battery types. The other battery type category includes nickel-metal hydroxide (NiMH), silicon, and lithium-polymer batteries.
- By Propulsion Type - E-bikes considered under this segment include pedal-assisted e-bikes, throttle-assisted e-bikes, and speed pedelec. While the speed limit of pedal and throttle-assisted e-bikes is usually 25 km/h, the speed limit of speed pedelec is generally 45 km/h (28 mph).
| Keyword | Definition |
|---|---|
| Pedal Assisted | Pedal-assist or pedelec category refers to the electric bikes that provide limited power assistance through torque-assist system and do not have throttle for varying the speed. The power from the motor gets activated upon pedaling in these bikes and reduces human efforts. |
| Throttle Assisted | Throttle-based e-bikes are equipped with the throttle assistance grip, installed on the handlebar, similarly to motorbikes. The speed can be controlled by twisting the throttle directly without the need to pedal. The throttle response directly provides power to the motor installed in the bicycles and speeds up the vehicle without paddling. |
| Speed Pedelec | Speed pedelec is e-bikes similar to pedal-assist e-bikes as they do not have throttle functionality. However, these e-bikes are integrated with an electric motor which delivers power of approximately 500 W and more. The speed limit of such e-bikes is generally 45 km/h (28 mph) in most of the countries. |
| City/Urban | The city or urban e-bikes are designed with daily commuting standards and functions to be operated within the city and urban areas. The bicycles include various features and specifications such as comfortable seats, sit upright riding posture, tires for easy grip and comfortable ride, etc. |
| Trekking | Trekking and mountain bikes are special types of e-bikes that are designed for special purposes considering the robust and rough usage of the vehicles. These bicycles include a strong frame, and wide tires for better and advanced grip and are also equipped with various gear mechanisms which can be used while riding in different terrains, rough grounded, and tough mountainous roads. |
| Cargo/Utility | The e-cargo or utility e-bikes are designed to carry various types of cargo and packages for shorter distances such as within urban areas. These bikes are usually owned by local businesses and delivery partners to deliver packages and parcels at very low operational costs. |
| Lithium-ion Battery | A Li-ion battery is a rechargeable battery, which uses lithium and carbon as its constituent materials. The Li-Ion batteries have a higher density and lesser weight than sealed lead acid batteries and provide the rider with more range per charge than other types of batteries. |
| Lead Acid Battery | A lead acid battery refers to sealed lead acid battery having a very low energy-to-weight and energy-to-volume ratio. The battery can produce high surge currents, owing to its relatively high power-to-weight ratio as compared to other rechargeable batteries. |
| Other Batteries | This includes electric bikes using nickel–metal hydroxide (NiMH), silicon, and lithium-polymer batteries. |
| Business-to-Business (B2B) | The sales of e-bikes to business customers such as urban fleet and logistics company, rental/sharing operators, last-mile fleet operators, and corporate fleet operators are considered under this category. |
| Business-to-Customers (B2C) | The sales of electric scooters and motorcycles to direct consumers is considered under this category. The consumers acquire these vehicles either directly from manufacturers or from other distributers and dealers through online and offline channel. |
| Unorganized Local OEMs | These players are small local manufacturers and assemblers of e-bikes. Most of these manufacturers import the components from China and Taiwan and assemble them locally. They offer the product at low cost in this price sensitive market which give them advantage over organized manufacturers. |
| Battery-as-a-Service | A business model in which the battery of an EV can be rented from a service provider or swapped with another battery when it runs out of charge |
| Dockless e-Bikes | Electric bikes that have self-locking mechanisms and a GPS tracking facility with an average top speed of around 15mph. These are mainly used by bike-sharing companies such as Bird, Lime, and Spin. |
| Electric Vehicle | A vehicle which uses one or more electric motors for propulsion. Includes cars, scooters, buses, trucks, motorcycles, and boats. This term includes all-electric vehicles and hybrid electric vehicles |
| Plug-in EV | An electric vehicle that can be externally charged and generally includes all-electric vehicles as well as plug-in hybrids. In this report we use the term for all-electric vehicles to differentiate them from plug-in hybrid electric vehicles. |
| Lithium-Sulphur Battery | A rechargeable battery that replaces the liquid or polymer electrolyte found in current lithium-ion batteries with sulfur. They have more capacity than Li-ion batteries. |
| Micromobility | Micromobility is one of the many modes of transport involving very-light-duty vehicles to travel short distances. These means of transportation include bikes, e-scooters, e-bikes, mopeds, and scooters. Such vehicles are used on a sharing basis for covering short distances, usually five miles or less. |
| Low Speed Electric Vehicls (LSEVs) | They are low speed (usually less than 25 kmph) light vehicles that do not have an internal combustion engine, and solely use electric energy for propulsion. |


Research Methodology
Mordor Intelligence follows a four-step methodology in all its reports.
- Step-1: Identify Key Variables: To build a robust forecasting methodology, the variables and factors identified in Step-1 are tested against available historical market numbers. Through an iterative process, the variables required for market forecast are set and the model is built based on these variables.
- Step-2: Build a Market Model: Market-size estimations for the historical and forecast years have been provided in revenue and volume terms. Market revenue is calculated by multiplying the volume demand with volume-weighted average battery pack price (per kWh). Battery pack price estimation and forecast takes into account various factors affecting ASP, such as inflation rates, market demand shifts, production costs, technological developments, and consumer preferences, providing estimations for both historical data and future trends.
- Step-3: Validate and Finalize: In this important step, all market numbers, variables, and analyst calls are validated through an extensive network of primary research experts from the market studied. The respondents are selected across levels and functions to generate a holistic picture of the market studied.
- Step-4: Research Outputs: Syndicated Reports, Custom Consulting Assignments, Databases & Subscription Platforms


