Market Overview
| Study Period | 2020 - 2031 |
|---|---|
| Forecast Data Period | 2026 - 2031 |
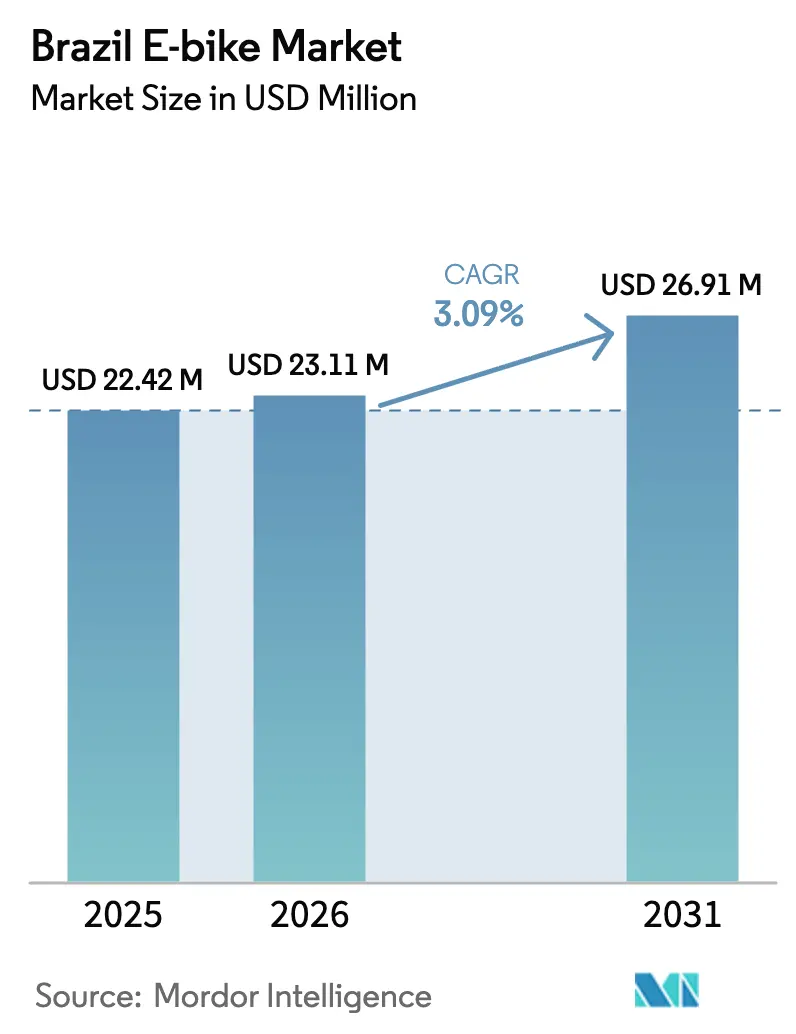
| Base Year Market Size (2025) | USD 22.42 Million |
| Market Size (2026) | USD 23.11 Million |
| Market Size (2031) | USD 26.91 Million |
| Growth Rate (2026 - 2031) | 3.09% CAGR |
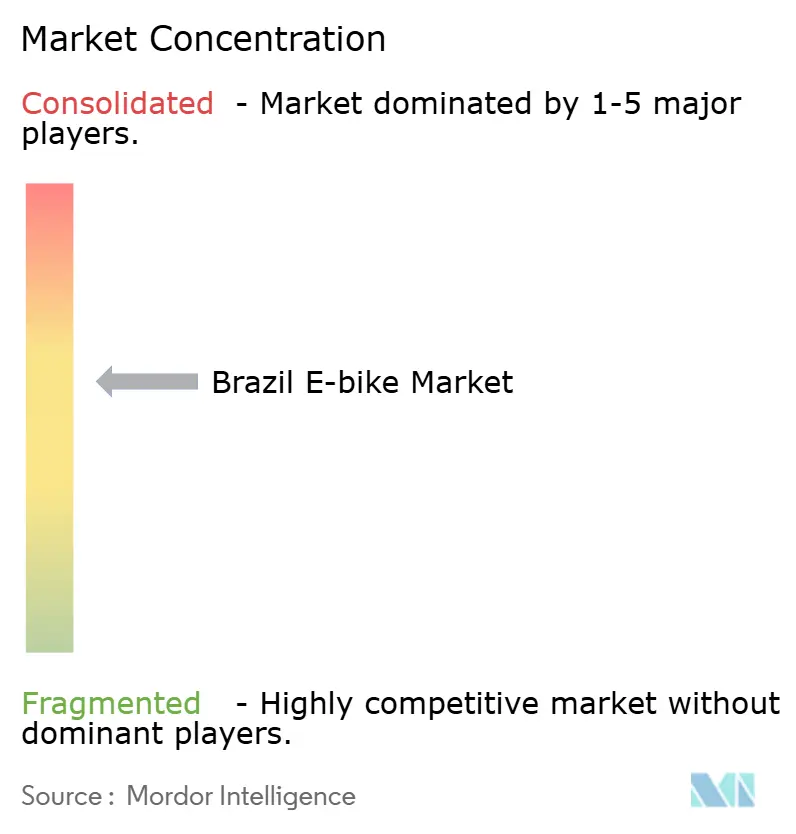
| Market Concentration | Medium |
Major Players *Disclaimer: Major Players sorted in no particular order Image © Mordor Intelligence. Reuse requires attribution under CC BY 4.0. | |
Brazil E-bike Market Analysis by Mordor Intelligence
The Brazil E-bike Market size is expected to grow from USD 22.42 million in 2025 to USD 23.11 million in 2026 and is forecast to reach USD 26.91 million by 2031 at 3.09% CAGR over 2026-2031. Local manufacturing in Manaus is increasing rapidly, replacing high-duty imports and lowering landed costs for mainstream models. Growing corporate fleet adoption, venture capital inflows, and municipal purchase incentives broaden the user base while reinforcing the premium segment. Declining lithium-ion battery pack prices have accelerated unit-level profitability, enabling brands to fit larger packs without proportionate price hikes. Meanwhile, one-third of the duty of fully built imports continues to drive foreign suppliers toward partnerships with Brazilian assemblers, reshaping competitive dynamics and preserving domestic employment.
Key Report Takeaways
- By propulsion type, pedal-assist captured 62.98% of the Brazilian e-bike market share in 2025, while speed-pedelecs are advancing at a 3.15% CAGR through 2031.
- By application, city/urban models held 50.88% of Brazil's e-bike market size in 2025, and cargo/utility platforms are on track for a 3.18% CAGR to 2031.
- By battery type, lithium-ion systems accounted for an 82.96% share of Brazil's e-bike market in 2025 and are set to expand at a 3.29% CAGR by 2031.
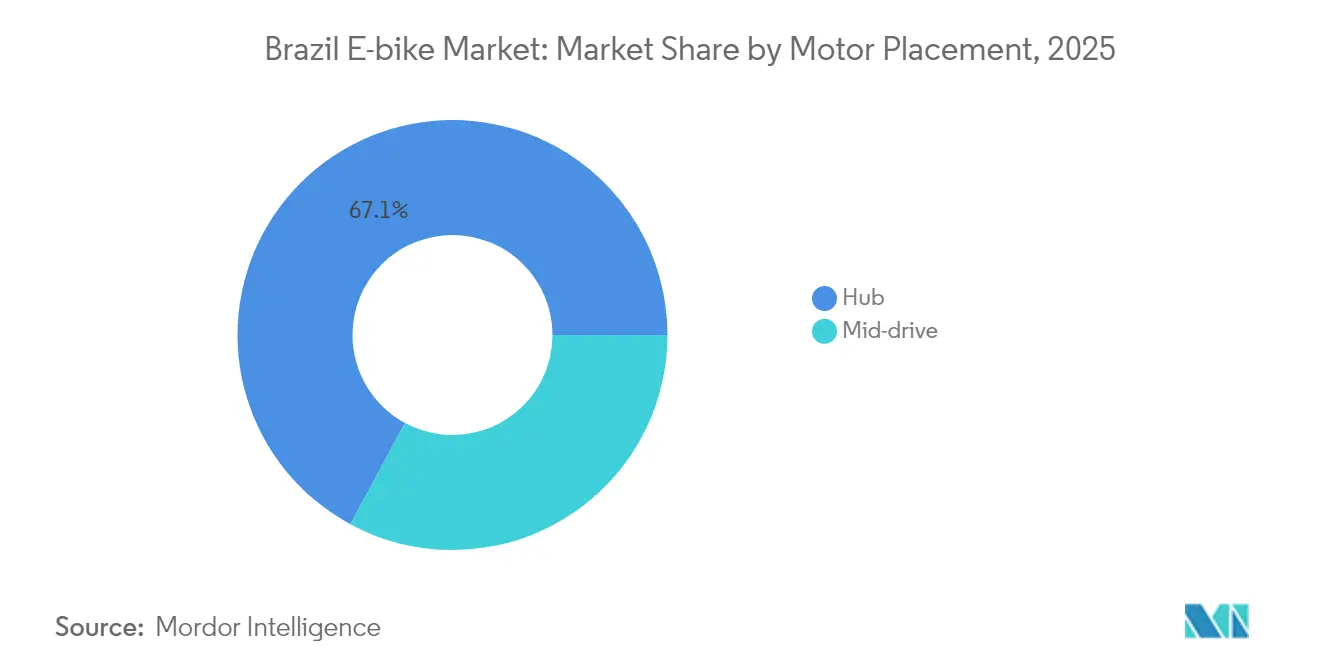
- By motor placement, hub units led with 67.12% of Brazil's e-bike market share in 2025, whereas mid-drive setups exhibit the quickest rise at a 3.16% CAGR through 2031.
- By drive system, chain drives held 72.44% of the Brazilian e-bike market share in 2025, while belt drives recorded the highest projected CAGR at 3.18% through 2031.
- By motor power, sub-250 W units captured 57.02% of the Brazilian e-bike market share in 2025, whereas the 501-600 W class is forecast to expand at a 3.18% CAGR by 2031.
- By price band, models priced at USD 1,000-1,499 commanded 35.21% of the Brazilian e-bike market size in 2025, but the USD 2,500-3,499 tier is advancing fastest at a 3.26% CAGR to 2031.
- By sales channel, offline retail accounted for 60.74% of the Brazilian e-bike market share in 2025, while online platforms are growing at a 3.22% CAGR over the same period.
- By end use, personal and family ownership represented 55.97% of Brazil's e-bike market size in 2025; commercial delivery fleets are pacing fastest with a 3.21% CAGR to 2031.
Note: Market size and forecast figures in this report are generated using Mordor Intelligence’s proprietary estimation framework, updated with the latest available data and insights as of 2026.
Brazil E-bike Market Trends and Insights
Drivers Impact Analysis*
| Driver | (~) % Impact on CAGR Forecast | Geographic Relevance | Impact Timeline |
|---|---|---|---|
| Corporate Adoption for Last-Mile Logistics | +0.9% | Urban centers nationwide, concentrated in Tier-1 cities | Short term (≤ 2 years) |
| Declining Li-Ion Cell Costs | +0.8% | National, with manufacturing concentration in Manaus | Medium term (2-4 years) |
| Subsidy for E-Bike Purchases | +0.6% | São Paulo and Rio metropolitan areas, potential expansion to other capitals | Short term (≤ 2 years) |
| Surging Venture Funding | +0.4% | National, with startup concentration in São Paulo-Rio corridor | Medium term (2-4 years) |
| Local E-Bike Integration | +0.3% | Metropolitan areas with developed public transport, São Paulo and Rio leading | Medium term (2-4 years) |
| Increased Environmental Awareness | +0.2% | National, with higher impact in educated urban demographics | Long term (≥ 4 years) |
| Source: Mordor Intelligence | |||


Corporate Adoption For Last-Mile Logistics (Super-App Deliveries)
Platforms like iFood and 99 are financing fleet purchases and bundling maintenance, making e-bikes a more economical choice than traditional motorcycles for short-distance routes. Delivery apps enter into multiyear agreements, ensuring asset utilization, which in turn boosts resale values and reduces the total cost of ownership. As a result, the commercial delivery segment is expected to grow steadily over the coming years. Motors in the mid-range power class are favored for their ability to manage heavy payloads while staying within regulatory limits. However, fee hikes—such as Rappi’s newly introduced weekly charge—pose a risk to rider margins, a concern brands keep in mind when designing fleet leases.
Declining Li-Ion Cell Costs Below USD 90/kWh Expected By 2027
In 2024, Chinese LFP cells achieved a significant cost reduction, surpassing the expected cost trajectory. This enabled Brazilian assemblers to not only reduce pack prices but also boost their production capacity. These cost savings effectively counterbalance the high duty on imported finished products. Locally manufactured frames can seamlessly incorporate cells priced on the global market, avoiding any additional costs. Consequently, lithium-ion technology dominated the market demand during the year, with projections suggesting an even stronger foothold in the future. As consumers increasingly access extended-range models, there's a noticeable shift towards premiumization, especially within the mid-range price segment. Manufacturers situated in the Manaus Industrial Pole are reaping the benefits of both Zona Franca tax incentives and reduced cell costs. This combination not only enhances their profit margins but also fuels dealer expansions throughout Brazil's e-bike landscape.
Government Subsidy For E-Bike Purchases In São Paulo & Rio
Municipal rebates under the Programa Mover framework reimburse a portion of purchase prices for approved models, lifting near-term demand in the two largest metro areas. The incentives target delivery riders and commuters traveling 5-15 km daily, funneling volume into the pedal-assist class. Physical stores dominate claims processing, explaining the 61.28% offline channel share despite rising e-commerce traffic. Political turnover, however, could alter funding continuity beyond 2026, prompting suppliers to balance inventory across incentivized and non-incentivized states. Even so, early uptake proves price sensitivity and underscores the pivotal role of local policy in Brazil's e-bike market adoption.
Surging Venture Funding For Brazilian Micromobility Start-Ups
Over the forecast period, equity rounds secured significant funding, facilitating network expansion, the establishment of battery swap infrastructure, and the introduction of embedded-finance offerings. Tembici is using its funds to substantially increase the density of its stations, while Vammo is rolling out modular swap cabinets, significantly reducing rider downtime. The concentration of capital along the São Paulo-Rio axis not only reflects existing consumption patterns but also intensifies regional imbalances, all while hastening technological advancements. Additionally, this influx of funding allows component suppliers to experiment with telematics and smart-lock integrations, further boosting the pace of innovation in Brazil's e-bike market.
Restraints Impact Analysis*
| Restraint | (~) % Impact on CAGR Forecast | Geographic Relevance | Impact Timeline |
|---|---|---|---|
| Import Duty on Complete E-Bikes | -0.5% | National, affecting all imported complete units | Short term (≤ 2 years) |
| Limited Financing Options | -0.4% | Tier-2 and Tier-3 cities, rural areas with limited banking infrastructure | Short term (≤ 2 years) |
| Fragmented Battery-Recycling Infrastructure | -0.3% | National, with particular gaps in Tier-2 cities | Long term (≥ 4 years) |
| Rising Electricity Tariffs | -0.2% | National, with higher impact on commercial fleet operators | Medium term (2-4 years) |
| Source: Mordor Intelligence | |||
Import Duty Of Up To 35% On Complete E-Bikes
A fair tariff inflates landed costs for fully assembled imports, protecting local jobs but restricting consumer choice. Ex-tarifário exemptions exist, yet require complex bureaucratic filings that delay shipments by several months. Global brands responding to this barrier have anchored CKD or SKD lines in Manaus, cushioning price gaps while tapping Zona Franca tax holidays. Still, boutique overseas producers lacking scale struggle to enter, leaving specific niche configurations unavailable in the Brazilian e-bike market.
Fragmented Battery-Recycling Infrastructure
Fleet operators face disposal fees and reputational risks due to the absence of a nationwide reverse-logistics pathway for end-of-life lithium-ion packs. In many Tier-2 municipalities, spent cells are often directed into general waste streams, increasing environmental liabilities. Manufacturers are wary of looming regulations that could introduce producer-responsibility costs, potentially leading to significant additional expenses in the coming years. The lack of a scalable recycling network has resulted in thin secondary markets for used packs, making refurbished equipment less affordable for price-sensitive segments.
*Our forecasts treat driver/restraint impacts as directional, not additive. The impact forecasts reflect baseline growth, mix effects, and variable interactions.
Segment Analysis
By Propulsion Type: Pedal-Assist Dominance Faces Speed Evolution
Pedal-assist systems commanded 62.98% of Brazil's e-bike market share in 2025, supported by fitness-oriented consumers and straightforward regulatory compliance. A widening installed base of protected bike lanes across São Paulo and Rio sustains this preference. Speed-pedelecs, while accounting for a small slice, deliver a 3.15% CAGR as commuters pivot from small-engine scooters to higher-velocity electric bikes for 10-20 km trips. Manufacturers differentiate with torque sensors and multi-profile controllers, driving average selling prices above the mid-market band.
Market penetration of speed-pedelecs suggests a gradual bifurcation: value buyers remain in pedal-assist, and performance seekers migrate up the curve. Supplier catalogs, therefore, segment SKUs by top speed and motor ratings, optimizing inventory turns at retail. CONTRAN Resolution 996 caps e-bike velocity at 32 km/h while keeping the vehicle in the bicycle category, preserving lane access and helmet flexibility. Compliance tooling, such as electronic limiters, lets brands qualify for subsidy programs, reinforcing pedal-assist scale even as speed-oriented niches emerge.


By Application Type: Urban Focus Yields To Cargo Utility
City and commuter models generated 50.88% of the Brazilian e-bike market size in 2025, driven by modal substitution from automobiles on congested arterials. Infrastructure density and favorable topography in Tier-1 cities make short-haul commuting attractive. Cargo and utility bikes, though smaller in volume, clock a higher 3.18% CAGR on the back of platform deliveries and municipal contracting for street-level services. Rear-rack payload ratings have moved from 25 kg to 50 kg over two product cycles, underscoring a design shift toward heavier-duty frames.
Trekking/mountain applications serve a niche but stable market segment, supported by Brazil's growing cicloturism industry, where operators like Bike Tour Vale Europeu now deploy 15 electric bikes alongside 35 conventional units . Commercial logistics fleets heavily rely on step-through cargo frames for rider ergonomics and swift dismounts. Leasing providers bundle maintenance, lowering downtime that once discouraged corporate ownership. Growth potential also stems from emerging cicloturism corridors, where operators specify pannier-ready e-bikes for overnight touring. As riders demand purpose-built equipment, SKU proliferation is rising, and channel partners must allocate more floor space to specialized form factors.
By Battery Type: Lithium-Ion Supremacy Accelerates
Lithium-ion technology delivered 82.96% of 2025 unit sales and is forecast for a 3.29% CAGR through 2031, solidifying dominance. Cost per watt-hour has fallen significantly since 2022, while pack gravimetric energy density tops 150 Wh/kg, a decisive weight advantage over sealed lead-acid. Lead-acid systems cling to rural courier services where upfront price prevails, yet their share slips each year. Continuous drop-in compatibility between Chinese LFP cells and Brazilian BMS suppliers keeps the upgrade cycle brisk.
Brazil e-bike market vendors leverage cell price declines to introduce 540 Wh standard packs within the pivotal USD 1,000-1,499 tier. Enhanced range underwrites interest-free financing promotions that stimulate volume, particularly among platform couriers. End-of-life recycling gaps remain, but joint ventures like Vammo’s swap model provide interim mitigation by centralizing battery stewardship at hubs.
By Motor Placement: Hub Motors Hold While Mid-Drive Gains
Hub motors retained 67.12% unit share in 2025 owing to their lower BOM cost and plug-and-play assembly. Yet mid-drive units post a 3.16% CAGR as consumers recognize superior hill-climb torque and balanced weight distribution. Cargo segments amplify this shift: mid-drive options now account for 45% of newly procured commercial bikes above USD 2,000. Hub suppliers answer with lighter geared variants and integrated PAS controllers to safeguard share among casual riders.
Retailers position mid-drive frames as performance upgrades, bundling demo rides highlighting climbing efficiency on São Paulo’s inclines. Fleet operators likewise favor mid-drives for reduced spoke breakage under heavy loads. Over time, technical education and falling gearbox costs are expected to narrow the retail price delta, encouraging broader mid-drive penetration throughout the Brazilian e-bike market.
By Drive System: Chain Dominance, Faces Belt Innovation
Chain drives took 72.44% share in 2025 because of wide parts availability and mechanical familiarity. However, belt drives are gaining traction, expanding at a 3.18% CAGR to 2031 as urban riders seek clean, low-maintenance drivelines. CDP-rubber belts combined with internal-gear hubs extend service intervals past 15,000 km, an appealing proposition for delivery couriers logging 80 km daily.
Awareness initiatives—such as in-store cutaway displays and video tutorials—have demystified belt tensioning, boosting acceptance. Some rental fleets quote two-fifths lower downtime on belt-equipped units, translating into higher fleet utilization. As warranty costs fall, compounding lifecycle savings will likely encourage chain-to-belt migration in personal and commercial subsets.
By Motor Power: Sub-250 W Leads Despite Mid-Range Growth
Sub-250 W systems comprised 57.02% of Brazil's e-bike market share in 2025, aligning with standard commuter requirements and preserving regulatory simplicity. Meanwhile, 501-600 W motors grow at 3.18% CAGR because commercial riders prioritize acceleration under payload. Manufacturers calibrate controllers so that peak output satisfies gradeability without breaking legal ceilings, threading the compliance needle.
Mid-power traction is evident in steep-terrain metropolises such as Belo Horizonte, where couriers report significant shorter route times versus sub-250 W bikes. Regulatory discourse about raising the blanket 32 km/h cap remains inconclusive, prompting brands to refine torque management instead of speed lifts. Until rules shift, power segmentation will likely stay a dual-peak curve with economy and mid-range clusters.
By Price Band: Mid-Market Expansion Drives Premiumization
The USD 1,000-1,499 tranche delivered 35.21% of total revenue in 2025, offering the best value equilibrium between branded components and accessible financing. However, the USD 2,500-3,499 category rises at 3.26% CAGR as affluent cyclists and corporate fleets demand connectivity, anti-theft GPS, and hydraulic brakes.
Component ecosystem localization trims price escalations even in the premium tier. Domestic frame production paired with imported drive units improves gross margins, funding after-sales service networks in Tier-2 cities. This virtuous cycle reinforces consumer confidence, enabling brands to climb the value ladder without stalling overall volume.
By Sales Channel: Offline Dominance Faces Digital Disruption
Brick-and-mortar (offline) outlets secured 60.74% of 2025 transactions, capitalizing on test-ride experiences that de-risk high-ticket buys. Yet e-commerce is scaling at a 3.22% CAGR due to improved reverse logistics and installment gateways. Hybrid shoppers browse specs online before sealing deals in-store, nudging dealers toward omnichannel CRM stacks.
Pure-play digital platforms leverage drop-shipping from Manaus warehouses to guarantee 72-hour delivery in the Southeast. Conversely, premium aficionados still favor specialized boutiques for custom fitting and firmware updates. In the future, subscription-based maintenance plans will likely migrate online, potentially shifting more of the Brazilian e-bike market toward click-to-buy models.

By End Use: Personal Use Leads While Commercial Delivery Surges
Personal and household riders accounted for 55.97% of 2025 unit demand, anchored by leisure weekend usage and short-haul commuting. The segment retains diversity across fitness, tourism, and personal mobility sub-needs. Commercial delivery, however, logs a steeper 3.21% CAGR, reflecting super-app financing and predictable route density. Service applications, maintenance crews, and campus security also edge upward as organizations electrify small-form transportation assets.
Fleet operators negotiate bulk deals that bundle telematics dashboards and swap batteries, pushing average revenue per unit and raising technical specifications. As subscription models mature, enterprises may account for one-third of live fleet count by 2030, gradually tilting value capture from retail to B2B.
Geography Analysis
The Southeast corridor, anchored by São Paulo and Rio de Janeiro, concentrates roughly two-thirds of total sales, driven by 994 km of combined bike lanes and overlapping subsidy schemes. Disposable incomes in these metros average three-fourths above the national mean, fostering early adopter behavior and premium model uptake. Retail footprints are densest here, granting same-day service capabilities that anchor repeat purchases.
From early 2024 to late 2024, Manaus, the industrial heartland, witnessed a significant increase in e-bike production compared to the previous year. These e-bikes are then distributed nationwide through a robust multimodal logistics network. Thanks to Zona Franca incentives, factory overheads are substantially reduced. This financial cushion enables assemblers to navigate raw material price fluctuations without passing the costs onto ex-works prices. Despite logistical distance, river-and-air shipping ensures a 10-day lead time to São Paulo distribution hubs, balancing scale economies with transit predictability .
Beyond the core, pockets of growth materialize in the South and Northeast. Florianópolis expanded its network to 263 km, underpinning rental programs that help tourists navigate coastal zones. Vale Europeu’s cicloturism loop attracts enthusiasts who now book e-bike packages, validating demand in secondary cities once deemed too small for specialist inventory. Nevertheless, Tier-2 infrastructure gaps and lower household incomes dampen volume potential, suggesting a staggered roll-out where dealers partner with local municipalities for demo days and financing fairs.
Competitive Landscape
Brazil's e-bike market competition is moderately fragmented. The top five brands, Caloi, Sense, VELA, Yadea, and Lev, hold a significant share, leaving room for challenger entry. Chinese majors opt for joint ventures, as illustrated by Yadea’s April 2025 start-up in partnership with Jabil. Local players counter with regionally optimized SKUs and expansive dealer networks, leveraging cultural proximity and localized service packages.
Strategic motions favor vertical integration. Lev will triple its retail footprint to 94 stores and tie each to in-house assembly lines in Manaus, achieving faster feedback loops on warranty claims. Component powerhouses Bosch, Shimano, and Bafang intensify OEM loyalty via bundled motor-battery-controller kits, shortening development cycles for domestic assemblers. Meanwhile, Vammo’s battery-swap model tries to lock commercial fleets into proprietary energy ecosystems, aiming for higher annuity streams per vehicle.
M&A appetites rise as private equity scouts consolidation plays among smaller regional bike makers lacking export scale. Insurance firms also eye embedded coverage partnerships to ride the surge in premium models valued above USD 3,000. Over the forecast horizon, technology differentiation—connectivity, smart locks, predictive maintenance will determine brand stickiness more than pure cost positioning.
Brazil E-bike Industry Leaders
DECATHLON
Pon Bicycle Holding BV
Trek Bicycle Corporation
YAMAHA MOTOR DO BRASIL LTDA
Sense Bike Indústria
- *Disclaimer: Major Players sorted in no particular order

Recent Industry Developments
- April 2025: Yadea commenced e-bike and electric motorcycle production in Manaus with Jabil Industrial do Brasil, marking its fourth manufacturing base outside China.
- September 2024: Deye selected Manaus for its first overseas battery plant, forecasting 1,000 new jobs to supply Brazilian and wider South American demand.


Brazil E-bike Market Report Scope
Pedal Assisted, Speed Pedelec, Throttle Assisted are covered as segments by Propulsion Type. Cargo/Utility, City/Urban, Trekking are covered as segments by Application Type. Lead Acid Battery, Lithium-ion Battery, Others are covered as segments by Battery Type.By Propulsion Type
| Pedal Assisted |
| Speed Pedelec |
| Throttle Assisted |
By Application Type
| Cargo/Utility |
| City/Urban |
| Trekking/Mountain |
By Battery Type
| Lead Acid Battery |
| Lithium-ion Battery |
| Others |
By Motor Placement
| Hub (front/rear) |
| Mid-drive |
By Drive Systems
| Chain Drive |
| Belt Drive |
By Motor Power
| Less than 250 W |
| 250–350 W |
| 351–500 W |
| 501–600 W |
| More than 600 W |
By Price Band
| Up to USD1,000 |
| USD1,000–1,499 |
| USD1,500–2,499 |
| USD2,500–3,499 |
| USD3,500–5,999 |
| Above USD6,000 |
By Sales Channel
| Online | |
| Offline | Specialized E-Bike Retailers |
| Traditional Bike Shops | |
| Department Stores & Sporting Goods Chains |
By End Use
| Commercial Delivery | Retail and Goods Delivery |
| Food and Beverage Delivery | |
| Service Providers | |
| Personal and Family Use | |
| Institutional | |
| Others |
| By Propulsion Type | Pedal Assisted | |
| Speed Pedelec | ||
| Throttle Assisted | ||
| By Application Type | Cargo/Utility | |
| City/Urban | ||
| Trekking/Mountain | ||
| By Battery Type | Lead Acid Battery | |
| Lithium-ion Battery | ||
| Others | ||
| By Motor Placement | Hub (front/rear) | |
| Mid-drive | ||
| By Drive Systems | Chain Drive | |
| Belt Drive | ||
| By Motor Power | Less than 250 W | |
| 250–350 W | ||
| 351–500 W | ||
| 501–600 W | ||
| More than 600 W | ||
| By Price Band | Up to USD1,000 | |
| USD1,000–1,499 | ||
| USD1,500–2,499 | ||
| USD2,500–3,499 | ||
| USD3,500–5,999 | ||
| Above USD6,000 | ||
| By Sales Channel | Online | |
| Offline | Specialized E-Bike Retailers | |
| Traditional Bike Shops | ||
| Department Stores & Sporting Goods Chains | ||
| By End Use | Commercial Delivery | Retail and Goods Delivery |
| Food and Beverage Delivery | ||
| Service Providers | ||
| Personal and Family Use | ||
| Institutional | ||
| Others | ||


Market Definition
- By Application Type - E-bikes considered under this segment include city/urban, trekking, and cargo/utility e-bikes. The common types of e-bikes under these three categories include off-road/hybrid, kids, ladies/gents, cross, MTB, folding, fat tire, and sports e-bike.
- By Battery Type - This segment includes lithium-ion batteries, lead-acid batteries, and other battery types. The other battery type category includes nickel-metal hydroxide (NiMH), silicon, and lithium-polymer batteries.
- By Propulsion Type - E-bikes considered under this segment include pedal-assisted e-bikes, throttle-assisted e-bikes, and speed pedelec. While the speed limit of pedal and throttle-assisted e-bikes is usually 25 km/h, the speed limit of speed pedelec is generally 45 km/h (28 mph).
| Keyword | Definition |
|---|---|
| Pedal Assisted | Pedal-assist or pedelec category refers to the electric bikes that provide limited power assistance through torque-assist system and do not have throttle for varying the speed. The power from the motor gets activated upon pedaling in these bikes and reduces human efforts. |
| Throttle Assisted | Throttle-based e-bikes are equipped with the throttle assistance grip, installed on the handlebar, similarly to motorbikes. The speed can be controlled by twisting the throttle directly without the need to pedal. The throttle response directly provides power to the motor installed in the bicycles and speeds up the vehicle without paddling. |
| Speed Pedelec | Speed pedelec is e-bikes similar to pedal-assist e-bikes as they do not have throttle functionality. However, these e-bikes are integrated with an electric motor which delivers power of approximately 500 W and more. The speed limit of such e-bikes is generally 45 km/h (28 mph) in most of the countries. |
| City/Urban | The city or urban e-bikes are designed with daily commuting standards and functions to be operated within the city and urban areas. The bicycles include various features and specifications such as comfortable seats, sit upright riding posture, tires for easy grip and comfortable ride, etc. |
| Trekking | Trekking and mountain bikes are special types of e-bikes that are designed for special purposes considering the robust and rough usage of the vehicles. These bicycles include a strong frame, and wide tires for better and advanced grip and are also equipped with various gear mechanisms which can be used while riding in different terrains, rough grounded, and tough mountainous roads. |
| Cargo/Utility | The e-cargo or utility e-bikes are designed to carry various types of cargo and packages for shorter distances such as within urban areas. These bikes are usually owned by local businesses and delivery partners to deliver packages and parcels at very low operational costs. |
| Lithium-ion Battery | A Li-ion battery is a rechargeable battery, which uses lithium and carbon as its constituent materials. The Li-Ion batteries have a higher density and lesser weight than sealed lead acid batteries and provide the rider with more range per charge than other types of batteries. |
| Lead Acid Battery | A lead acid battery refers to sealed lead acid battery having a very low energy-to-weight and energy-to-volume ratio. The battery can produce high surge currents, owing to its relatively high power-to-weight ratio as compared to other rechargeable batteries. |
| Other Batteries | This includes electric bikes using nickel–metal hydroxide (NiMH), silicon, and lithium-polymer batteries. |
| Business-to-Business (B2B) | The sales of e-bikes to business customers such as urban fleet and logistics company, rental/sharing operators, last-mile fleet operators, and corporate fleet operators are considered under this category. |
| Business-to-Customers (B2C) | The sales of electric scooters and motorcycles to direct consumers is considered under this category. The consumers acquire these vehicles either directly from manufacturers or from other distributers and dealers through online and offline channel. |
| Unorganized Local OEMs | These players are small local manufacturers and assemblers of e-bikes. Most of these manufacturers import the components from China and Taiwan and assemble them locally. They offer the product at low cost in this price sensitive market which give them advantage over organized manufacturers. |
| Battery-as-a-Service | A business model in which the battery of an EV can be rented from a service provider or swapped with another battery when it runs out of charge |
| Dockless e-Bikes | Electric bikes that have self-locking mechanisms and a GPS tracking facility with an average top speed of around 15mph. These are mainly used by bike-sharing companies such as Bird, Lime, and Spin. |
| Electric Vehicle | A vehicle which uses one or more electric motors for propulsion. Includes cars, scooters, buses, trucks, motorcycles, and boats. This term includes all-electric vehicles and hybrid electric vehicles |
| Plug-in EV | An electric vehicle that can be externally charged and generally includes all-electric vehicles as well as plug-in hybrids. In this report we use the term for all-electric vehicles to differentiate them from plug-in hybrid electric vehicles. |
| Lithium-Sulphur Battery | A rechargeable battery that replaces the liquid or polymer electrolyte found in current lithium-ion batteries with sulfur. They have more capacity than Li-ion batteries. |
| Micromobility | Micromobility is one of the many modes of transport involving very-light-duty vehicles to travel short distances. These means of transportation include bikes, e-scooters, e-bikes, mopeds, and scooters. Such vehicles are used on a sharing basis for covering short distances, usually five miles or less. |
| Low Speed Electric Vehicls (LSEVs) | They are low speed (usually less than 25 kmph) light vehicles that do not have an internal combustion engine, and solely use electric energy for propulsion. |


Research Methodology
Mordor Intelligence follows a four-step methodology in all its reports.
- Step-1: Identify Key Variables: To build a robust forecasting methodology, the variables and factors identified in Step-1 are tested against available historical market numbers. Through an iterative process, the variables required for market forecast are set and the model is built based on these variables.
- Step-2: Build a Market Model: Market-size estimations for the historical and forecast years have been provided in revenue and volume terms. Market revenue is calculated by multiplying the volume demand with volume-weighted average battery pack price (per kWh). Battery pack price estimation and forecast takes into account various factors affecting ASP, such as inflation rates, market demand shifts, production costs, technological developments, and consumer preferences, providing estimations for both historical data and future trends.
- Step-3: Validate and Finalize: In this important step, all market numbers, variables, and analyst calls are validated through an extensive network of primary research experts from the market studied. The respondents are selected across levels and functions to generate a holistic picture of the market studied.
- Step-4: Research Outputs: Syndicated Reports, Custom Consulting Assignments, Databases & Subscription Platforms


