Market Overview
| Study Period | 2020 - 2031 |
|---|---|
| Forecast Data Period | 2026 - 2031 |
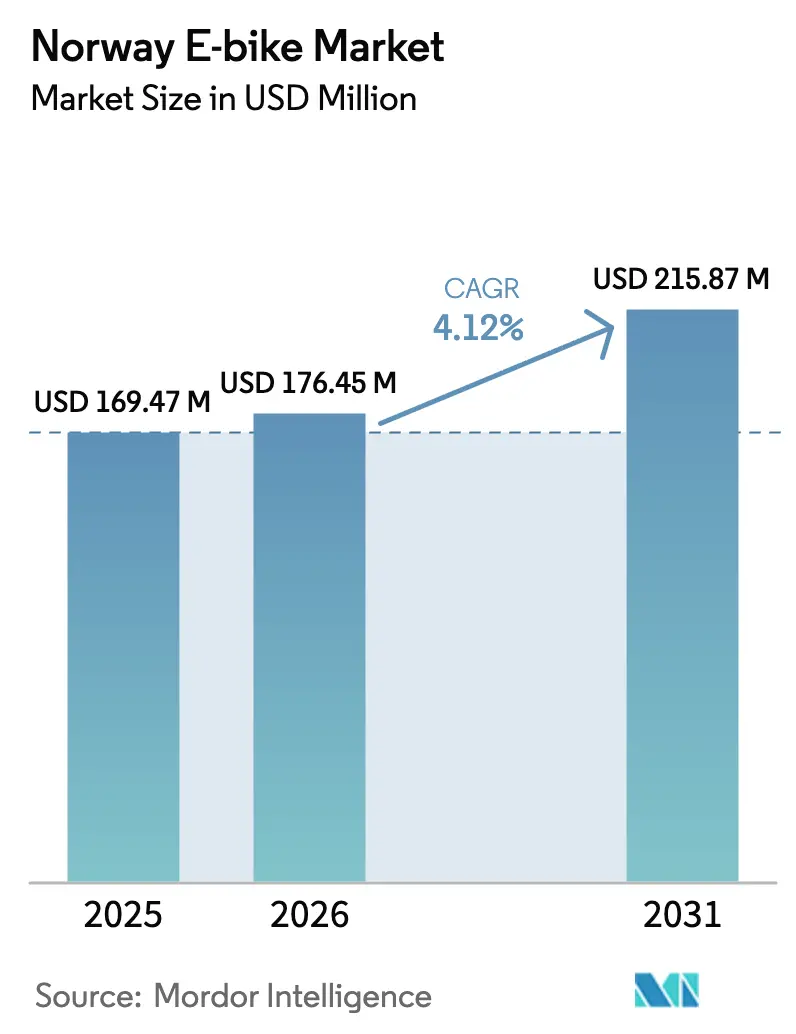
| Base Year Market Size (2025) | USD 169.47 Million |
| Market Size (2026) | USD 176.45 Million |
| Market Size (2031) | USD 215.87 Million |
| Growth Rate (2026 - 2031) | 4.12% CAGR |
| Market Concentration | Medium |
Major Players*Disclaimer: Major Players sorted in no particular order Image © Mordor Intelligence. Reuse requires attribution under CC BY 4.0. |
|
Norway E-bike Market Analysis by Mordor Intelligence
Norway e-bike market size in 2026 is estimated at USD 176.45 million, growing from 2025 value of USD 169.47 million with 2031 projections showing USD 215.87 million, growing at 4.12% CAGR over 2026-2031. Public subsidies, protected cycle-lane expansion, and cold-weather technology upgrades anchor demand, while premium pricing and import-dependent supply chains temper sales velocity. Municipal cargo-bike procurement, employer mobility benefits, and smart-city connectivity are widening commercial adoption opportunities. Manufacturers are prioritizing mid-drive powertrains, winter-rated lithium-ion batteries, and belt drives that lower upkeep in salty road conditions.
Key Report Takeaways
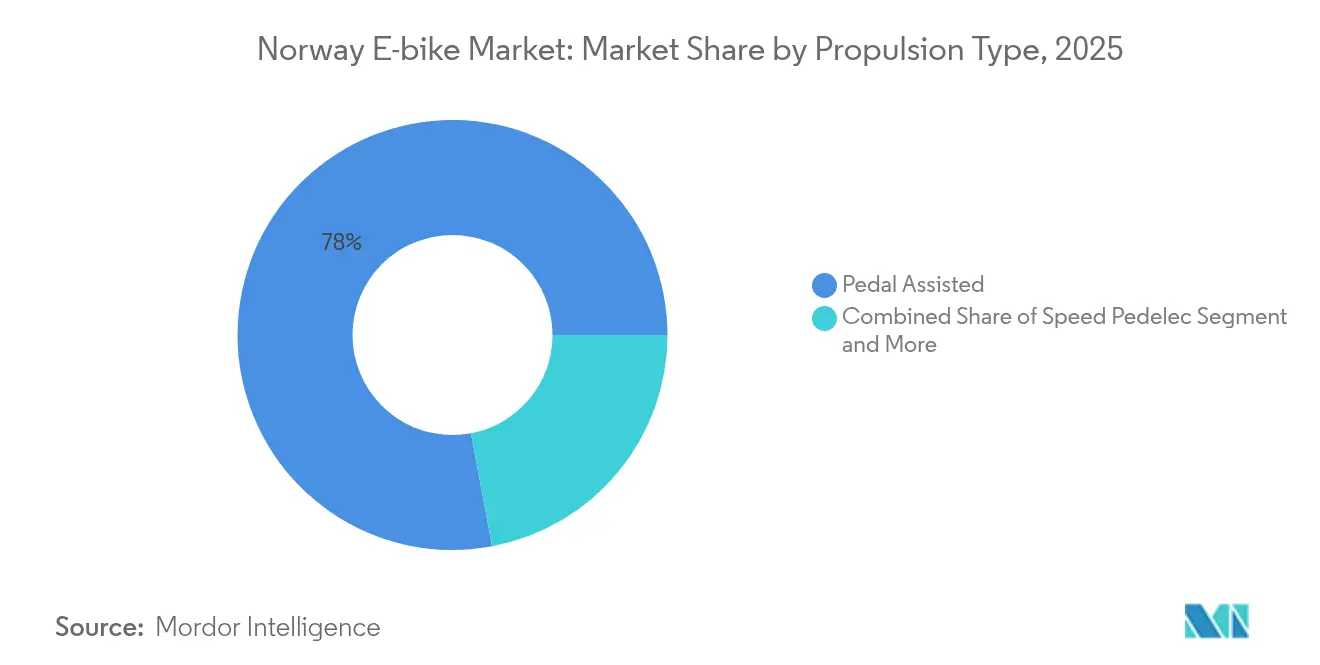
- By propulsion type, pedal-assisted models led with 77.95% of the Norway e-bike market share in 2025, while speed pedelecs are projected to post the fastest 12.27% CAGR through 2031.
- By application, city/urban bikes held 45.92% of the Norway e-bike market in 2025 and cargo/utility bikes are set to climb at a 14.64% CAGR during 2026-2031.
- By battery type, lithium-ion commanded a 97.02% share in 2025 and is forecast to grow at a 10.45% CAGR through 2031.
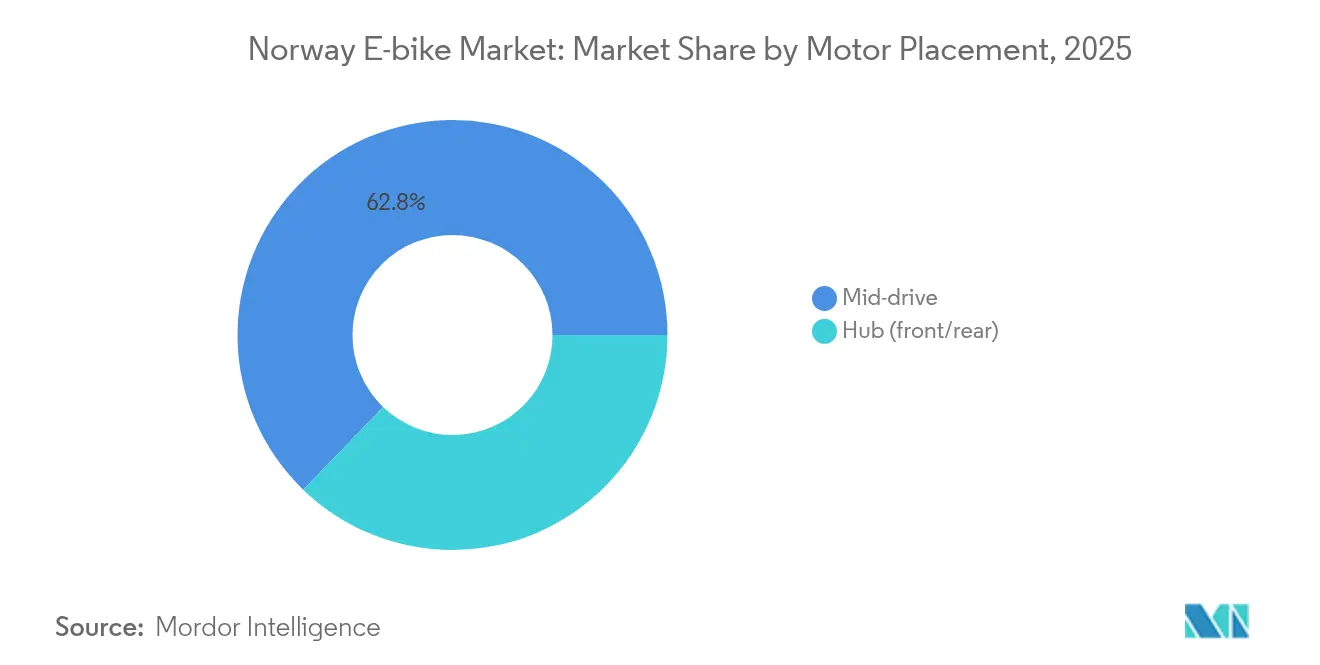
- By motor placement, mid-drive systems captured a 62.78% share in 2025 and are advancing at a 13.95% CAGR through 2031.
- By drive system, chain drives retained 71.55% share in 2025, while belt drives will accelerate at a 15.62% CAGR over 2026-2031.
- By motor power, units below 250 W had a 55.93% share in 2025, and the 501 to 600 W segment is poised for a 16.3% CAGR.
- By price band, USD 1,500 to 2,499 bicycles led with 28.22% share in 2025, while the USD 3,500 to 5,999 band is likely to register 10.62% CAGR through 2031.
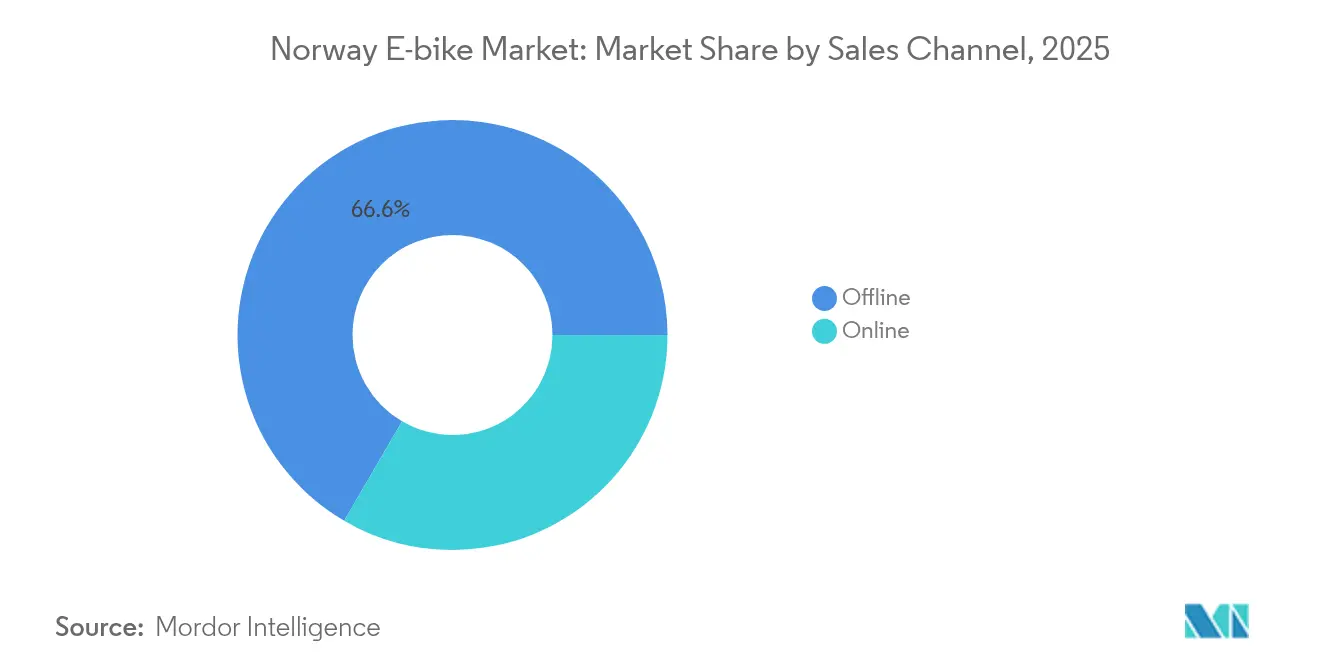
- By sales channel, offline outlets led with 66.59% share in 2025 while online sales are projected to expand at an 17.61% CAGR during 2026-2031.
- By end use, personal and family riding contributed 41.74% revenue in 2025 and commercial delivery fleets are rising at a 18.1% CAGR.
Note: Market size and forecast figures in this report are generated using Mordor Intelligence’s proprietary estimation framework, updated with the latest available data and insights as of 2026.
Norway E-bike Market Trends and Insights
Drivers Impact Analysis*
| Driver | (~) % Impact on CAGR Forecast | Geographic Relevance | Impact Timeline |
|---|---|---|---|
| Falling Lithium-Ion Battery Costs | +1.2% | Region-wide with early gains in Denmark, Sweden | Medium term (2-4 years) |
| Expanding Protected Cycle-Lane Networks | +0.8% | All Nordic capitals | Long term (≥ 4 years) |
| VAT Exemption and Purchase Incentives | +0.6% | Oslo, Copenhagen, Stockholm corridors | Short term (≤ 2 years) |
| High Share of Less Than 15 km Daily Trips | +0.5% | Norway, Finland | Medium term (2-4 years) |
| Covered E-Bike Designs | +0.4% | Copenhagen, Gothenburg, Helsinki | Short term (≤ 2 years) |
| Smart Shared-Mobility Hubs | +0.3% | Urban cores region-wide | Medium term (2-4 years) |
| Source: Mordor Intelligence | |||
Falling Lithium-Ion Battery Costs
Lithium-ion battery prices have declined substantially, enabling Norwegian e-bike manufacturers to offer extended range capabilities essential for cold-weather performance. Battery costs dropped from approximately USD 1,100/kWh in 2010 to under USD 150/kWh by 2024, with specific adaptations maintaining performance at temperatures below -10°C[1]Mathis Dahl Fenre, "The effect of rolling resistance on people’s willingness to cycle during wintertime," Journal of Infrastructure Preservation and Resilience, springeropen.com.. This cost reduction directly addresses Norway's consumers primary concern about range anxiety during winter months, when battery efficiency can decrease by 20-30% in extreme cold conditions. Norwegian research demonstrates that e-bike ownership does not significantly affect willingness to cycle in winter conditions, suggesting that improved battery technology removes a key adoption barrier rather than creating new behavioral constraints.
Expanding Protected Cycle-Lane Network
Norway has systematically expanded protected cycling infrastructure. The infrastructure advantage extends beyond basic lane separation to include winter maintenance contracts that prioritize cyclist satisfaction, smart traffic management systems, and integrated charging infrastructure at transport hubs. This comprehensive approach reduces perceived safety risks and weather-related barriers that typically limit e-bike adoption in harsh climate regions. Better separation particularly benefits novice riders and older commuters who value perceived safety. Infrastructure also stimulates corporate wellness schemes that reimburse employees for e-bike commutes. Robust lanes therefore sustain steady growth in both personal and commercial segments, supporting long-term demand momentum.
VAT Exemption and Other Purchase Incentives
Nordic governments have deployed targeted fiscal incentives that directly reduce e-bike acquisition costs for consumers and businesses. Norway exempts electric vehicles from VAT, and pilot programs in Oslo and Bergen consider extending rebates to speed pedelecs. Purchase incentives trim upfront cost gaps versus conventional bicycles and speed adoption among price-sensitive households. Fiscal support also encourages companies to rotate fleets toward cargo e-bikes for urban deliveries. Government spending thus delivers a measurable boost to near-term unit sales.
High Share of Less Than 15 km Daily Trips
Norway's urban planning and commuting patterns align closely with e-bike range capabilities, with the majority of daily trips falling within optimal e-bike distance ranges. Norwegian transport planning explicitly targets zero growth in car passenger traffic in urban areas, creating policy demand for alternative modes that can handle short-to-medium distance trips efficiently. The emphasis on compact urban development and mixed-use planning creates trip patterns that favor e-bikes over both conventional bicycles (due to distance and terrain) and cars (due to parking constraints and congestion).
Restraints Impact Analysis*
| Restraint | (~) % Impact on CAGR Forecast | Geographic Relevance | Impact Timeline |
|---|---|---|---|
| Premium Pricing of Quality E-Bikes | –0.7% | Rural districts region-wide | Medium term (2-4 years) |
| Import-Dependent Supply-Chain Volatility | –0.4% | All Nordic ports | Short term (≤ 2 years) |
| Limited Rural Cycling Infrastructure | –0.3% | Northern Finland, inland Norway | Long term (≥ 4 years) |
| Complex Speed-Pedelec Registration Rules | –0.2% | Sweden, Finland | Short term (≤ 2 years) |
| Source: Mordor Intelligence | |||
Premium Pricing of Quality E-Bikes
The higher e-bike average selling prices create significant barriers to mass market adoption, particularly in rural areas with lower population density and income levels. The premium pricing reflects specific requirements, including cold-weather battery performance, robust construction for year-round use, and compliance with stringent safety standards. However, this pricing structure limits market expansion beyond urban professionals and early adopters, creating a constraint on volume growth that affects overall market CAGR. The price premium becomes more pronounced when compared to conventional bicycles, which remain viable for many consumers who have adapted to winter cycling conditions through experience and appropriate equipment.
Import-Dependent Supply Chain Volatility
E-bike markets rely heavily on imported components and complete units, creating vulnerability to supply chain disruptions and currency fluctuations that can affect pricing stability and product availability. The concentration of battery and motor manufacturing in Asia, combined with European assembly operations, exposes the markets to geopolitical risks and shipping delays that have affected product launches and inventory management. This import dependency also limits manufacturers ability to respond quickly to local market preferences and regulatory changes, potentially constraining the development of product innovations and competitive positioning against global manufacturers.
*Our forecasts treat driver/restraint impacts as directional, not additive. The impact forecasts reflect baseline growth, mix effects, and variable interactions.
Segment Analysis
By Propulsion Type: Speed Pedelecs Gain Momentum
Pedal-assisted e-bikes maintain a dominant market position at 77.95% share in 2025, reflecting consumers preference for regulatory-compliant models that integrate seamlessly with existing cycling infrastructure and traffic rules. Speed pedelecs achieve the fastest growth at 12.27% CAGR (2026-2031), driven by longer average trip distances and tolerance for higher-performance vehicles that require registration and insurance.
Throttle-assisted models remain niche due to restrictive regulations that classify them closer to mopeds than bicycles. The propulsion type segmentation reveals a market with a sophisticated regulatory environment, where performance capabilities must balance with legal compliance and infrastructure access rights. Norwegian research indicates that e-bike users show similar weather sensitivity to conventional cyclists, suggesting that propulsion type selection is driven more by performance requirements than weather adaptation needs. Speed pedelecs growth trajectory reflects urban professionals willingness to navigate complex registration requirements in exchange for enhanced commuting capabilities and reduced travel times on longer commuter routes.


By Application Type: Cargo Utility Segment Transforms Urban Logistics
City/urban applications dominate with 45.92% market share in 2025, but cargo/utility segments drive market expansion at 14.64% CAGR (2026-2031), reflecting strategic emphasis on sustainable last-mile delivery and family transportation solutions. Trekking/mountain applications maintain steady growth, supported by the outdoor recreation culture and tourism infrastructure accommodating e-bike trail access. The cargo segment's rapid expansion aligns with Norway's municipal efforts to reduce commercial vehicle traffic in urban cores. These e-bikes are designed for winter operation with enclosed cargo compartments and enhanced battery systems that maintain performance in sub-zero temperatures. Commercial delivery companies report cost savings and improved delivery times using cargo e-bikes compared to conventional delivery vans, particularly in congested urban centers with limited parking availability.
By Battery Type: Lithium-Ion Dominance Reflects Performance Requirements
Lithium-ion batteries command 97.02% market share in 2025 and maintain 10.45% growth through 2031, demonstrating customers prioritization of cold-weather performance and range capabilities over cost considerations. Lead-acid and alternative battery technologies remain marginal due to performance limitations in climate conditions, where temperatures regularly fall below optimal operating ranges for conventional battery chemistries. The lithium-ion dominance reflects Norway-specific technical requirements, including thermal management systems, battery heating elements, and enhanced insulation that maintain capacity and charging efficiency in extreme cold conditions.
E-bike manufacturers have developed proprietary battery management systems that optimize performance for winter cycling, including pre-heating functions and regenerative charging capabilities that extend range during long winter nights. Research demonstrates that e-bike users maintain cycling behavior across temperature ranges, requiring battery systems that deliver consistent performance regardless of seasonal conditions.
By Motor Placement: Mid-Drive Systems Excel
Mid-drive motors dominate with 62.78% market share in 2025 and achieve 13.95% growth (2026-2031). Hub motors maintain a significant presence but grow more slowly due to performance limitations on the terrain and in winter conditions, where traction and balance become critical safety factors. The mid-drive preference aligns with cycling culture, emphasizing a natural pedaling feel and efficient power delivery across varied terrain and weather conditions.
E-bike manufacturers have optimized mid-drive systems for winter operation with enhanced sealing, corrosion resistance, and thermal management that maintain torque delivery in cold temperatures. The motor placement segmentation reflects Norway-based consumers technical sophistication and willingness to invest in premium components that deliver superior performance across challenging seasonal conditions.
By Drive Systems: Belt Drive Innovation Gains Traction
Chain drive systems maintained a 71.55% market share in 2025, but belt drive systems achieved rapid 15.62% growth (2026-2031), reflecting consumers' appreciation for low-maintenance solutions that perform reliably in harsh winter conditions with road salt and moisture exposure. Belt drives offer significant advantages for cycling, including reduced maintenance requirements, quieter operation, and resistance to corrosion from road salt and winter weather conditions.
The evolution of drive systems reflects manufacturers' focus on total cost of ownership and user experience rather than initial purchase price. Belt drive systems command premium pricing that consumers accept in exchange for reduced maintenance and enhanced durability. E-bike service networks report significantly lower maintenance requirements for belt drive systems, particularly during winter when chain drive systems require frequent cleaning and lubrication to maintain performance and prevent corrosion damage.
By Motor Power: Higher Power Segments Address Long Distances
Motors under 250W hold 55.93% market share in 2025, reflecting regulatory compliance requirements that maintain bicycle classification and infrastructure access rights across Norway. However, 501 to 600W motors achieve the fastest growth at 16.3% CAGR (2026-2031), indicating consumers prefer enhanced performance capabilities that address longer commuting distances and challenging terrain, including hills, bridges, and headwinds common in coastal cities.
The power segmentation reveals market regulatory complexity, where higher-power systems require different classification and may face restrictions on cycling infrastructure access. Manufacturers have developed sophisticated power management systems that enhance performance while maintaining regulatory compliance through programmable power limits and mode selection capabilities. The trend toward higher power reflects consumers technical sophistication and willingness to navigate regulatory requirements for enhanced performance capabilities.
By Price Band: Premium Segments Drive Market Value
The USD 1,500 to 2,499 price band dominates with 28.22% market share in 2025, reflecting consumer acceptance of premium pricing for quality and performance. However, the USD 3,500-5,999 segment achieves 10.62% growth (2026-2031), indicating market evolution toward higher-value products with advanced features, including integrated connectivity, enhanced battery systems, and Norway-specific adaptations. Lower price bands remain constrained by quality expectations and regulatory requirements that increase manufacturing costs.
The pricing structure emphasizes total cost of ownership, durability, and performance rather than initial purchase price optimization. Consumers demonstrate willingness to invest in premium e-bikes that deliver reliable year-round performance, reduced maintenance requirements, and integration with smart city infrastructure, including charging networks and digital mobility platforms.
By Sales Channel: Online Growth Challenges Traditional Retail
Offline channels maintain 66.59% market share in 2025, reflecting consumer preference for professional fitting, service support, and test riding capabilities that remain important for high-value e-bike purchases. However, online channels achieve rapid 17.61% growth (2026-2031), driven by improved digital shopping experiences, direct-to-consumer brands, and enhanced delivery and service networks.
The channel evolution reflects the market's digital sophistication and consumers comfort with online purchasing for technical products, supported by strong consumer protection regulations and return policies. E-bike retailers are developing hybrid online-offline models that combine digital convenience with local service capabilities, including click-and-collect services, home delivery with professional setup, and integrated maintenance programs that address consumers service expectations.
By End Use: Commercial Delivery Transforms Urban Mobility
Personal and family use dominates with a 41.74% market share in 2025, reflecting cycling culture and family-oriented transportation needs, including child transport and recreational use. Commercial delivery achieves fastest growth at 18.1% CAGR (2026-2031), driven by sustainable logistics initiatives and delivery companies adopting cargo e-bikes for last-mile operations. Service providers and institutional segments maintain steady growth, supported by municipality fleet electrification programs and employer mobility benefits.
The end-use segmentation reflects a systematic approach to sustainable transportation that encompasses personal mobility, commercial logistics, and institutional transportation needs. Delivery companies report significant operational advantages from e-bike adoption, including reduced fuel costs, improved access to restricted urban areas, and positive brand positioning.
Competitive Landscape
The Norwegian e-bike market exhibits moderate concentration with established European manufacturers maintaining stable positions through distribution networks, service capabilities, and product adaptations rather than aggressive pricing competition. Major players leverage proximity advantages and regulatory compliance expertise to serve Nordic markets with specialized winter-adapted models and integrated service networks. Market dynamics favor companies delivering reliable cold-weather performance, comprehensive service support, and integration with smart city infrastructure over pure cost competition.
Competitive strategies emphasize technology integration, including smart connectivity features, battery management systems optimized for cold weather, and cargo configurations designed for family and commercial use patterns. Companies invest in charging infrastructure partnerships, municipal fleet programs, and employer mobility services, creating recurring revenue streams beyond unit sales.
The competitive environment rewards sustained investment in market development rather than opportunistic entry, with successful players demonstrating long-term commitment to local service networks, regulatory compliance, and product adaptation for harsh climate conditions. Emerging opportunities exist for companies that can address institutional procurement needs, develop innovative financing models, and integrate e-bikes into broader mobility-as-a-service platforms that align with comprehensive transportation planning approaches.
Norway E-bike Industry Leaders
-
Accell Group
-
Kalkhoff Werke GmbH
-
Maxon Motor AG
-
Merida Industry Co. Ltd.
-
Giant Manufacturing Co. Ltd.
- *Disclaimer: Major Players sorted in no particular order

Recent Industry Developments
- December 2024: ITF-OECD published a comprehensive framework for measuring new mobility services, including e-bikes, establishing standardized metrics and governance models applicable to Nordic municipal programs.
- September 2024: Nordic cities including Gothenburg, Oslo, and Helsinki announced coordinated municipal fleet electrification programs with Spring 2025 deployment timelines, creating institutional procurement opportunities for cargo e-bikes and commercial fleet applications.


Norway E-bike Market Report Scope
Pedal Assisted, Speed Pedelec, Throttle Assisted are covered as segments by Propulsion Type. Cargo/Utility, City/Urban, Trekking are covered as segments by Application Type. Lead Acid Battery, Lithium-ion Battery, Others are covered as segments by Battery Type.
By Propulsion Type
| Pedal Assisted |
| Speed Pedelec |
| Throttle Assisted |
By Application Type
| Cargo/Utility |
| City/Urban |
| Trekking/Mountain |
By Battery Type
| Lead Acid Battery |
| Lithium-ion Battery |
| Others |
By Motor Placement
| Hub (front/rear) |
| Mid-drive |
By Drive Systems
| Chain Drive |
| Belt Drive |
By Motor Power
| Less than 250 W |
| 251 to 350 W |
| 351 to 500 W |
| 501 to 600 W |
| More than 600 W |
By Price Band (USD)
| Up to 1,000 |
| 1,000 to 1,499 |
| 1,500 to 2,499 |
| 2,500 to 3,499 |
| 3,500 to 5,999 |
| Above 6,000 |
By Sales Channel
| Online |
| Offline |
By End Use
| Commercial Delivery | Retail and Goods Delivery |
| Food and Beverage Delivery | |
| Service Providers | |
| Personal and Family Use | |
| Institutional | |
| Others |
| By Propulsion Type | Pedal Assisted | |
| Speed Pedelec | ||
| Throttle Assisted | ||
| By Application Type | Cargo/Utility | |
| City/Urban | ||
| Trekking/Mountain | ||
| By Battery Type | Lead Acid Battery | |
| Lithium-ion Battery | ||
| Others | ||
| By Motor Placement | Hub (front/rear) | |
| Mid-drive | ||
| By Drive Systems | Chain Drive | |
| Belt Drive | ||
| By Motor Power | Less than 250 W | |
| 251 to 350 W | ||
| 351 to 500 W | ||
| 501 to 600 W | ||
| More than 600 W | ||
| By Price Band (USD) | Up to 1,000 | |
| 1,000 to 1,499 | ||
| 1,500 to 2,499 | ||
| 2,500 to 3,499 | ||
| 3,500 to 5,999 | ||
| Above 6,000 | ||
| By Sales Channel | Online | |
| Offline | ||
| By End Use | Commercial Delivery | Retail and Goods Delivery |
| Food and Beverage Delivery | ||
| Service Providers | ||
| Personal and Family Use | ||
| Institutional | ||
| Others | ||


Market Definition
- By Application Type - E-bikes considered under this segment include city/urban, trekking, and cargo/utility e-bikes. The common types of e-bikes under these three categories include off-road/hybrid, kids, ladies/gents, cross, MTB, folding, fat tire, and sports e-bike.
- By Battery Type - This segment includes lithium-ion batteries, lead-acid batteries, and other battery types. The other battery type category includes nickel-metal hydroxide (NiMH), silicon, and lithium-polymer batteries.
- By Propulsion Type - E-bikes considered under this segment include pedal-assisted e-bikes, throttle-assisted e-bikes, and speed pedelec. While the speed limit of pedal and throttle-assisted e-bikes is usually 25 km/h, the speed limit of speed pedelec is generally 45 km/h (28 mph).
| Keyword | Definition |
|---|---|
| Pedal Assisted | Pedal-assist or pedelec category refers to the electric bikes that provide limited power assistance through torque-assist system and do not have throttle for varying the speed. The power from the motor gets activated upon pedaling in these bikes and reduces human efforts. |
| Throttle Assisted | Throttle-based e-bikes are equipped with the throttle assistance grip, installed on the handlebar, similarly to motorbikes. The speed can be controlled by twisting the throttle directly without the need to pedal. The throttle response directly provides power to the motor installed in the bicycles and speeds up the vehicle without paddling. |
| Speed Pedelec | Speed pedelec is e-bikes similar to pedal-assist e-bikes as they do not have throttle functionality. However, these e-bikes are integrated with an electric motor which delivers power of approximately 500 W and more. The speed limit of such e-bikes is generally 45 km/h (28 mph) in most of the countries. |
| City/Urban | The city or urban e-bikes are designed with daily commuting standards and functions to be operated within the city and urban areas. The bicycles include various features and specifications such as comfortable seats, sit upright riding posture, tires for easy grip and comfortable ride, etc. |
| Trekking | Trekking and mountain bikes are special types of e-bikes that are designed for special purposes considering the robust and rough usage of the vehicles. These bicycles include a strong frame, and wide tires for better and advanced grip and are also equipped with various gear mechanisms which can be used while riding in different terrains, rough grounded, and tough mountainous roads. |
| Cargo/Utility | The e-cargo or utility e-bikes are designed to carry various types of cargo and packages for shorter distances such as within urban areas. These bikes are usually owned by local businesses and delivery partners to deliver packages and parcels at very low operational costs. |
| Lithium-ion Battery | A Li-ion battery is a rechargeable battery, which uses lithium and carbon as its constituent materials. The Li-Ion batteries have a higher density and lesser weight than sealed lead acid batteries and provide the rider with more range per charge than other types of batteries. |
| Lead Acid Battery | A lead acid battery refers to sealed lead acid battery having a very low energy-to-weight and energy-to-volume ratio. The battery can produce high surge currents, owing to its relatively high power-to-weight ratio as compared to other rechargeable batteries. |
| Other Batteries | This includes electric bikes using nickel–metal hydroxide (NiMH), silicon, and lithium-polymer batteries. |
| Business-to-Business (B2B) | The sales of e-bikes to business customers such as urban fleet and logistics company, rental/sharing operators, last-mile fleet operators, and corporate fleet operators are considered under this category. |
| Business-to-Customers (B2C) | The sales of electric scooters and motorcycles to direct consumers is considered under this category. The consumers acquire these vehicles either directly from manufacturers or from other distributers and dealers through online and offline channel. |
| Unorganized Local OEMs | These players are small local manufacturers and assemblers of e-bikes. Most of these manufacturers import the components from China and Taiwan and assemble them locally. They offer the product at low cost in this price sensitive market which give them advantage over organized manufacturers. |
| Battery-as-a-Service | A business model in which the battery of an EV can be rented from a service provider or swapped with another battery when it runs out of charge |
| Dockless e-Bikes | Electric bikes that have self-locking mechanisms and a GPS tracking facility with an average top speed of around 15mph. These are mainly used by bike-sharing companies such as Bird, Lime, and Spin. |
| Electric Vehicle | A vehicle which uses one or more electric motors for propulsion. Includes cars, scooters, buses, trucks, motorcycles, and boats. This term includes all-electric vehicles and hybrid electric vehicles |
| Plug-in EV | An electric vehicle that can be externally charged and generally includes all-electric vehicles as well as plug-in hybrids. In this report we use the term for all-electric vehicles to differentiate them from plug-in hybrid electric vehicles. |
| Lithium-Sulphur Battery | A rechargeable battery that replaces the liquid or polymer electrolyte found in current lithium-ion batteries with sulfur. They have more capacity than Li-ion batteries. |
| Micromobility | Micromobility is one of the many modes of transport involving very-light-duty vehicles to travel short distances. These means of transportation include bikes, e-scooters, e-bikes, mopeds, and scooters. Such vehicles are used on a sharing basis for covering short distances, usually five miles or less. |
| Low Speed Electric Vehicls (LSEVs) | They are low speed (usually less than 25 kmph) light vehicles that do not have an internal combustion engine, and solely use electric energy for propulsion. |


Research Methodology
Mordor Intelligence follows a four-step methodology in all its reports.
- Step-1: Identify Key Variables: To build a robust forecasting methodology, the variables and factors identified in Step-1 are tested against available historical market numbers. Through an iterative process, the variables required for market forecast are set and the model is built based on these variables.
- Step-2: Build a Market Model: Market-size estimations for the historical and forecast years have been provided in revenue and volume terms. Market revenue is calculated by multiplying the volume demand with volume-weighted average battery pack price (per kWh). Battery pack price estimation and forecast takes into account various factors affecting ASP, such as inflation rates, market demand shifts, production costs, technological developments, and consumer preferences, providing estimations for both historical data and future trends.
- Step-3: Validate and Finalize: In this important step, all market numbers, variables, and analyst calls are validated through an extensive network of primary research experts from the market studied. The respondents are selected across levels and functions to generate a holistic picture of the market studied.
- Step-4: Research Outputs: Syndicated Reports, Custom Consulting Assignments, Databases & Subscription Platforms


