
Residential Demand Response Management Systems Market Size and Share
Market Overview
| Study Period | 2021 - 2031 |
|---|---|
| Forecast Data Period | 2026 - 2031 |
| Historical Data Period | 2021 - 2024 |
| Growth Rate | 5.08 % |
| Fastest Growing Market | Asia Pacific |
| Largest Market | North America |
Major Players *Disclaimer: Major Players sorted in no particular order Image © Mordor Intelligence. Reuse requires attribution under CC BY 4.0. | |
Residential Demand Response Management Systems Market Analysis by Mordor Intelligence
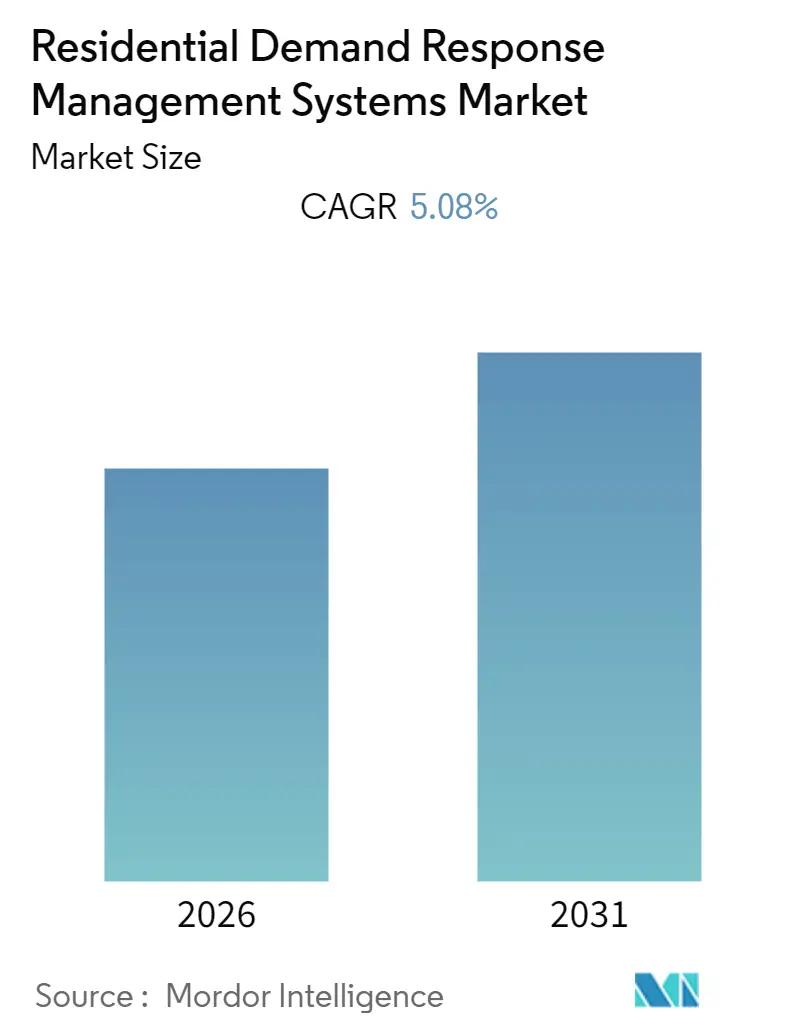
The Residential Demand Response Management Systems Market size is expected to register a CAGR of 5.08% during the forecast period.
- The residential demand response management system is expected to witness significant growth during the forecast period owing to the increasing deployment of smart grids across the globe and advancement in Automated demand response system & software technology with rising need for energy conservation.
- The integration of smart technologies in the existing grid structure is expected to create an ample amount of opportunities for the market players in the coming years.
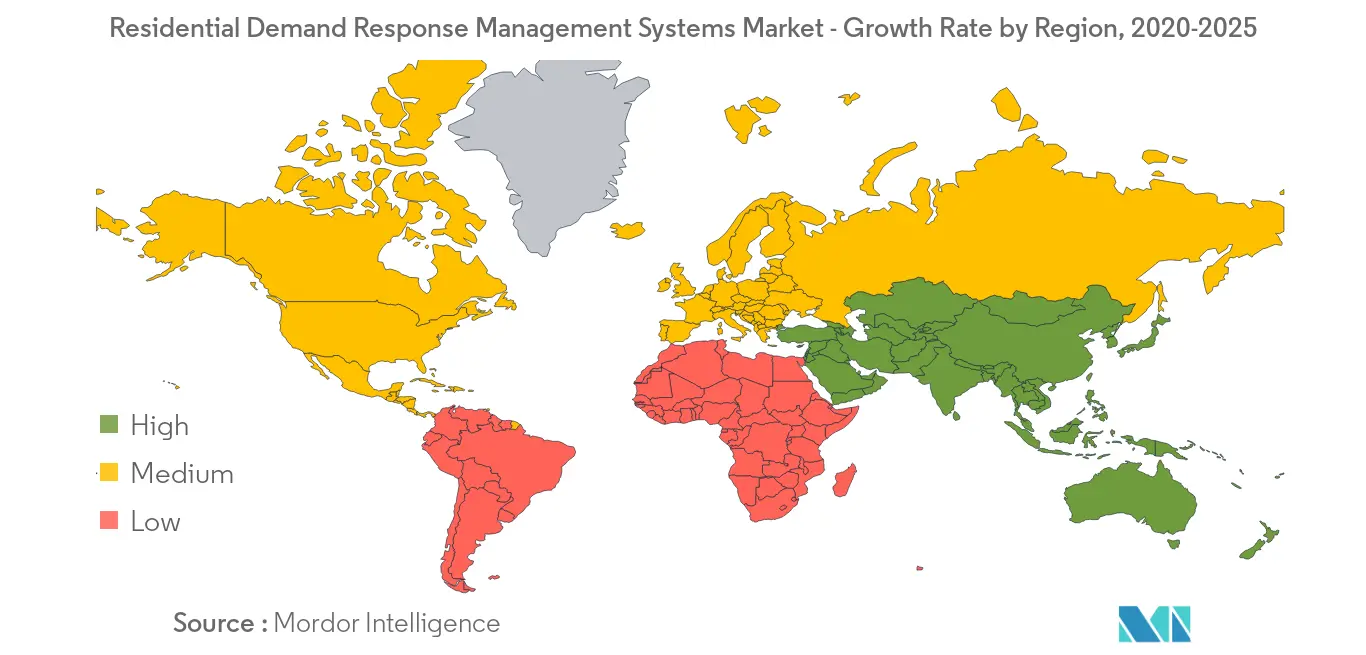
- Asia-Pacific is the fastest-growing market with China expected to be the largest market in the region. North America hold largest share in residential demand response management system market.
Note: Market size and forecast figures in this report are generated using Mordor Intelligence’s proprietary estimation framework, updated with the latest available data and insights as of 2026.
Global Residential Demand Response Management Systems Market Trends and Insights
Automated Demand Response System Expected Drive the Market
- Residential demand response is a dynamic energy infrastructure management program designed to support the stability of the electricity grid, and meet the global growing demand for energy with the assistance of energy users in residential sectors who agree to turn down certain electrical loads during periods of peak demand.
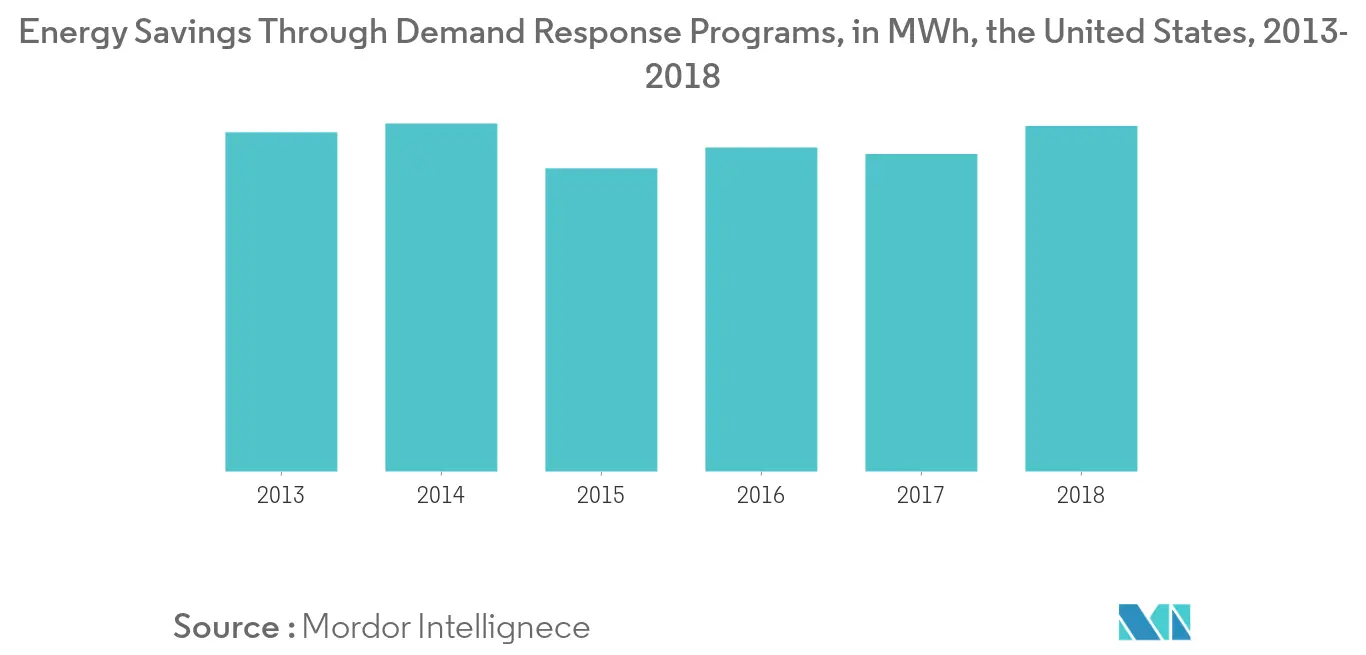
- Rapid economic development (over the past two decades) has led to a surge in the world's energy consumption, and this trend is expected to continue in the future. The global electricity domestic consumption in 2018 was 24,643 TWh, which is around 75% higher than the consumption in 2000. By 2030, the electricity demand is set to proliferate. Hence, in order to meet the increasing demand, the governments, worldwide, have begun to pay unprecedented attention to energy efficiency and grid stability.
- Developed countries are implementing large-scale smart grid components into their power systems such as Automated demand response system (ADR). ADR system is one such energy management solution, which is expected to help utilities across the world, to maintain grid reliability and keep cost low automatically. With rising smart grid activities across various countries, the demand for Automate demand response system is rising, and hence RDRMS is expected to witness growth in coming future.
- Therefore, the residential demand response management system is expected to grow because of its ability tothe greatest control, allowing customers to automatically or remotely manage energy consumption at times of peak demand.


Asia-Pacific to Witness a Significant Growth
- The market for residential demand response management system in the Asia-Pacific region is expected to witness significant growth during the forecast period.
- As a largest population nation with a forecasted peak load of more than one terawatt by 2020, China is a potentially large market for residential demand response management systems. The country has experienced shortages in power availability because of rapid economic growth, a situation that has ebbed in recent years. To manage this mismatch in electricity demand and supply, large residential customers were shifting toward RDRMS to uncompensated load reductions to reduce peak demand with bills.
- Adding to this, the Japanese residential demand response management systems market is likely to witness robust growth in the near future, on account of structural reforms in the country's power sector, which is aimed at market liberalization. Furthermore, the planned closure of nuclear power plants in the country is necessitating the industrial demand response programs in the country.
- The Japanese government is planning to modernize the country's power sector, by creating a competitive consumer market. For Japan, an open market is vital in creating the change that is essential for developing a sustainable energy sector. Since 2016, the Japanese electricity market has undergone a massive transformation through deregulation. The regulated tariff is scheduled for phase-out by 2020.
- Therefore, factors such as increasing efforts to modernize the power sector across the regions by the governments of respective countries are expected to drive the market studied during the forecast period.

Competitive Landscape
The residential demand response system market is moderately fragmented due to many companies operating in the industry. The key players in this market include Schneider Electric, Inc., Siemens, Hitachi Ltd, Mitsubishi Electric Corporation,GE Energy, ABB Ltd, and others.
Residential Demand Response Management Systems Industry Leaders
Schneider Electric
Siemens AG
Hitachi Ltd
Mitsubishi Electric Corporation
GE Energy
- *Disclaimer: Major Players sorted in no particular order


Market Opportunities and Future Outlook
Utility-led residential flexibility is shifting from territory-wide peak shaving toward substation-targeted, multi-DER programs that combine smart thermostats, EV charging, and behind-the-meter batteries. Eversource in Massachusetts is a clear example, with ConnectedSolutions+ and Managed Charging+ pilots aimed at managing load at specific substations and deferring distribution upgrades. This creates room for RDRMS providers to orchestrate device portfolios and deliver locational outcomes that utilities can verify.
Regulatory and market-design changes are also broadening the addressable opportunity for automated demand response and interoperability-focused platforms. In Texas, the Public Utility Commission adopted 16 TAC 25.186, setting a residential load reduction goal focused on smart responsive appliances, while ERCOT advanced discussion of a dedicated Residential Demand Response program through NPRR1296 and related assessments. Technical work such as DOE/PNNL grid-interactive efficient buildings (GEB) demand response guidance and EPRI interoperability efforts further reinforces the need for standards-aligned integrations (for example, OpenADR) between utilities, aggregators, and device ecosystems, supporting vendor differentiation around automated dispatch, measurement and verification, and secure device connectivity across regions.
Recent Industry Developments
- July 2026: Eversource reported customers reduced peak demand by 227 MW during the July 2, 2026 heat wave using its Connected Solutions demand response program. The event-level results provide evidence that utilities can use automated residential load control for reliability and peak management, which supports vendor procurement momentum for RDRMS platforms that can scale enrollment and deliver verified reductions.
- May 2026: Austin Energy partnered with EnergyHub to launch the Power Partner Battery program, enabling residential bring-your-own-battery participation. The program expands multi-DER virtual power plant operations and increases demand for software that can integrate different battery hardware, manage dispatch, and support customer settlement and program operations.
- May 2024: Voltus and Resideo launched new residential thermostat virtual power plant programs across PJM, ComEd, and NYISO (including PSEG Long Island territories). The expansion of thermostat-led VPPs into multiple wholesale and utility territories highlights the need for scalable automated demand response integrations and adds channels for RDRMS vendors through aggregator and OEM partnerships.


Research Methodology Framework and Report Scope
Market Definition and Coverage
For this study, the market includes platforms and software-led systems that help utilities and aggregators manage and dispatch residential demand response events, either manually supported or automated, across major grid regions.
Scope exclusions: We exclude broader home energy management devices when they are sold without a demand response management layer and an active link to a demand response program.
Segmentation Overview
- Type
- Conventional Demand Response
- Automated Demand Response
- Geography
- North America
- Europe
- Asia-Pacific
- South America
- Middle-East and Africa
Data Sources, Market Sizing, and Validation
Desk Research
Desk work started by mapping the demand response policy and enrollment environment, and then narrowing it down to what is clearly residential and program-linked. Public sources were used to build the first set of inputs, including US DOE and EIA materials, EU and national energy regulator publications, IEA statistics, and grid operator or ISO websites that publish program and event information.
To keep sizing practical, we also relied on utility program pages, public procurement and tender notices, company annual reports and investor presentations, and reputable press coverage that references deployments and partnerships. A paid subscription focused on company financials and news helped cross-check revenue mix hints and major contract timing, and a patent database helped validate the direction of automation and device orchestration features being built. These desk research sources are illustrative, and many other public documents and data points were also reviewed for collection, validation, and clarification.
Primary Interviews and Surveys
Primary work was used to verify what counts as an R-DRMS sale in practice, how software and services are bundled, and how pricing shifts with program scale and device counts. We spoke with a mix of utility-side stakeholders, implementation partners, product leaders, and operations managers across APAC, EMEA, and the Americas, so regional program maturity and rollout patterns could be reflected in the assumptions.
Distribution of primary research fieldwork respondents
| Company type | Respondent position | Region |
|---|---|---|
| Top tier: 39% | CXOs: 14% | APAC: 48% |
| Mid tier: 46% | Functional/Unit leaders: 29% | EMEA: 32% |
| Smaller Players: 15% | Managers: 57% | Americas: 20% |
Market-Sizing & Forecasting
Sizing was built using a top-down demand pool approach where residential program penetration and participating meter or household counts are used to reconstruct an addressable base by region, which is then translated into platform and service spending. Once those totals were shaped, we ran selective bottom-up checks using sampled contract pricing, typical per-endpoint fee logic, and a limited roll-up of visible supplier revenues to confirm that the market outputs were reasonable.
A few inputs that mattered in this market were the number of demand response programs that are open to residential customers, active enrollment and participation rates, growth in smart meter coverage, event frequency and seasonality (summer and winter peaks), and the pace of automation adoption versus conventional approaches. For pricing, we treated software subscription and implementation services separately where it could be observed, and then filled gaps with interview-led ranges when public detail was missing.
For forecasting, we used scenario analysis because policy support, utility budget cycles, and rollout timing can change faster than long-term device trends. The scenarios were anchored on expected residential enrollment growth, automation adoption, and grid flexibility targets shared by experts, and then blended into a central case after review.
Data Validation & Update Cycle
Outputs were checked against independent signals, such as reported program participation metrics, smart meter rollout progress, and publicly announced contract starts, and then variances were investigated before finalization. When a region showed a sudden jump or drop, the assumptions were revisited, and where needed, the interview set was re-contacted to confirm whether it was a real shift or a data timing issue.
Before sign-off, the model goes through multi-step internal reviews that focus on math checks, unit consistency, and whether assumptions align with how programs are run on the ground. Reports are refreshed annually, and interim updates are made when material policy changes, large tenders, or major rollout announcements occur. Right before delivery, a final pass is completed so the client receives the most current view available.
Mordor Intelligence's Global Residential Demand Response Management Systems Market Market Size Versus Other Published Estimates
Published market sizes for residential DRMS can look far apart because the scope lines are drawn differently and because program-linked revenue is not always separated cleanly from adjacent home energy categories. Differences also show up when one study uses a longer forecast window or applies aggressive adoption curves without matching them to actual program enrollment and event activity.
The table shows a wide spread mainly because some estimates fold in hardware, network infrastructure, or broader smart home energy controls, while others stay closer to the management system layer that utilities use to run events. In Mordor Intelligence's model, value is counted for residential demand response management systems under the two-type split (conventional versus automated) and it is tied back to regional program activity rather than treating all residential energy software spending as in-scope.
Benchmark comparison
| Source | Market Size | Gaps in Research Methodology |
|---|---|---|
| Mordor Intelligence | USD 6.42 B (2025) | |
| Trade Publisher A | USD 5.20 B (2023) | Uses an earlier base year and appears to keep the definition narrower in disclosed descriptions, which can undercount implementation and support revenue that scales with program expansion. |
| Industry Portal B | USD 5.98 B (2024) | Includes broader component buckets like hardware, network infrastructure, and communication systems, which increases comparability challenges versus a systems-led market boundary. |
Looking across the three figures, the practical driver is what gets bundled into the number and how closely it is anchored to verified residential program activity. By keeping the scope tied to program-linked management system spending and then validating it with contract and participation signals, the result stays transparent and repeatable even when public disclosures are limited.


Key Questions Answered in the Report
What is the current Residential Demand Response Management Systems Market size?
The Residential Demand Response Management Systems Market is projected to register a CAGR of 5.08% during the forecast period (2026-2031)
Who are the key players in Residential Demand Response Management Systems Market?
Schneider Electric, Siemens AG, Hitachi Ltd, Mitsubishi Electric Corporation and GE Energy are the major companies operating in the Residential Demand Response Management Systems Market.
Which is the fastest growing region in Residential Demand Response Management Systems Market?
Asia Pacific is estimated to grow at the highest CAGR over the forecast period (2026-2031).
Which region has the biggest share in Residential Demand Response Management Systems Market?
In 2025, the North America accounts for the largest market share in Residential Demand Response Management Systems Market.
What years does this Residential Demand Response Management Systems Market cover?
The report covers the Residential Demand Response Management Systems Market historical market size for years: 2020, 2021, 2022, 2023 and 2024. The report also forecasts the Residential Demand Response Management Systems Market size for years: 2026, 2027, 2028, 2029, 2030 and 2031.
Page last updated on:





