Utility Asset Management Market Size and Share
Market Overview
| Study Period | 2021 - 2031 |
|---|---|
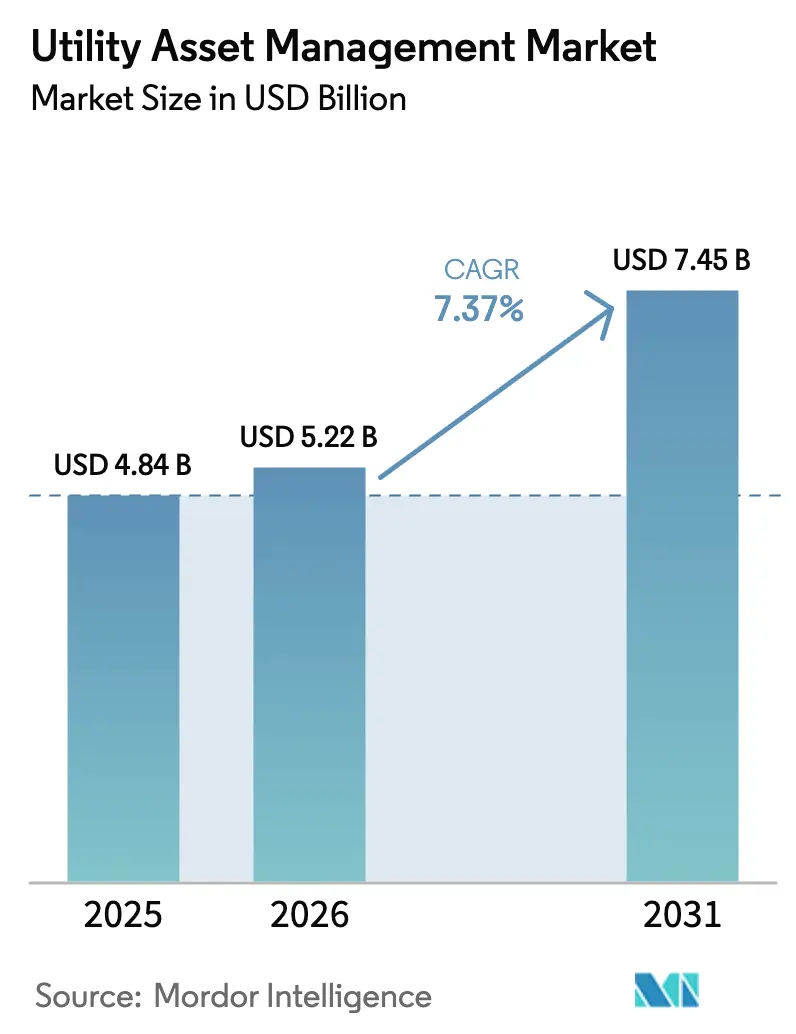
| Market Size (2026) | USD 5.22 Billion |
| Market Size (2031) | USD 7.45 Billion |
| Growth Rate (2026 - 2031) | 7.37% CAGR |
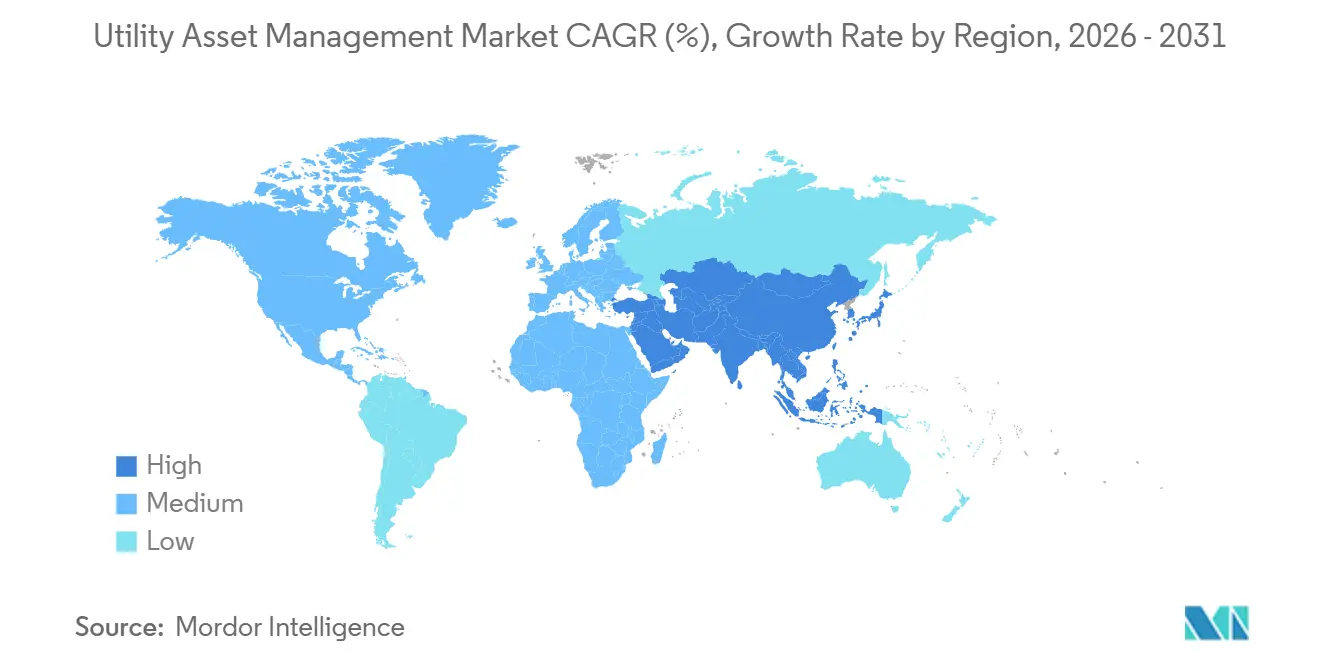
| Fastest Growing Market | Asia Pacific |
| Largest Market | North America |
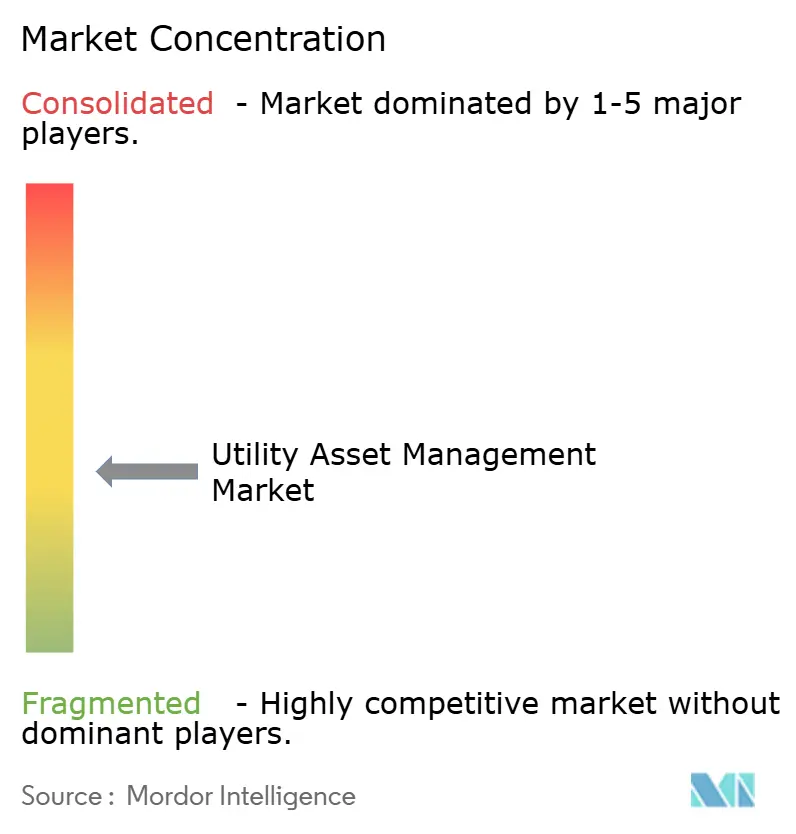
| Market Concentration | Medium |
Major Players *Disclaimer: Major Players sorted in no particular order Image © Mordor Intelligence. Reuse requires attribution under CC BY 4.0. | |
Utility Asset Management Market Analysis by Mordor Intelligence
The Utility Asset Management Market size is expected to increase from USD 4.84 billion in 2025 to USD 5.22 billion in 2026 and reach USD 7.45 billion by 2031, growing at a CAGR of 7.37% over 2026-2031.
A structural pivot toward predictive analytics is reshaping capital-allocation priorities as utilities now rank assets by the intersection of failure probability and revenue impact. Cloud economics, open data standards, and outcome-based software pricing are compressing payback cycles, while regulatory frameworks in North America and Europe reward reliability improvements with incentive returns. Simultaneously, AI-powered digital twins and IoT sensors are extending the service life of assets that once faced age-based replacement, releasing budget for grid-edge modernization and renewable integration. Competitive intensity is rising as hardware margins erode and vendors pursue subscription revenue tied to avoided outage minutes, reinforcing the medium-term shift from capital equipment to analytics platforms.
Key Report Takeaways
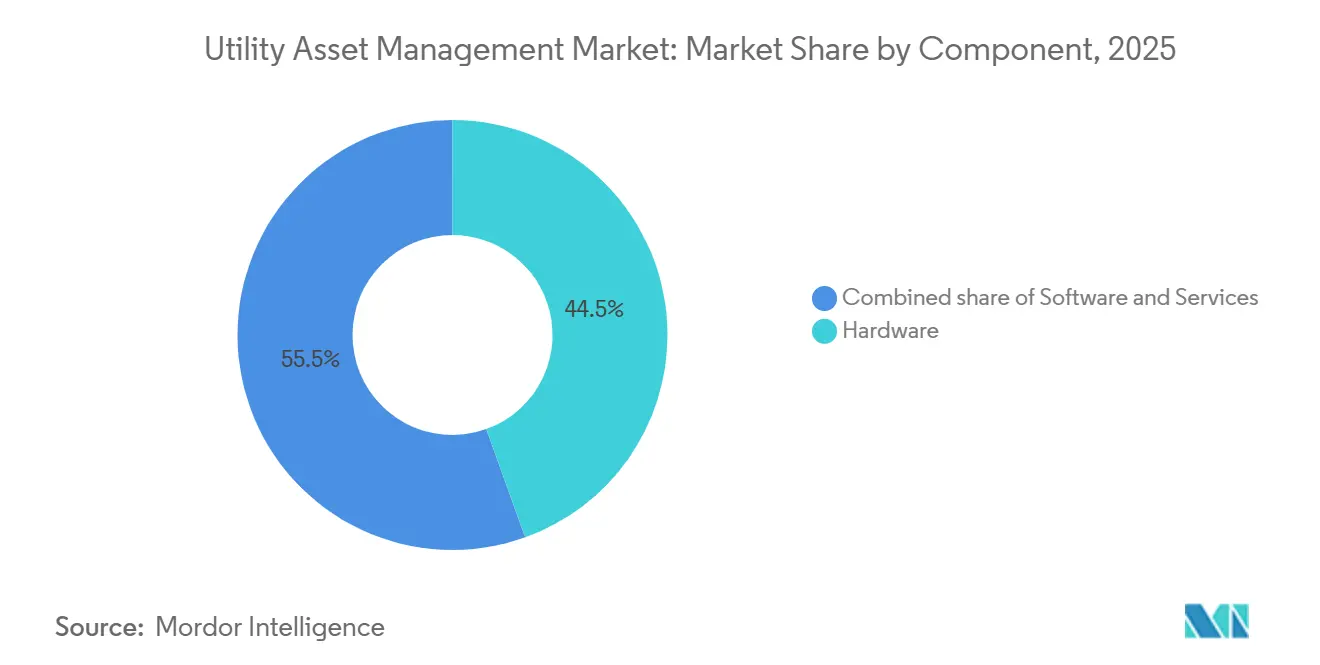
- By component, hardware led with 44.5% revenue share in 2025, whereas software is forecast to expand at a 10.4% CAGR through 2031.
- By deployment mode, cloud captured 48.0% of the utility asset management market share in 2025 and is projected to rise at a 12.5% CAGR to 2031.
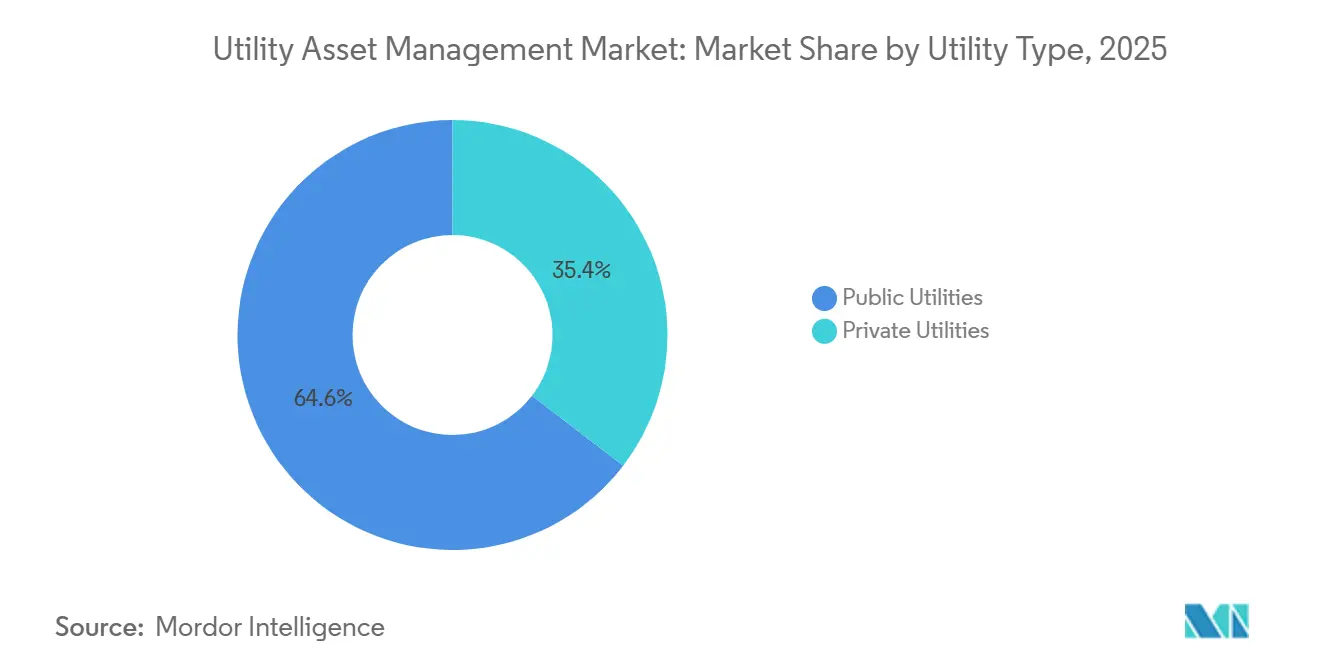
- By utility type, public operators held 64.6% of 2025 spending, while private utilities are expected to post an 11.0% CAGR through 2031.
- By application, transformer monitoring accounted for 35.3% of the utility asset management market size in 2025; transmission and distribution networks are advancing at a 9.8% CAGR to 2031.
- By geography, North America commanded 37.9% share in 2025, whereas the Asia-Pacific is forecast to grow at 11.6% over 2026-2031.
Note: Market size and forecast figures in this report are generated using Mordor Intelligence’s proprietary estimation framework, updated with the latest available data and insights as of 2026.
Global Utility Asset Management Market Trends and Insights
Drivers Impact Analysis*
| Driver | (~) % Impact on CAGR Forecast | Geographic Relevance | Impact Timeline |
|---|---|---|---|
| Aging grid infrastructure replacement & modernization | 2.1% | North America, Europe, with spillover to APAC legacy grids | Long term (≥ 4 years) |
| Integration of IoT sensors for real-time condition monitoring | 1.8% | Global, with early adoption in North America & APAC urban corridors | Medium term (2-4 years) |
| Rising renewable-energy penetration requiring advanced asset analytics | 1.5% | Europe, APAC (China, India), North America (California, Texas) | Medium term (2-4 years) |
| Regulatory mandates for reliability & outage reduction | 1.4% | North America (NERC, FERC jurisdictions), Europe (ENTSO-E, NIS2 Directive) | Medium term (2-4 years) |
| AI-powered digital twins slash unplanned transformer downtime | 1.3% | North America, Europe, APAC tier-1 utilities | Short term (≤ 2 years) |
| Infrastructure-as-a-Service financing for mid-tier utilities | 0.9% | Global, concentrated in South America, MEA, rural North America cooperatives | Medium term (2-4 years) |
| Source: Mordor Intelligence | |||
Aging Grid Infrastructure Replacement & Modernization
Seventy percent of U.S. power transformers were at least 25 years old in 2024, and lead times for large replacements stretched to 24 months due to steel-lamination shortages.[1]U.S. Department of Energy, “Grid Deployment Office Loan Program,” ENERGY.GOV Germany followed with a 2025 mandate requiring transmission operators to file 10-year renewal plans rooted in real-time health indices. Facing such constraints, utilities justify USD 50,000 annual monitoring fees that defer a USD 2 million transformer purchase and free capital for grid-edge projects. Economic logic favors condition-based life-extension when financing costs on premature replacement dwarf monitoring outlays. As regulators in the United States and Europe tie rate recovery to documented asset-health improvements, utilities embed dissolved-gas, infrared, and acoustic sensors to push service life beyond 40 years without compromising reliability.
Integration of IoT Sensors for Real-Time Condition Monitoring
The installed cost of a wireless vibration sensor with a five-year battery fell below USD 200 in 2024, unlocking pervasive monitoring of secondary transformers.[2]Siemens AG, “Annual Report 2025,” SIEMENS.COM Siemens reported deployment of more than 1 million IoT devices by 2025, capturing sub-second voltage, temperature, and partial-discharge data. China’s State Grid now embeds fiber-optic sensors every 500 meters along ultra-high-voltage corridors to detect ice loads and sag, enabling dynamic line-rating boosts of 10-15% during peaks. Local edge gateways process these streams, transmitting only anomalies to the cloud and reducing bandwidth costs by 80%, which strengthens the cost argument for utilities operating in rural territories where backhaul is expensive.
Rising Renewable-Energy Penetration Requiring Advanced Asset Analytics
Grids surpassing 30% wind-and-solar penetration suffer double the transformer failure rate of fossil-dominant systems absent real-time analytics. California utilities upgraded 8,000 distribution transformers and expanded advanced metering to counter reverse power flows triggered by 15 GW of rooftop solar. India’s USD 38 billion Revamped Distribution Sector Scheme links funding milestones to dashboards that flag transformers above nameplate during midday solar surges. Utilities that fuse weather forecasts, inverter output, and loading trends pre-stage mobile substations where solar ramps risk equipment overload, preventing outages and avoiding over-sizing capital projects.
AI-Powered Digital Twins Slash Unplanned Transformer Downtime
Hitachi Energy’s Lumada suite cut transformer outages 40% at a European TSO by predicting bushing failures six months ahead through machine-learning models trained on partial-discharge signatures. The economic payoff is stark: an unplanned outage of a 500-kV unit can impose USD 5 million in repairs and penalties versus a USD 200,000 annual software fee. ABB’s Ability Genix analyzes 15,000 connected transformers, spotting thermal hotspots that signal tap-changer wear and allowing part swaps at one-fifth the emergency-repair cost. FERC now allows digital-twin investments into the rate base if utilities verify reliability gains, anchoring a compliance-driven floor for adoption.[3]Federal Energy Regulatory Commission, “Policy Statement on Transmission Incentives,” FERC.GOV
Restraints Impact Analysis*
| Restraint | (~) % Impact on CAGR Forecast | Geographic Relevance | Impact Timeline |
|---|---|---|---|
| High upfront CAPEX for monitoring hardware & software | -1.2% | South America, MEA, rural North America cooperatives | Short term (≤ 2 years) |
| Cyber-security vulnerabilities in connected assets | -0.9% | Global, acute in North America & Europe under NERC CIP and NIS2 Directive | Medium term (2-4 years) |
| Ageing workforce & knowledge attrition slow digital adoption | -0.7% | North America, Europe, Japan (mature utility markets) | Long term (≥ 4 years) |
| Lengthy public-utility procurement cycles | -0.8% | Global, most pronounced in South America, MEA, and U.S. municipal utilities | Medium term (2-4 years) |
| Source: Mordor Intelligence | |||
High Upfront CAPEX for Monitoring Hardware & Software
Cooperatives serving fewer than 50,000 customers cite capital costs as the principal barrier, with 60% unable to bond projects above USD 1 million. Retrofitting legacy assets without data ports inflates installation expense, while per-asset licensing introduces cost cliffs that deter gradual rollouts. Outcome-based contracts, where vendors collect a slice of avoided outage costs, convert CAPEX to OPEX and align interests; Eskom’s pay-per-transformer-hour arrangement defers cash outlay until assets register 12 months of fault-free operation. Such financing innovation tempers the restraint but has yet to scale across regions with weak credit ratings.
Cyber-Security Vulnerabilities in Connected Assets
Thirty percent of industrial IoT devices lack secure boot, allowing malware to survive firmware updates.[4]Cybersecurity and Infrastructure Security Agency, “Industrial IoT Security Advisory 2024,” CISA.GOV NERC CIP-013 obliges U.S. utilities to vet supply chains, lengthening procurement by up to 12 months. Europe’s NIS2 directive mandates annual penetration tests and 24-hour breach disclosure, imposing compliance overhead that smaller operators struggle to absorb. Utilities are pivoting toward zero-trust segmentation, yet a 2025 IEEE survey found 70% lack in-house OT-security skills and must hire consultants at USD 300 per hour. These factors delay but seldom cancel projects, as cyber-secure architectures are increasingly bundled into vendor roadmaps.
*Our forecasts treat driver/restraint impacts as directional, not additive. The impact forecasts reflect baseline growth, mix effects, and variable interactions.
Segment Analysis
By Component: Software Accelerates Revenue Mix Shift
Software revenue is projected to grow at 10.4% annually, surpassing the overall utility asset management market rate as operators transition from one-time sensor purchases to recurring analytics subscriptions. Hardware commanded 44.5% in 2025, reflecting the installed sensor base, yet price competition from low-cost manufacturers compresses margins and nudges Western vendors toward proprietary algorithms. Services revenue expands alongside integration complexity; each new monitoring point can cost USD 3-5 in integration, creating a scalable services pool. Open Field Message Bus, ratified in 2024, enables multi-vendor interoperability and dilutes historic hardware-software bundling. Vendors differentiating through rapid deployment, KloudGin and Projetech offer pre-built connectors into IBM Maximo, capture utilities wary of 18-month customization cycles.
Software’s ascent improves operating leverage for suppliers and introduces lifetime-value metrics unfamiliar to equipment sellers, reshaping strategic planning. Utilities welcome the OPEX model, which aligns expense recognition with benefit accrual and reduces stranded-asset risk should technology leapfrog legacy deployments. Over the forecast horizon, the utility asset management market size attributable to software is expected to close half the gap with hardware as analytics become indispensable for compliance documentation and rate-case evidence.


By Deployment Mode: Cloud Dominates Yet Hybrid Persists
Cloud deployments held 48.0% in 2025, and the segment is forecast to grow 12.5% through 2031 as elastic compute eliminates the need to over-provision on-premise data centers. A McKinsey study shows breakeven at roughly 10,000 sensors, above which cloud subscription outlays undercut five-year in-house infrastructure costs. Regulatory acceptance accelerates adoption; Germany’s cybersecurity office permits public-cloud storage of non-personal grid data if encryption keys remain utility-controlled. Edge computing closes latency gaps: Cisco’s 2026 routers with embedded GPUs run sub-station algorithms locally, trimming backhaul by 90% and satisfying protection-scheme response times.
On-premise remains relevant for transmission operators bound by strict NERC CIP mandates, but most now favor hybrid architectures in which critical protection remains local while historical trend analysis moves to the cloud. As hyperscale providers obtain FedRAMP High and ISO 27001 certifications, the perceived security gap narrows, tipping utilities with aging data centers toward cloud migration during hardware refresh cycles.
By Utility Type: Private Operators Drive Early Adoption
Public entities accounted for 64.6% spending in 2025 owing to ownership of bulk-power assets, but private operators are projected to expand at 11.0% CAGR as competitive wholesale markets penalize outages that erode quarterly earnings. Merchant generators adopt software 18 months faster than public peers, a gap attributed to streamlined procurement and performance-indexed compensation. Brazil’s privatizations illustrate the trend: Enel Brasil earmarked BRL 2.5 billion (USD 500 million) toward grid digitalization through 2027, installing 500,000 smart meters and monitoring 12,000 transformers in São Paulo.
Public utilities progress when regulators implement performance-based rates that link returns to reliability. In such jurisdictions, adoption timelines converge with private benchmarks, indicating that incentive alignment trumps ownership. Vendors courting public clients must navigate multi-year appropriations, prevailing-wage rules, and domestic-content requirements, whereas private sales hinge on quantifiable payback within one regulatory cycle.
By Application: Transformers Anchor Spend, Networks Gain Momentum
Transformer monitoring absorbed 35.3% of the utility asset management market size in 2025 because the failure of a USD 10 million unit carries severe financial and reliability penalties. Online dissolved-gas sensors at sub-USD 5,000 per unit now stream health data into cloud analytics, reducing failure risk months in advance. Transmission and distribution network analytics, forecast to grow 9.8% through 2031, leverage phasor measurement units to pinpoint faults within seconds; GE Vernova’s 2026 contract covering 2,000 U.S. substations aims to cut restoration time 40%.
Sub-station and generation-asset monitoring trails, but will accelerate once utilities finish instrumenting high-risk transformers and pivot to secondary assets, reclosers, capacitor banks, and voltage regulators, that cumulatively drive outage statistics. As sensor penetration deepens, vendors with machine-learning pipelines trained on multi-asset data will widen performance gaps over niche point-solution providers.
Geography Analysis
North America led the utility asset management market with 37.9% share in 2025, catalyzed by the USD 65 billion Infrastructure Investment and Jobs Act earmarked for grid resilience. The U.S. Grid Deployment Office requires condition monitoring on assets financed via its USD 10.5 billion loan program, institutionalizing demand. Canadian funding of CAD 4.5 billion (USD 3.3 billion) supports similar modernization in Alberta and Ontario. Mexico’s plan to install 50,000 transformers in theft-prone zones underscores regional spillover. Performance-based regulation now spans 18 U.S. states, aligning earnings with reliability and embedding digital monitoring into rate cases.
Asia-Pacific is projected to grow at 11.6% CAGR to 2031. China’s State Grid invests CNY 520 billion (USD 73 billion) annually in ultra-high-voltage corridors that demand continuous monitoring to manage thermal stress. India ties USD 38 billion of distribution funding to smart meters and feeder analytics, targeting a 15% loss reduction. Japan mandates dynamic line rating by 2028 to accommodate offshore wind, while Korea Electric Power earmarked KRW 3 trillion (USD 2.3 billion) for AI-enabled maintenance. ASEAN utilities pilot projects in urban centers but face accelerated demand as 6% annual load growth pressures capacity.
Europe’s push to integrate 500 GW of offshore wind hinges on real-time cable monitoring, steering asset-management budgets toward harsh-marine applications. Germany’s TSOs invested EUR 8 billion (USD 8.7 billion) in 2024, allocating 15% to digital monitoring. The UK’s 99.95% reliability target for 2030 carries GBP 50 million annual penalties, making predictive analytics obligatory. France’s EUR 1.2 billion retrofit of 30,000 transformers seeks a 25% outage reduction by 2028. Nordic recovery-period caps accelerate adoption as utilities recoup digital expenses within three years.
South America is split: Brazil’s privatized concessionaires deploy analytics to slash technical losses to 6.5%, whereas capital-strained Argentina and Venezuela limit deployments to pilots. An Inter-American Development Bank loan earmarks USD 400 million for Buenos Aires monitoring systems. Chile’s 70% renewables target for 2030 drives the adoption of a dynamic rating that offsets multi-year permitting delays for new lines.
The Middle East and Africa show disparate progress. Saudi Arabia’s Vision 2030 allocates USD 50 billion for grid modernization, including 10 million smart meters. Dubai Electricity and Water Authority reached 99.99% reliability by deploying AI-predicted crew pre-positioning. Eskom pilots pay-per-outage contracts but remains constrained by USD 23 billion debt. Egypt’s ten-year plan targets 15% loss cuts by instrumenting Cairo transformers. Regional adoption, therefore, correlates tightly with fiscal capacity and policy commitments to reliability.

Competitive Landscape
The top five vendors, ABB, Siemens, Schneider Electric, GE Vernova, and Hitachi Energy, command approximately 45-50% of the utility asset management market revenue, signaling moderate concentration. Each leverages decades-old hardware footprints to upsell analytics, yet open standards weaken historical lock-in and invite cloud-native challengers like Oracle and IBM. Siemens reorganized its grid software in 2025, aiming for 60% subscription revenue by 2028. Schneider Electric’s acquisition of Aveva consolidates software ownership and enables bundled offers that unite hardware, SCADA, and digital twins. ABB migrated Ability Genix to Azure to deliver cloud-native scalability and no-code dashboards.
Disruptive entrants undercut traditional procurement: Sentient Energy embeds sensors at the factory, slicing field installation by 40%, while Aclara’s LoRaWAN platform offers 10-year batteries at USD 150 for rural co-ops. Machine-learning accuracy becomes a pricing lever; 85% prediction precision justifies premium subscriptions, whereas 60% levels induce commoditization. Regulatory pre-certification under NERC CIP or IEC 62351 yields procurement favor by compressing buy cycles 6-12 months, cementing compliance as a competitive moat.
Utility Asset Management Industry Leaders
ABB Ltd.
Siemens AG
General Electric Company
Schneider Electric SE
IBM Corporation
- *Disclaimer: Major Players sorted in no particular order

Recent Industry Developments
- October 2025: Hitachi announces advancements in energy and digital grid solutions, solidifying its leadership in utility asset management. The company’s integrated APM, EAM, and field service systems utilize AI-driven models to enhance asset health monitoring, regulatory compliance, and lifecycle optimization for global utilities.
- August 2025: TPG acquires Irth Solutions, a prominent utility asset management software provider that integrates geospatial, AI, and risk intelligence tools. Irth’s platform supports over 20,000 daily utility users with predictive insights for infrastructure resilience, enhancing TPG’s presence in critical utility asset management technologies.
- August 2025: Honeywell acquires SparkMeter’s Praxis, GridScan, and GridFin platforms to enhance its Forge Performance+ for Utilities. This acquisition bolsters utility asset management by improving grid visibility, cost optimization, and data-driven maintenance, aiding the modernization of distribution network assets amid increasing energy demand.
- April 2025: Barclays and Brookfield establish a long-term partnership to modernize payment acceptance infrastructure for utilities and critical infrastructure clients. This initiative aims to improve digital operational resilience and financial performance for service providers managing high-volume utility billing and asset-related payment workflows.


Global Utility Asset Management Market Report Scope
Utility Asset Management helps electric utilities to manage vital assets by keeping track of their age, consumption, and maintenance history, among other characteristics. The Utility Asset Management Industry is driven by rising energy consumption, aging infrastructure, expanding distributed energy resources, and the requirement for effective and dependable power. The Utility Asset Management Market report scope includes:
| Hardware |
| Software |
| Services |
| Cloud |
| On-premise |
| Hybrid/Edge |
| Public Utilities |
| Private Utilities |
| Transformers |
| Sub-stations |
| Transmission and Distribution Network |
| Generation Assets |
| North America | United States |
| Canada | |
| Mexico | |
| Europe | Germany |
| United Kingdom | |
| France | |
| Italy | |
| NORDIC Countries | |
| Russia | |
| Rest of Europe | |
| Asia-Pacific | China |
| India | |
| Japan | |
| South Korea | |
| ASEAN Countries | |
| Rest of Asia-Pacific | |
| South America | Brazil |
| Argentina | |
| Rest of South America | |
| Middle East and Africa | Saudi Arabia |
| United Arab Emirates | |
| South Africa | |
| Egypt | |
| Rest of Middle East and Africa |
| By Component | Hardware | |
| Software | ||
| Services | ||
| By Deployment Mode | Cloud | |
| On-premise | ||
| Hybrid/Edge | ||
| By Utility Type | Public Utilities | |
| Private Utilities | ||
| By Application | Transformers | |
| Sub-stations | ||
| Transmission and Distribution Network | ||
| Generation Assets | ||
| By Geography | North America | United States |
| Canada | ||
| Mexico | ||
| Europe | Germany | |
| United Kingdom | ||
| France | ||
| Italy | ||
| NORDIC Countries | ||
| Russia | ||
| Rest of Europe | ||
| Asia-Pacific | China | |
| India | ||
| Japan | ||
| South Korea | ||
| ASEAN Countries | ||
| Rest of Asia-Pacific | ||
| South America | Brazil | |
| Argentina | ||
| Rest of South America | ||
| Middle East and Africa | Saudi Arabia | |
| United Arab Emirates | ||
| South Africa | ||
| Egypt | ||
| Rest of Middle East and Africa | ||


Key Questions Answered in the Report
How quickly is the utility asset management market expected to grow?
It is projected to rise from USD 5.22 billion in 2026 to USD 7.45 billion by 2031, reflecting a 7.37% CAGR.
Which component segment is expanding fastest?
Software is advancing at a 10.4% CAGR as utilities shift from hardware procurement to analytics subscriptions.
Why are utilities adopting cloud deployment?
Cloud models eliminate over-provisioned data centers, reach economic breakeven past 10,000 sensors, and meet evolving cybersecurity standards.
Which region offers the strongest growth outlook?
Asia-Pacific is forecast to deliver 11.6% CAGR through 2031, led by large-scale investments in China and India.
What role do digital twins play in transformer reliability?
AI-enabled twins predict failures up to six months ahead, cutting unplanned transformer outages by as much as 40% at early adopters.
How concentrated is vendor competition?
The top five suppliers hold about half of revenues, resulting in a moderate concentration.
Page last updated on:


