Automated Demand Response Management System Market Size and Share
Market Overview
| Study Period | 2021 - 2031 |
|---|---|
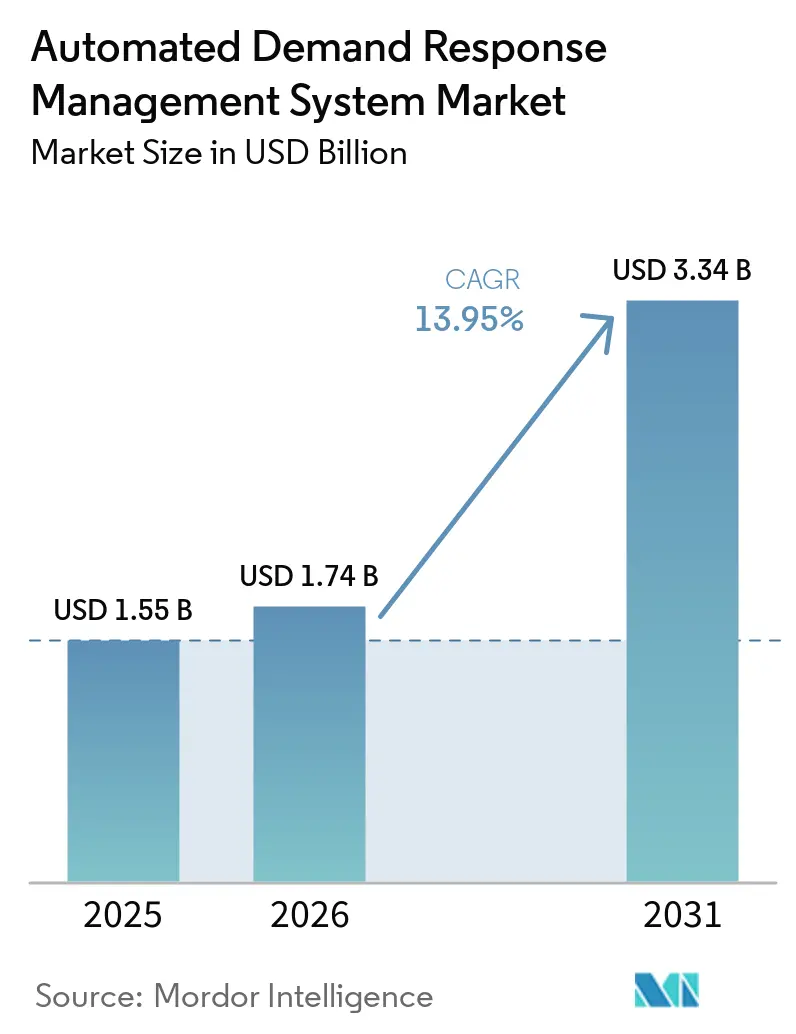
| Market Size (2026) | USD 1.74 Billion |
| Market Size (2031) | USD 3.34 Billion |
| Growth Rate (2026 - 2031) | 13.95% CAGR |
| Fastest Growing Market | Asia-Pacific |
| Largest Market | North America |
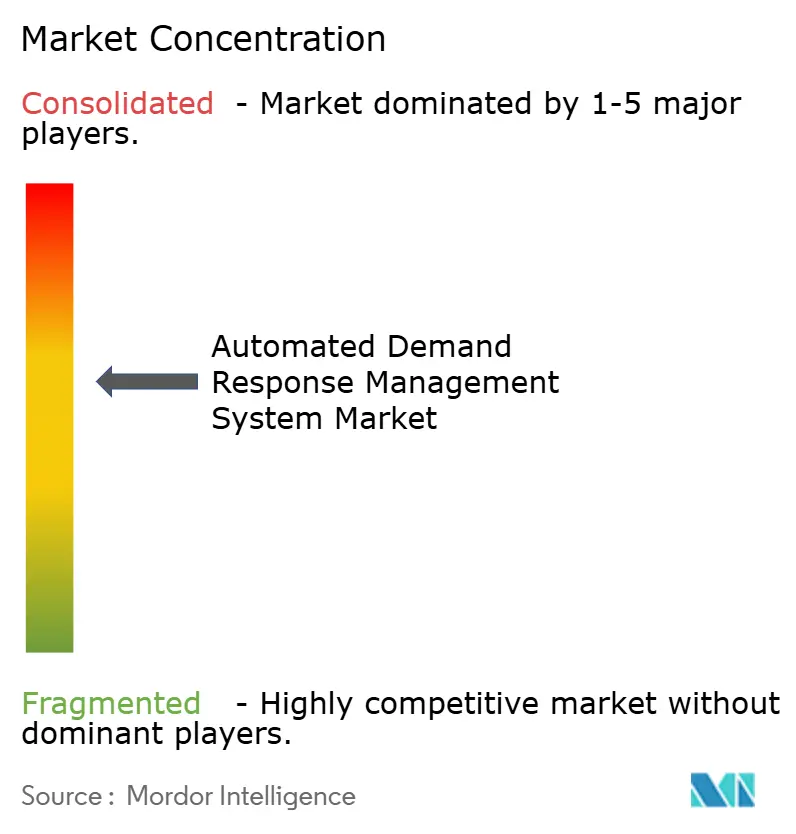
| Market Concentration | Medium |
Major Players *Disclaimer: Major Players sorted in no particular order Image © Mordor Intelligence. Reuse requires attribution under CC BY 4.0. | |
Automated Demand Response Management System Market Analysis by Mordor Intelligence
The Automated Demand Response Management System Market size is projected to expand from USD 1.55 billion in 2025 and USD 1.74 billion in 2026 to USD 3.34 billion by 2031, registering a CAGR of 13.95% between 2026 to 2031. Rising grid volatility from high renewable penetration and rapid electrification of transport, space heating, and data-center loads is stretching legacy transmission assets, pushing utilities toward flexible capacity that can be deployed faster than new wires. FERC Order 2222 in the United States, the EU Clean Energy Package, and China’s virtual-power-plant mandate are opening wholesale markets to aggregated distributed energy resources, creating revenue streams that improve program economics for aggregators and end users [1]EnergyHub, “EnergyHub Adds Resideo Grid Services,” energyhub.com. Technology costs have also fallen: LTE-M and NB-IoT modules now retail below USD 5, and lithium-ion battery pack prices dropped to USD 102 per kilowatt-hour in 2025, making residential participation feasible at scale.
Key Report Takeaways
- By solution, Automated DR Management & Analytics Platforms held 41.4% of 2025 revenue, while Services are advancing at a 15.3% CAGR through 2031.
- By communication technology, wireless protocols captured 42.8% of 2025 share; cellular is forecast to expand at 17.4% CAGR through 2031.
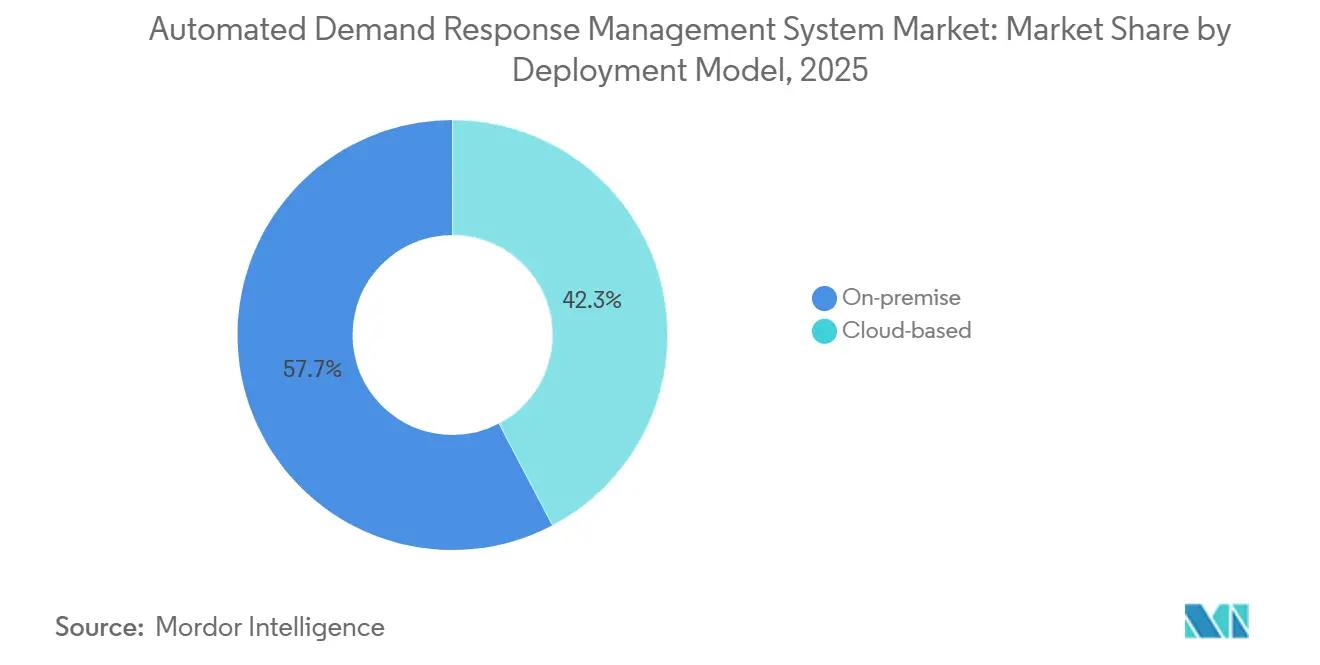
- By deployment model, on-premise installations represented 57.7% of 2025 revenue, yet cloud systems are growing at 17.1% CAGR to 2031.
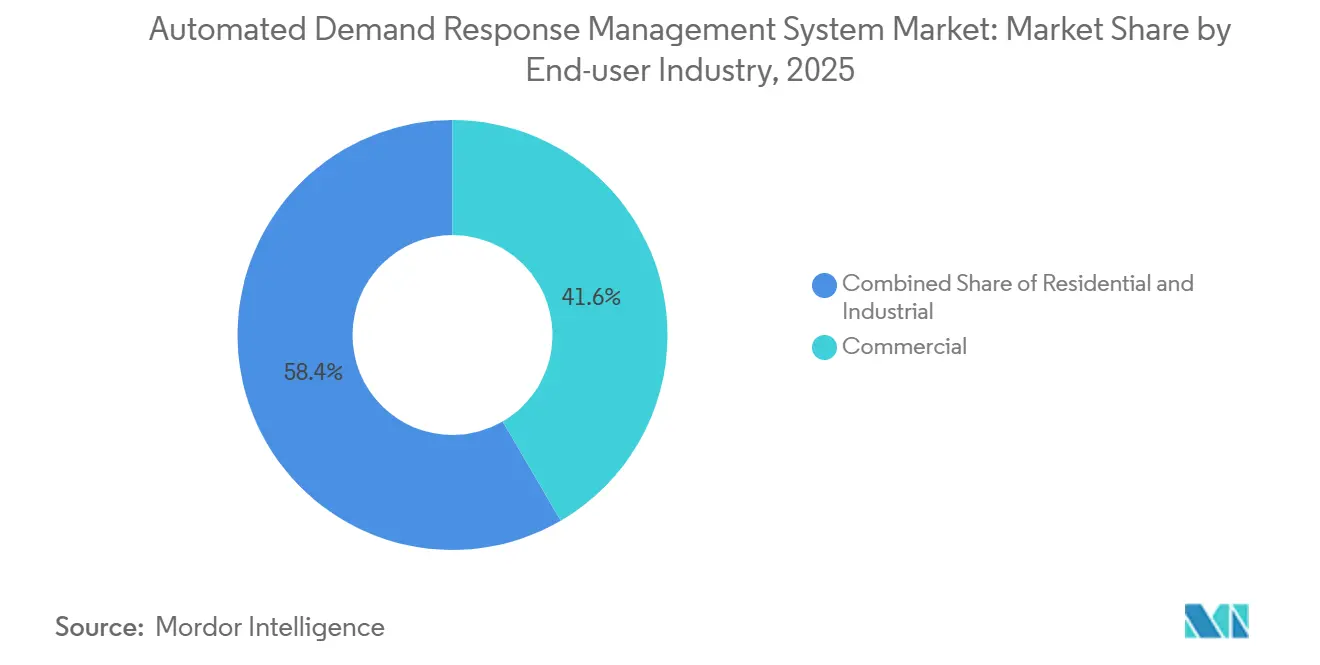
- By end user, commercial facilities led with 41.6% of 2025 revenue; the residential segment is projected to grow at a 15.6% CAGR through 2031.
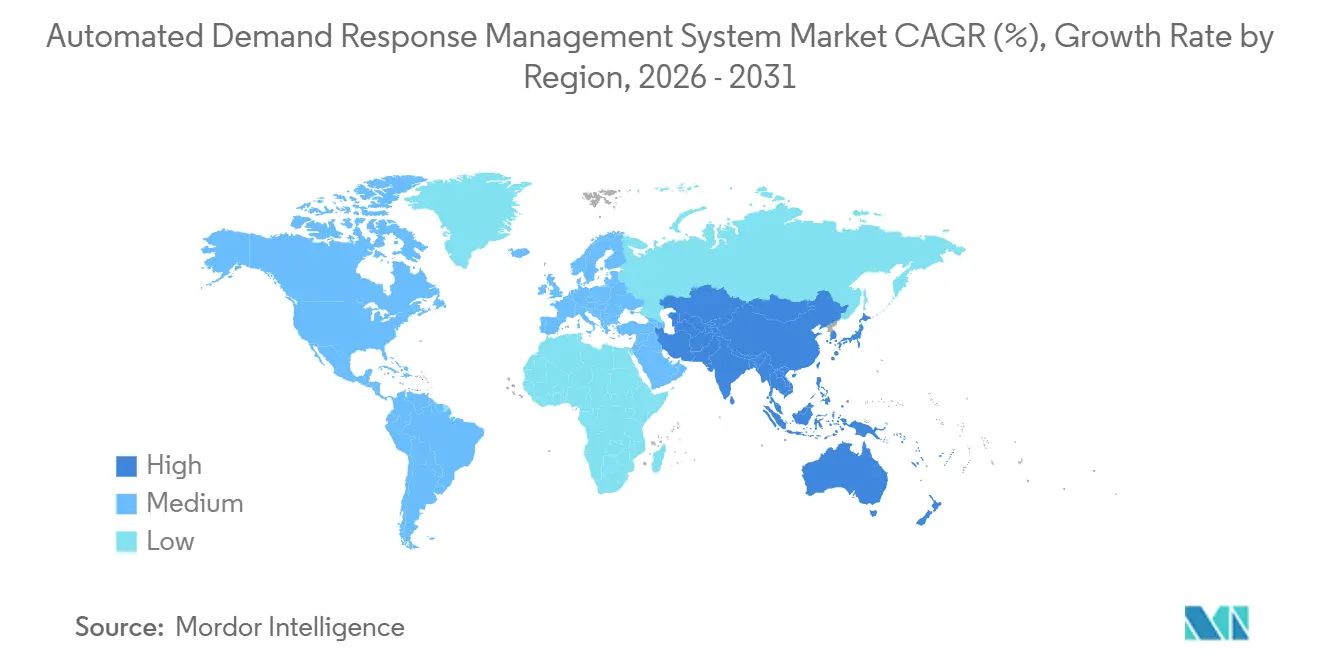
- By geograph, North America commanded 47.1% of 2025 value, but Asia-Pacific is on track to post the fastest regional CAGR at 16.7% to 2031.
Note: Market size and forecast figures in this report are generated using Mordor Intelligence’s proprietary estimation framework, updated with the latest available data and insights as of January 2026.
Global Automated Demand Response Management System Market Trends and Insights
Drivers Impact Analysis*
| Driver | (~) % Impact on CAGR Forecast | Geographic Relevance | Impact Timeline |
|---|---|---|---|
| Proliferation of dynamic electricity tariffs | +2.5% | Global, with early adoption in California, UK, Australia, New Zealand | Medium term (2-4 years) |
| Nationwide roll-out of advanced metering infrastructure (AMI) | +2.0% | North America, Europe (EU smart meter directive), APAC (China, India) | Long term (≥ 4 years) |
| Integration of DERs & micro-grids requiring real-time flexibility | +3.0% | Global, concentrated in high-renewable grids (California, Germany, South Australia, Nordic) | Medium term (2-4 years) |
| AI-enabled predictive load analytics improving DR program ROI | +2.5% | North America, Europe, APAC (early pilots in China, India) | Short term (≤ 2 years) |
| Utility push for peak-load shaving to avoid costly capacity additions | +2.2% | North America, Europe, APAC (China, India, Japan), MEA (UAE, Saudi Arabia) | Medium term (2-4 years) |
| Growth of transactive energy pilots leveraging blockchain | +0.8% | North America, Europe (Germany, Nordic), APAC (Australia, New Zealand) | Long term (≥ 4 years) |
| Source: Mordor Intelligence | |||
Proliferation of Dynamic Electricity Tariffs
Time-of-use and real-time pricing are exposing customers to wholesale volatility, rewarding automated curtailment during peak periods. Southern California Edison’s 2024 Flexible Pricing Pilot cut enrolled household bills by 12% and proved that pre-cooling thermostats can be automated at scale [2]Southern California Edison, “Flexible Pricing Pilot Results,” sce.com. New Zealand’s 2025 tariff reforms require every retailer to offer a dynamic option by 2027, pushing commercial portfolios to shift refrigeration and HVAC loads [3]Electricity Authority of New Zealand, “Default TOU Tariffs,” ea.govt.nz. The United Kingdom’s Agile program saw a 9% drop in evening demand during 2024-2025 grid-service trials, validating the role of fast dispatch paired with transparent tariffs. Aggregators embed machine-learning price forecasts to anticipate spikes, which further increases customer savings and enrollment.
Nationwide Roll-out of Advanced Metering Infrastructure (AMI)
Smart-meter penetration in the United States reached 88% in 2024, up from 50% in 2019, giving utilities the interval data needed for five-minute price signals and load verification. Consolidated Edison’s rollout across New York achieved 98% two-way communication, clearing the path for residential programs that rely on secure firmware updates. The EU smart-meter directive and China’s State Grid mandate are driving similar upgrades, although rural cooperatives and municipal utilities lag due to capex constraints. High-resolution data lets AI models disaggregate appliance loads and fine-tune dispatch, which was impossible under monthly reads.
Integration of DERs and Micro-grids Requiring Real-Time Flexibility
Shanghai’s virtual power plant dispatched 1.163 MW across solar, batteries, and EVs during summer 2025 peaks, proving sub-second aggregation of heterogeneous assets. PG&E’s SAVE pilot enrolled 1,500 residential batteries that delivered 100 event-hours in their first season, demonstrating that open APIs can coordinate multi-vendor fleets. Peer-reviewed research shows that multi-timescale optimization lowers operating costs by 18%, underscoring the value of predictive coordination.
AI-enabled Predictive Load Analytics Improving DR Program ROI
Voltus cut non-performance penalties by 22% across PJM and ERCOT after deploying gradient-boosting models that predict opt-outs. Constellation Energy and GridBeyond lifted revenue per megawatt by 15% through AI-based frequency regulation bids. A 2026 study in Scientific Reports found that smart-home optimization shaved Egyptian household bills by 18%, highlighting global applicability. Vendors owning proprietary dispatch data gain accuracy advantages that are hard for new entrants to replicate.
Restraints Impact Analysis*
| Restraint | (~) % Impact on CAGR Forecast | Geographic Relevance | Impact Timeline |
|---|---|---|---|
| Cyber-security vulnerabilities in two-way DR communications | -1.5% | Global, acute in North America and Europe with stringent NERC CIP and NIS2 compliance | Short term (≤ 2 years) |
| Fragmented regulatory mandates across states & regions | -1.0% | North America (state-by-state variation), Europe (member-state discretion), APAC (provincial/national splits) | Medium term (2-4 years) |
| Customer fatigue & opt-out risk due to event over-notification | -0.8% | North America, Europe, APAC (residential DR programs) | Short term (≤ 2 years) |
| Scarcity of open, vendor-agnostic ADRMS standards | -0.7% | Global, particularly impacting multi-vendor deployments in fragmented markets | Medium term (2-4 years) |
| Source: Mordor Intelligence | |||
Cyber-security Vulnerabilities in Two-way DR Communications
NIST IR 8473 cataloged 37 attack scenarios that could hijack dispatch signals or exfiltrate usage data, prompting utilities to demand certificate-based authentication and device-level anomaly detection [4]National Institute of Standards and Technology, “Cybersecurity Framework for Distributed Energy Resources IR 8473,” nist.gov. The International Energy Agency reported a 25% increase in energy-sector cyber incidents in 2024, several of which targeted demand-response platforms. IEEE surveys found 62% of installations still lack full end-to-end encryption, pushing procurement cycles to include mandatory penetration testing and breach-insurance clauses.
Fragmented Regulatory Mandates Across States and Regions
FERC Order 2222 created nine distinct ISO rulebooks, forcing aggregators to localize telemetry and settlement modules, which inflates software development costs. California requires residential batteries to maintain a 20% backup reserve, while Texas allows full discharge, compelling vendors to maintain separate dispatch logic across neighboring markets. Europe’s draft Network Code seeks harmonization, yet member-state discretion on compensation floors still fragments market economics.
*Our forecasts treat driver/restraint impacts as directional, not additive. The impact forecasts reflect baseline growth, mix effects, and variable interactions.
Segment Analysis
By Solution: Services Outpace Platforms on Outsourcing Wave
In 2025, Automated DR Management & Analytics Platforms accounted for 41.4% of revenue as utilities integrated with existing SCADA. The Automated Demand Response Management System market size for Services is projected to expand at a 15.3% CAGR to 2031 as utilities shift ISO scheduling, enrollment, and settlement tasks to third-party specialists. Managed-service vendors pool device integration across thermostats, batteries, and EV chargers, lowering per-endpoint cost while assuming performance risk. Turnkey offerings like EnergyHub’s post-acquisition portfolio now cover over 2.5 million DERs, a scale most utilities cannot match internally.
Services growth also reflects regulatory pressure to deliver equity outcomes; program administrators leverage aggregator call centers and digital portals to recruit disadvantaged communities quickly. Vertically integrated utilities still explore proprietary DERMS to avoid revenue leakage, but competitive retail suppliers prefer performance-based contracts tied to market clearing prices. As a result, platform vendors are bundling consulting, integration, and settlement into unified subscriptions.
By Communication Technology: Cellular Gains on Coverage and Security
Wireless mesh held 42.8% of 2025 deployments, yet cellular protocols are forecast to grow at 17.4% CAGR as utilities favor carrier networks that meet AMI security mandates. Automated Demand Response Management System market share for cellular is bolstered by SIM-based key provisioning that satisfies CPUC encryption rules without costly gateway rollouts. NB-IoT’s sub-USD 5 modules and decade-long battery life bring residential per-endpoint costs below USD 2 monthly, critical for mass enrollment.
Studies in Sensors showed 94% packet delivery for LoRa hybrids but flagged integration gaps with billing back-ends, while PLC remains niche in Europe where PRIME standards persist. Latency constraints channel high-value frequency regulation to wired Ethernet or fiber, leaving 5-minute dispatch services to cellular endpoints. Utilities are therefore adopting tiered architectures that combine on-premise fast loops with cloud analytics delivered via LTE-M.
By Deployment Model: Cloud Scales Faster Despite On-premise Incumbency
On-premise control rooms held 57.7% of 2025 revenue because NERC CIP rules discourage internet-facing systems. Cloud platforms, however, are expanding at 17.1% CAGR as aggregators need elastic compute to manage thousands of endpoints across multiple ISOs. Automated Demand Response Management System market size for cloud deployments benefits from faster onboarding, as PG&E’s SAVE pilot connected 1,900 devices in 90 days using Sunrun’s AWS stack.
Utilities still insist on hybrid topologies: dispatch commands originate from firewall-protected head-ends, while forecasting engines reside in the cloud for nightly model retraining. Data-residency laws in China and India oblige vendors to spin-up regional instances, trimming some economies of scale but accelerating local system-integrator partnerships.


By End-user Industry: Residential Enrollment Accelerates on Equity Mandates
Commercial buildings led with 41.6% of 2025 revenue owing to centralized BMS integration and predictable HVAC loads. The Automated Demand Response Management System market size for residential participants is forecast to climb at a 15.6% CAGR through 2031, powered by bring-your-own-thermostat offers and battery incentives that cut acquisition costs to under USD 50 per home. State regulators now require that 40-60% of new enrollments come from low-income ZIP codes, prompting utilities to automate eligibility checks within enrollment portals.
Industrial facilities remain the highest per-site capacity contributors, often 5-50 MW, and fetch premium revenues in frequency-regulation markets due to sub-second response. However, process-interruption risks and bespoke SCADA links limit vendor scalability. Residential programs must chase volume: ISO minimum bids of 100 kW force aggregators to assemble tens of thousands of 3 kW homes, a challenge met by automated baseline calculations and gamified mobile apps that sustain customer engagement.
Geography Analysis
North America accounted for 47.1% of 2025 revenue and hosts the most sophisticated regulatory framework for aggregated DERs. California budgeted over USD 200 million for demand response between 2025 and 2027, targeting 1 GW of new flexible capacity while mandating that 60% of participants come from disadvantaged communities. ERCOT registered 3,200 MW of economic DR capacity in 2024, yet residential contributions remain below 10% due to backup-power concerns during multi-day heat waves. Canada’s Ontario ISO opened its 2024 capacity auction to DR resources, and Mexico launched time-of-use pilots in Monterrey, signaling continental expansion beyond the United States.
Asia-Pacific is the fastest growing region, with a forecast CAGR of 16.7%. China’s national virtual-power-plant program dispatched more than 1 MW during its first summer and has state backing to scale nationwide by 2030. India’s Central Electricity Authority calls for 27 GW of battery storage and 20 GW of pumped hydro by 2030; AutoGrid’s partnership with PTC India will use AI orchestration to aggregate flexible HVAC and EV loads. Japan dropped minimum bid sizes in balancing markets to include residential capacity, while South Korea and ASEAN economies are piloting industrial DR under flat tariffs that may evolve into dynamic pricing by 2028.
In Europe, the draft Network Code on Demand Response aims to standardize telemetry by 2027. However, variations in compensation floors continue to complicate cross-border aggregation. In the United Kingdom, the Agile tariff reduced evening peak demand by 9% during 2024-2025. Germany has lowered its minimum frequency-containment bid requirement from 1 MW to 100 kW, enabling the participation of aggregated batteries. Nordic countries utilize over 95% smart-meter penetration to synchronize heat-pump dispatch with wind energy forecasts. In contrast, Southern and Eastern Europe face challenges due to limited advanced metering infrastructure (AMI) deployment, with Serbia and Montenegro reporting rollout rates below 20%. Despite wartime grid challenges, Ukraine has licensed six storage aggregators.

Competitive Landscape
The Automated Demand Response Management System market is semi-consolidated. Industrial-automation majors ABB, Siemens, Honeywell, Schneider Electric, Johnson Controls bundle DERMS modules into existing BMS or SCADA deals, leveraging installed footprints. Cloud-native challengers such as Virtual Peaker emphasize rapid integration and AI algorithms. Uplight’s 2025 purchase of AutoGrid merged customer engagement with 6 GW of flexible capacity, creating an end-to-end stack that spans billing, device orchestration, and market settlement. EnergyHub’s acquisition of Resideo Grid Services created one of the world’s largest DER portfolios, covering 2.5 million devices and 300 utility programs.
Strategic gaps remain around data-center DR, vehicle-to-grid aggregation, and blockchain-based peer trading. Eaton and Siemens Energy now offer 500 MW modular power plants for hyperscalers facing interconnection delays, enabling them to earn grid revenues while awaiting capacity upgrades. EV participation is stymied by automaker-utility interoperability, with fewer than 2% of California vehicles on managed charging despite 10 GWh of installed battery capacity. Vendors now compete on forecast accuracy; proprietary datasets of millions of dispatch events yield machine-learning models that minimize non-performance penalties and justify performance-based revenue shares.
Automated Demand Response Management System Industry Leaders
AutoGrid Systems Inc.
Siemens AG
Schneider Electric SE
Itron Inc.
Honeywell International Inc.
- *Disclaimer: Major Players sorted in no particular order

Recent Industry Developments
- January 2026: ABB launched ReliaHome Flex, a residential load-balancing system that lets homeowners add EV chargers and heat pumps without service-line upgrades, widening the pool of households eligible for automated DR enrollment.
- December 2025: EnergyHub acquired Resideo Grid Services, uniting 2.5 million DERs under a common Edge DERMS and expanding participation to six wholesale markets.
- September 2025: Eaton invested in Xendee to pair on-premise microgrid controllers with cloud predictive control, supporting 27 technology types across North America and Europe.
- June 2025: Eaton and Siemens Energy partnered on standardized 500 MW power plants for data centers, combining turbines, batteries, and grid interfaces to monetize flexible capacity.


Global Automated Demand Response Management System Market Report Scope
An Automated Demand Response Management System (ADRMS) is an advanced energy management platform designed to automate electricity consumption adjustments based on real-time grid conditions. It helps utilities and consumers reduce peak demand, enhance grid stability, minimize costs, and facilitate the efficient integration of renewable energy sources.
The Automated Demand Response Management System market is segmented by solution, communication technology, deployment model, end-user industry, and geography. By solution, the market is segmented into automated DR management and analytics platforms, DR control and aggregation software, customer enrollment and engagement portals, and services. By communication technology, the market is segmented into wired, wireless, and cellular. By deployment model, the market is segmented into on-premise and cloud-based solutions. By end-user industry, the market is segmented into residential, commercial, and industrial sectors. By geography, the market is analyzed across North America, Europe, Asia-Pacific, South America, and the Middle East and Africa. The report also covers market sizes and forecasts for the automated demand response management system market across major countries within these regions. For each segment, the market sizing and forecasts have been conducted based on value (USD).
| Automated DR Management and Analytics Platforms |
| DR Control and Aggregation Software |
| Customer Enrollment and Engagement Portals |
| Services (Consulting, Integration, Managed DR) |
| Wired (PLC, Ethernet) |
| Wireless (Wi-Sun, ZigBee, RF Mesh) |
| Cellular (LTE-M, NB-IoT, 5G) |
| On-premise |
| Cloud-based |
| Residential |
| Commercial |
| Industrial |
| North America | United States |
| Canada | |
| Mexico | |
| Europe | Germany |
| United Kingdom | |
| France | |
| Italy | |
| NORDIC Countries | |
| Russia | |
| Rest of Europe | |
| Asia-Pacific | China |
| India | |
| Japan | |
| South Korea | |
| ASEAN Countries | |
| Rest of Asia-Pacific | |
| South America | Brazil |
| Argentina | |
| Rest of South America | |
| Middle East and Africa | Saudi Arabia |
| United Arab Emirates | |
| South Africa | |
| Egypt | |
| Rest of Middle East and Africa |
| By Solution | Automated DR Management and Analytics Platforms | |
| DR Control and Aggregation Software | ||
| Customer Enrollment and Engagement Portals | ||
| Services (Consulting, Integration, Managed DR) | ||
| By Communication Technology | Wired (PLC, Ethernet) | |
| Wireless (Wi-Sun, ZigBee, RF Mesh) | ||
| Cellular (LTE-M, NB-IoT, 5G) | ||
| By Deployment Model | On-premise | |
| Cloud-based | ||
| By End-user Industry | Residential | |
| Commercial | ||
| Industrial | ||
| By Geography | North America | United States |
| Canada | ||
| Mexico | ||
| Europe | Germany | |
| United Kingdom | ||
| France | ||
| Italy | ||
| NORDIC Countries | ||
| Russia | ||
| Rest of Europe | ||
| Asia-Pacific | China | |
| India | ||
| Japan | ||
| South Korea | ||
| ASEAN Countries | ||
| Rest of Asia-Pacific | ||
| South America | Brazil | |
| Argentina | ||
| Rest of South America | ||
| Middle East and Africa | Saudi Arabia | |
| United Arab Emirates | ||
| South Africa | ||
| Egypt | ||
| Rest of Middle East and Africa | ||


Key Questions Answered in the Report
What is projected global value of Automated Demand Response Management System in 2031?
The automated demand response management market is forecast to reach USD 3.34 billion by 2031.
Which region will record the fastest growth through 2031?
Asia-Pacific is expected to post the quickest expansion at 16.7% CAGR.
What segment is forecast to expand the most rapidly?
Services will outpace platforms with a projected 15.3% CAGR to 2031.
Why are utilities shifting toward cellular communications?
Carrier networks deliver wide-area coverage and SIM-based security that simplify compliance with new AMI encryption mandates.
How big is the residential opportunity?
Residential enrollment is set to grow at 15.6% CAGR as equity mandates and bring-your-own-device programs reduce participation barriers.
Page last updated on:


