Asia-Pacific Demand Response Management System Market Size and Share
Market Overview
| Study Period | 2021 - 2031 |
|---|---|
| Forecast Data Period | 2026 - 2031 |
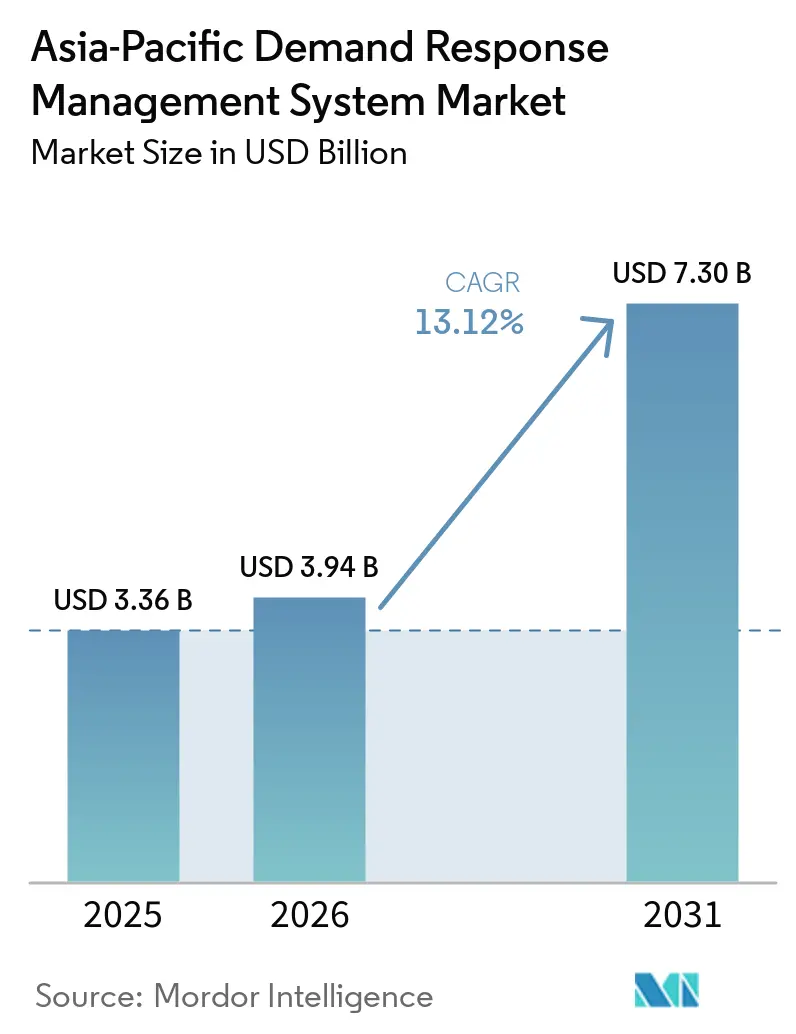
| Base Year Market Size (2025) | USD 3.36 Billion |
| Market Size (2026) | USD 3.94 Billion |
| Market Size (2031) | USD 7.30 Billion |
| Growth Rate (2026 - 2031) | 13.12% CAGR |
| Market Concentration | Medium |
Major Players *Disclaimer: Major Players sorted in no particular order Image © Mordor Intelligence. Reuse requires attribution under CC BY 4.0. | |
Asia-Pacific Demand Response Management System Market Analysis by Mordor Intelligence
The Asia-Pacific Demand Response Management System Market size was valued at USD 3.36 billion in 2025 and is estimated to grow from USD 3.94 billion in 2026 to reach USD 7.30 billion by 2031, at a CAGR of 13.12% during the forecast period (2026-2031). Accelerated growth reflects Asia-Pacific’s decisive shift from static price-signal programs toward automated, incentive-driven platforms that monetize grid flexibility in real time. Rapid smart-meter rollouts, proliferating behind-the-meter solar-plus-storage assets, and the formalization of capacity markets are widening revenue pools for software-centric virtual power plant (VPP) platforms. Utilities now prioritize telemetry, forecasting accuracy, and millisecond-level dispatch over legacy phone-tree curtailment, and regulators are rewarding availability rather than mere consumption reduction. Meanwhile, large industrial electrification projects and hyperscale data-center commitments are unlocking megawatt-scale load flexibility that software aggregators can stack across multiple wholesale products. Competitive dynamics favor vendors that blend cloud-native orchestration with secure, standards-based communications, because distribution utilities are tightening cyber-security protocols before granting real-time access to operational assets.
Key Report Takeaways
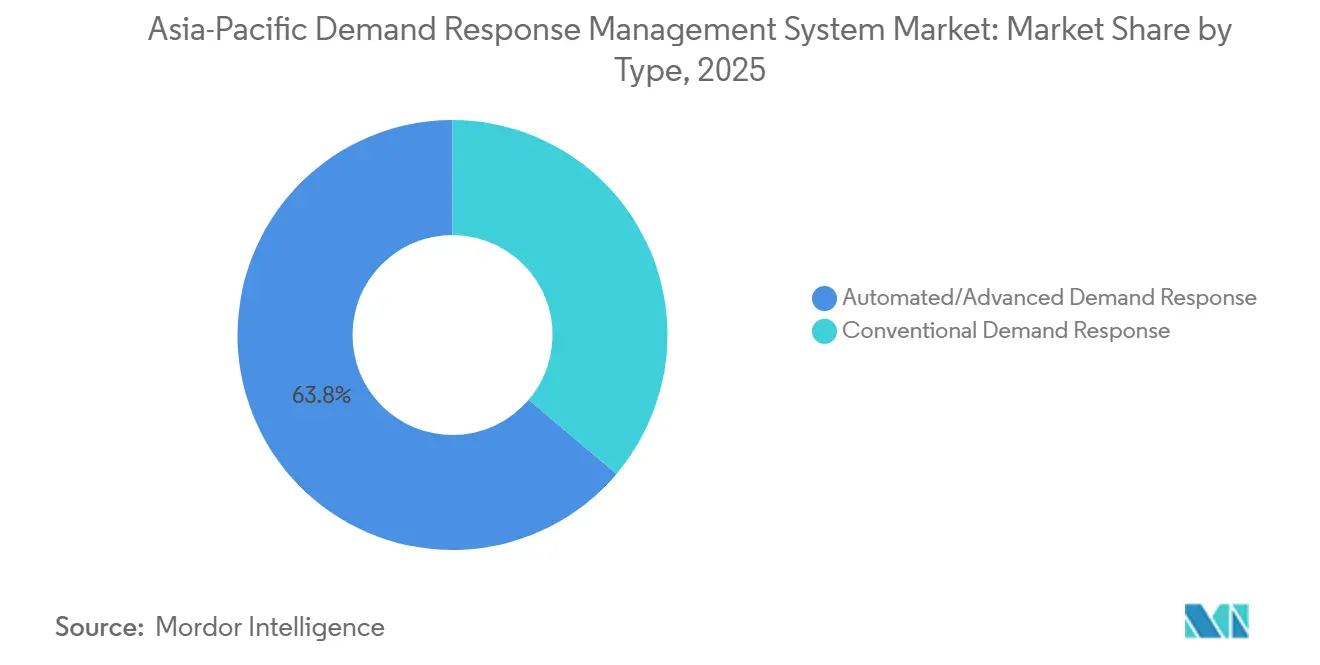
- By type, automated and advanced solutions held 63.8% share of the demand response management system market in 2025, and they are forecast to grow at 14.8% CAGR through 2031.
- By program type, price-based tariffs accounted for 59.5% of 2025 revenue, while incentive-based schemes are projected to expand at a 14.5% CAGR through 2031.
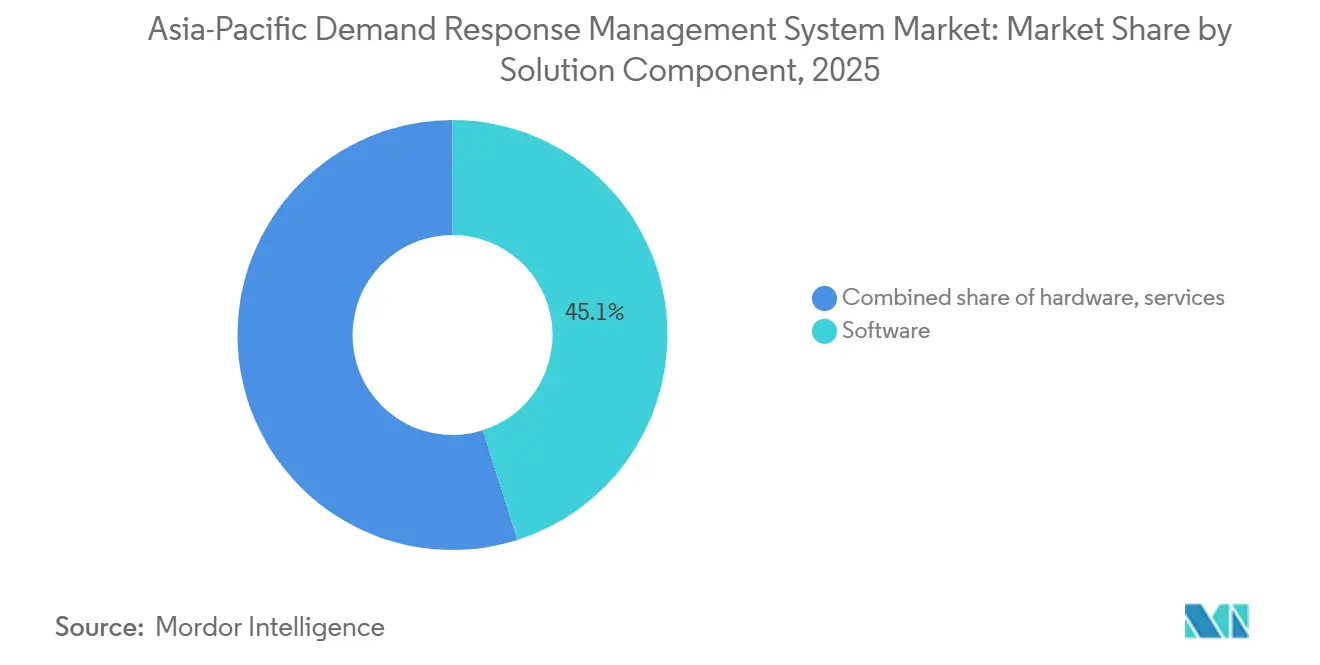
- By solution component, software platforms captured 45.1% share in 2025 and are advancing at 13.6% CAGR to 2031, outpacing hardware spending.
- By deployment mode, cloud-hosted platforms led with 55.3% revenue share in 2025 and are set to rise at a 13.4% CAGR over the forecast window.
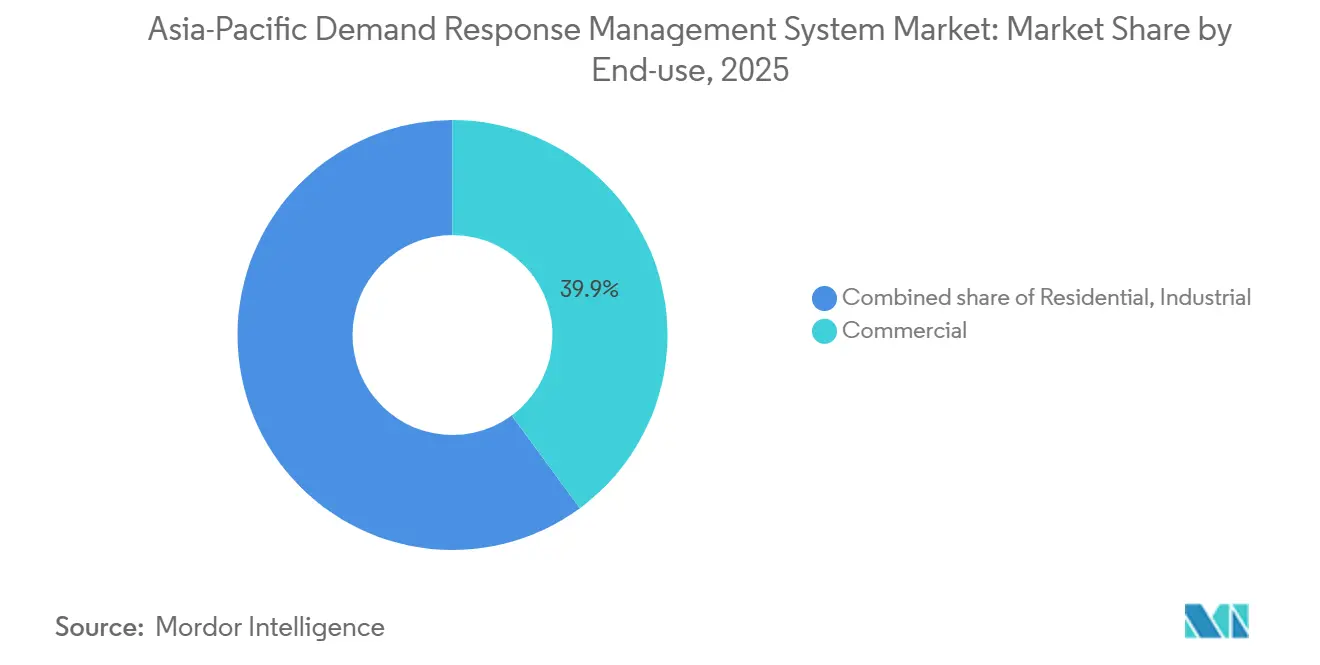
- By end-use, commercial facilities controlled 39.9% of 2025 demand, while industrial customers are forecast to post the highest growth at 14.3% CAGR to 2031.
- By geography, China held 35.7% revenue share in 2025; India is the fastest-growing market, expected to expand at 15.1% CAGR through 2031.
Note: Market size and forecast figures in this report are generated using Mordor Intelligence’s proprietary estimation framework, updated with the latest available data and insights as of January 2026.
Asia-Pacific Demand Response Management System Market Trends and Insights
Drivers Impact Analysis*
| Driver | % Impact on CAGR Forecast | Geographic Relevance | Impact Timeline |
|---|---|---|---|
| Rapid roll-out of region-wide capacity markets | + 3.20% | Australia, Japan, South Korea, pilots in India & Philippines | Medium term (2-4 years) |
| Surge in flexible, behind-the-meter PV-plus-storage | + 2.80% | Japan, Australia, China, accelerating in India & ASEAN | Short term (≤ 2 years) |
| Smart-meter mandate completions | + 2.10% | Japan, India, South Korea, Australia | Short term (≤ 2 years) |
| Green data-center procurement of DR capacity | + 1.60% | Singapore, India, Australia, emerging in Malaysia & Indonesia | Medium term (2-4 years) |
| Electrification of industrial boilers | + 1.40% | China and South Korea | Long term (≥ 4 years) |
| Source: Mordor Intelligence | |||
Rapid Roll-Out of Region-Wide Capacity Markets
Japan activated its capacity market in 2024 and cleared roughly 1 GW of demand-response contracts in the first auction cycle, with 19 dispatch events during the 2024 summer peak Enel X. Australia’s Wholesale Demand Response mechanism scaled from 69 MW in 2023 to 92 MW by June 2025, delivering net system benefits of AUD 5.32 million against costs below AUD 0.5 million.[1]Australian Energy Market Operator, “Wholesale Demand Response Mechanism Review 2025,” aemo.com.au South Korea adopted semi-centralized dispatch rules in spring 2026, allowing VPP aggregators to pool sub-20 MW assets and targeting 16.3 GW of peak reduction by 2038.[2]Ministry of Trade, Industry and Energy, “11th Basic Plan for Electricity Supply and Demand 2025,” motie.go.kr These frameworks convert flexible load into a bankable revenue stream, enabling aggregators to finance telemetry infrastructure and machine-learning analytics that sharpen baseline accuracy.
Surge in Flexible, Behind-the-Meter PV-Plus-Storage
Asia-Pacific absorbed 58% of the 14.8 GWh of new residential batteries installed worldwide in 2025, a 42% jump from 2024.[3]International Energy Agency, “Renewable Energy Market Update – June 2025,” iea.org Japan added 180,000 vehicle-to-home chargers by year-end 2025, empowering electric-vehicle owners to arbitrage peak and off-peak tariffs. Australia surpassed 500,000 cumulative home-battery installations, while China’s household storage segment expanded 87% in 2025 on the back of provincial self-consumption subsidies NDRC.[4]Ministry of Economy, Trade and Industry, “Smart Meter Deployment Progress Report 2025,” meti.go.jp Each incremental battery lowers the marginal cost of VPP dispatch, shortening vendor payback periods and expanding the residential addressable base of the demand response management system market.
Smart-Meter Mandate Completions
India installed 47.6 million smart meters by November 2025 under the Revamped Distribution Sector Scheme and targets 250 million by 2027. Japan achieved nationwide coverage in 2025, providing 30-minute interval data for dynamic tariffs and real-time load forecasting. South Korea and Australia both exceed 90% coverage in urban zones, laying the data foundation that allows aggregators to verify curtailment performance within seconds and settle capacity contracts accurately.
Green Data-Center Procurement of DR Capacity
Singapore’s Data Centre-Call for Application 2 allocates 200 MW of new capacity only to operators sourcing at least 50% green energy and participating in VPP dispatch. DayOne’s 500 MW hyperscale complex in Malaysia embeds a 21-year renewable-plus-flexibility contract with Tenaga Nasional Berhad, granting the utility rights to shave non-critical computing loads during grid stress. India’s planned USD 25 billion green artificial-intelligence campus in Uttar Pradesh will deliver ancillary services to the northern grid, embedding flexible capacity in long-term power-purchase agreements.
Restraints Impact Analysis*
| Restraint | % Impact on CAGR Forecast | Geographic Relevance | Impact Timeline |
|---|---|---|---|
| Disparate tariff structures across regulators | -1.80% | Thailand, Vietnam, Indonesia, Malaysia, Philippines | Medium term (2-4 years) |
| Low residential participation due to caps | -1.30% | India, China, South Korea | Short term (≤ 2 years) |
| Cyber-security spending lag at utilities | -0.90% | India, ASEAN; mitigation progressing in Japan & Australia | Long term (≥ 4 years) |
| Source: Mordor Intelligence | |||
Disparate Tariff Structures Across National Regulators
ASEAN members operate divergent time-of-use windows, critical-peak triggers, and capacity-payment formulas that complicate cross-border VPP aggregation. India’s state-level tariff patchwork forces aggregators to juggle conflicting peak definitions, reducing scale efficiencies. China’s provincial capacity markets impose localized dispatch priorities, creating higher customer-acquisition costs and longer payback periods for software vendors.
Low Residential Participation Due to Aggregator Caps
South Korea requires at least 1 MW of aggregated load to qualify for capacity payments, effectively excluding most household batteries. Several Indian states and Chinese provinces set similar licensing floors, limiting prosumer enrollment and slowing residential growth in the demand response management system market. Tight baseline-accuracy requirements in Japan’s negawatt trading system present an additional barrier despite otherwise favorable rules.
*Our forecasts treat driver/restraint impacts as directional, not additive. The impact forecasts reflect baseline growth, mix effects, and variable interactions.
Segment Analysis
By Type: Automation Drives Curtailment Precision
Automated platforms owned 63.8% of 2025 revenue in the demand response management system market and are forecast to expand at 14.8% CAGR through 2031. Their dominance is anchored in sub-second response times that enable ancillary-services participation. South Korea’s real-time market expansion in 2025 allows 5-minute bidding, a cadence impossible for conventional manual schemes. Japan’s summer 2024 dispatch logged 7 GWh from automated portfolios, confirming reliability at utility scale. As battery penetration rises, machine-learning-driven orchestration that cycles storage multiple times per day will widen the performance gap over conventional systems, solidifying automation’s leadership position in the demand response management system market size discussions.
Conventional programs still manage legacy industrial contracts that do not require rapid telemetry, yet their share declines annually as utilities embed hard telemetry and cloud APIs into new tenders. The incremental cost of adding automated logic is falling because most new smart-meter rollouts now include advanced communications modules. Consequently, even smaller commercial facilities find it cost-effective to migrate from opt-in phone notifications to fully automated curtailment.


By Program Type: Incentive Models Gain Traction
Price-based tariffs still generated 59.5% of 2025 revenue; however, incentive schemes are projected to grow at 14.5% CAGR to 2031. Capacity auctions in Japan and South Korea, reserve markets in the Philippines, and emergency curtailment contracts in Australia stack capacity, energy, and ancillary revenues, improving aggregator economics. Industrial customers favor guaranteed fees over volatile bill savings, shifting procurement toward incentive models and expanding the demand response management system market share of availability payments.
Residential segments remain anchored to time-of-use tariffs because utilities can implement them with billing upgrades alone. Yet behavioral fatigue erodes response over time, prompting regulators to pilot blended models that add small capacity bonuses to retain engagement. Growing deployment of home batteries and vehicle-to-home chargers will accelerate the pivot toward automated incentive programs in the back half of the forecast period.
By Solution Component: Software Orchestrates Value
Software platforms accounted for 45.1% of 2025 revenue and are advancing at 13.6% CAGR, outstripping hardware investments. Cloud-hosted systems such as AutoGrid Flex and Schneider Electric EcoStruxure Grid reduce on-premise spending and shorten aggregator deployment cycles. Siemens EnergyIP now supports simultaneous bidding across energy, capacity, and frequency-regulation products, raising asset utilization and enlarging the demand response management system market size for service-based revenue. Hardware, primarily meters and load-control gateways, is commoditizing, and services are increasingly bundled into software subscriptions that automate measurement and verification.
By Deployment Mode: Cloud Adoption Accelerates
Cloud-hosted deployments led with 55.3% share in 2025 and are forecast to grow at 13.4% CAGR to 2031. Singaporean rules now permit cloud VPPs if data residency remains within ASEAN, and regional data-center expansions by global cloud providers remove latency barriers. On-premise architectures persist in China owing to data-sovereignty rules and in utilities favoring air-gapped control rooms for cyber-security, yet even these markets are moving to hybrid models where local edge devices optimize equipment while the cloud manages portfolio-level analytics.
By End-Use: Industrial Loads Offer Depth
Commercial buildings generated 39.9% of 2025 revenue, yet industrial customers will post the fastest 14.3% CAGR through 2031. Steel mills, cement kilns, and large process industries are electrifying heaters and furnaces, creating loads above 5 MW that can be curtailed for several hours without jeopardizing product quality. Industrial participation broadens the demand response management system market share across peak-shaving, spinning-reserve, and voltage-support services. Residential enrollment remains policy-constrained but will accelerate once aggregator licensing caps fall below the 1 MW threshold and once widespread vehicle-to-home chargers unlock mobile storage fleets.
Geography Analysis
China controlled 35.7% of 2025 regional revenue thanks to provincial VPP pilots that aggregate rooftop solar, behind-the-meter storage, and industrial loads to mitigate renewable curtailment. Household storage grew 87% during 2025, providing a rapidly scalable asset base for aggregators. Fragmented provincial tariff rules extend vendor sales cycles, yet ongoing capacity-market harmonization is expected to streamline participation by 2028.
India is the fastest mover, projected to expand at 15.1% CAGR through 2031. The Revamped Distribution Sector Scheme will deploy 250 million smart meters by 2027, furnishing interval data essential for dynamic tariffs and real-time settlement. State regulators are mandating that distribution companies procure a share of peak reduction from demand response, and hyperscale data-center investments with embedded ancillary-service obligations are set to add significant flexible capacity.
Japan, South Korea, and Australia have reached advanced stages of market design. Japan’s capacity auctions cleared 1 GW of flexible load by late 2025, backed by a national smart-meter backbone and 1.2 million residential battery units. South Korea’s semi-centralized dispatch model is expanding VPP enrollments beyond 400 participants, and its 11th Basic Plan envisions 16.3 GW of peak reduction by 2038. Australia’s Wholesale Demand Response program has proven cost-effective and leverages more than 500,000 home batteries for sub-minute dispatch.
ASEAN nations present mixed maturity. The Philippines launched a reserve market in 2024, allowing flexible loads to bid for frequency regulation. Vietnam and Thailand still grapple with tariff heterogeneity, but Malaysia’s 21-year data-center flexibility contract signals new private-sector momentum. Regional power-trading frameworks under the ASEAN Centre for Energy are poised to unlock cross-border aggregation once tariff rules converge.
Competitive Landscape
The demand response management system market is moderately fragmented. Global grid-automation majors - Schneider Electric, Siemens, ABB, Hitachi Energy - pair deep utility relationships with end-to-end product suites. Schneider’s EcoStruxure Grid fuses VPP dispatch with distribution-management systems, while Siemens’ EnergyIP enables simultaneous participation across multiple wholesale products. Pure-play software vendors such as AutoGrid specialize in cloud-native machine-learning algorithms that forecast baselines and minimize rebound peaks, making them attractive partners for utilities seeking quick deployments. Enel X leverages its EnerNOC heritage to manage 7.5 GW of flexible capacity worldwide, including significant portfolios in Japan and Australia.
White-space opportunities cluster around residential aggregation where minimum-capacity caps currently exclude small loads, and around cross-border VPP orchestration within ASEAN where renewable curtailment is acute yet tariff harmonization is incomplete. Vehicle-to-grid innovators, including Nuvve, are positioning electric-vehicle fleets as mobile storage that can provide both peak shaving and spinning reserves. Standards-body convergence on IEC 62351 is lowering integration barriers, but cyber-security compliance still acts as a differentiator, favoring vendors with embedded encryption and multi-factor authentication.
Asia-Pacific Demand Response Management System Industry Leaders
Schneider Electric SE
Siemens AG
Hitachi Energy Ltd
Mitsubishi Electric Corp.
Enel X (Enel SpA)
- *Disclaimer: Major Players sorted in no particular order

Recent Industry Developments
- December 2025: Tokyo Electric Power Company signed a 20-year virtual power-purchase agreement in Singapore that embeds demand-response dispatch rights for 10 MW of rooftop solar.
- December 2025: India surpassed 47.6 million smart-meter installations under the Revamped Distribution Sector Scheme, cementing data infrastructure for large-scale DR programs.
- October 2025: Hitachi Energy deployed a virtual power plant settlement platform for Zhejiang Energy Group, orchestrating more than 200 distributed resources, one of China’s largest VPP projects to date.
- June 2024: Australia’s Wholesale Demand Response mechanism reached 92 MW of registered capacity, delivering AUD 5.32 million in net benefits over a 20-month period.


Asia-Pacific Demand Response Management System Market Report Scope
The Demand Response Management System (DRMS) market comprises software platforms, hardware, and services designed to help utilities manage customer electricity consumption in real-time. These systems facilitate the automation of energy reduction or shifting during peak periods, improving grid stability, managing variable renewable energy, and reducing the need for costly infrastructure upgrades.
The Asia-Pacific Demand Response Management System Market is segmented into type, program type, solution component, deployment mode, end-use, and geography. By type, the market is segmented into conventional and automated/advanced systems. By program type, the market is segmented into price-based and incentive-based programs. By solution component, the market is segmented into hardware, software, and services. By deployment mode, the market is segmented into cloud-hosted and on-premise/edge deployments. By end-use, the market is segmented into residential, commercial, and industrial sectors. The report also covers the market size and forecasts for the demand response management system market across key countries and regions in Asia-Pacific, including Australia and New Zealand, China, India, Japan, South Korea, ASEAN Countries, and the Rest of Asia-Pacific. For each segment, the market sizing and forecasts have been done on the basis of value (USD).
| Conventional Demand Response |
| Automated/Advanced Demand Response |
| Price-based (TOU, CPP, RTP) |
| Incentive-based (CBP, DLC, Emergency DR, Ancillary) |
| Hardware (AMI, Load-control switches, Gateways) |
| Software (DRMS, VPP platforms) |
| Services (Aggregation, Curtailment, Enrolment) |
| Cloud-hosted |
| On-premise/Edge |
| Residential |
| Commercial |
| Industrial |
| Australia |
| China |
| India |
| Japan |
| South Korea |
| ASEAN Countries |
| Australia and New Zealand |
| Rest of Asia-Pacific |
| By Type | Conventional Demand Response |
| Automated/Advanced Demand Response | |
| By Program Type | Price-based (TOU, CPP, RTP) |
| Incentive-based (CBP, DLC, Emergency DR, Ancillary) | |
| By Solution Component | Hardware (AMI, Load-control switches, Gateways) |
| Software (DRMS, VPP platforms) | |
| Services (Aggregation, Curtailment, Enrolment) | |
| By Deployment Mode | Cloud-hosted |
| On-premise/Edge | |
| By End-use | Residential |
| Commercial | |
| Industrial | |
| By Geography | Australia |
| China | |
| India | |
| Japan | |
| South Korea | |
| ASEAN Countries | |
| Australia and New Zealand | |
| Rest of Asia-Pacific |


Key Questions Answered in the Report
What is the projected value of the demand response management system market by 2031?
The market is forecast to reach USD 7.30 billion by 2031, growing at a 13.12% CAGR from 2026.
Which program type is expanding fastest across Asia-Pacific?
Incentive-based schemes, which combine capacity fees with emergency and ancillary-service revenues, are advancing at 14.5% CAGR through 2031.
Why are automated platforms overtaking conventional demand response?
Automated architectures deliver sub-second response, enabling participation in ancillary-services markets and achieving a 14.8% annual growth rate.
Which country offers the highest near-term growth potential?
India, propelled by large-scale smart-meter rollouts and new regulatory mandates, is expected to grow at a 15.1% CAGR to 2031.
How are data centers influencing demand response adoption?
New hyperscale campuses must integrate renewable energy and flexible load commitments, turning non-critical computing tasks into grid resources and broadening revenue streams for aggregators.
What limits residential participation today?
Minimum-capacity thresholds of about 1 MW in markets such as South Korea and several Indian states exclude most households, although policy reforms are under discussion.
Page last updated on:


