Next-generation Sequencing (NGS) Market Size and Share
Market Overview
| Study Period | 2019 - 2030 |
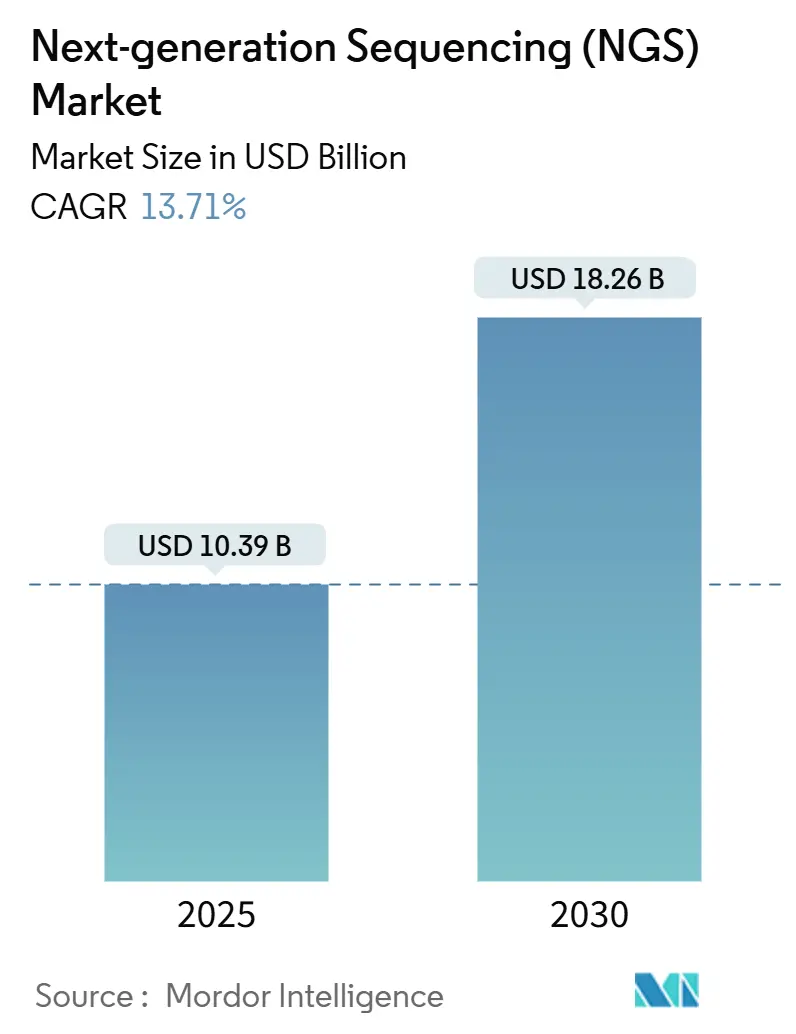
| Market Size (2025) | USD 10.39 Billion |
| Market Size (2030) | USD 18.26 Billion |
| Growth Rate (2025 - 2030) | 13.71% CAGR |
| Fastest Growing Market | Asia-Pacific |
| Largest Market | North America |
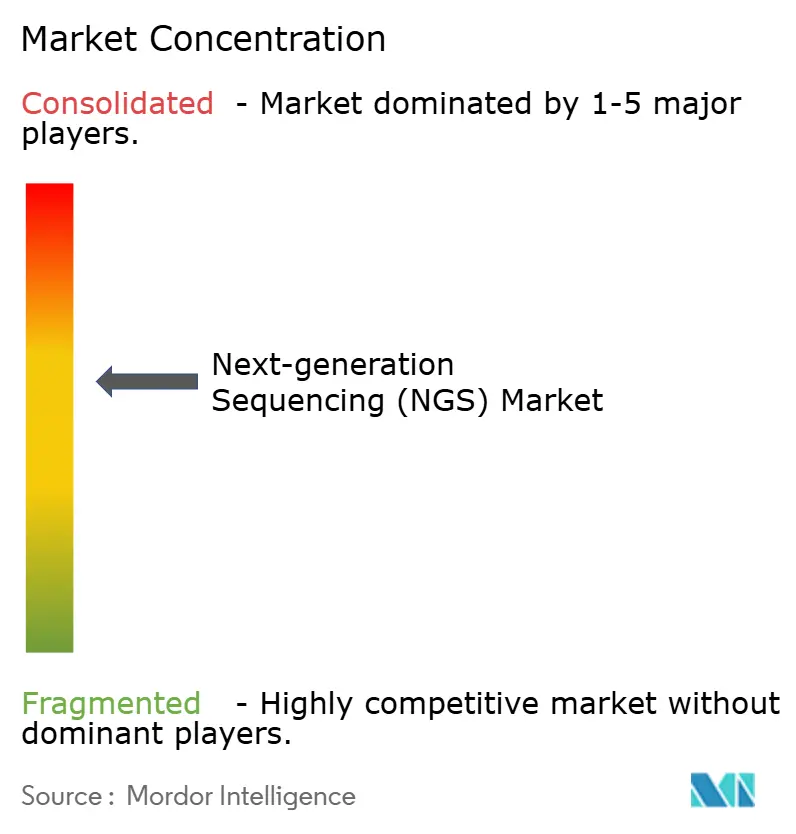
| Market Concentration | Medium |
Major Players*Disclaimer: Major Players sorted in no particular order Image © Mordor Intelligence. Reuse requires attribution under CC BY 4.0. |
|

Next-generation Sequencing (NGS) Market Analysis by Mordor Intelligence
The Next Generation Sequencing market generated around USD 10.39 billion in 2025 and is forecast to reach nearly USD 18.26 billion by 2030, reflecting a compound annual growth rate (CAGR) of 13.7% during 2025-2030. This expansion signals the shift from a technology-centric phase to wide clinical deployment as sequencing costs approach USD 100 per genome, lowering the affordability barrier for health-system adoption. Reagents and consumables remain the main revenue engine, while the entrance of Element Biosciences, Ultima Genomics and other challengers is expanding platform choice and encouraging price competition. Oncology retains priority, but population-scale genomics, pharmacogenomics and rare-disease diagnostics are broadening demand. Imminent FDA rules on Laboratory Developed Tests (LDTs) promise clearer quality standards, yet they also increase compliance workloads that smaller laboratories must manage[1]U.S. Food and Drug Administration, “FDA Takes Action Aimed at Helping to Ensure the Safety and Effectiveness of Laboratory Developed Tests,” fda.gov.
Key Report Takeaways
- By product type, reagents and consumables captured 69.9% of the next generation sequencing market share in 2024, while instruments record the fastest 14.4% CAGR to 2030.
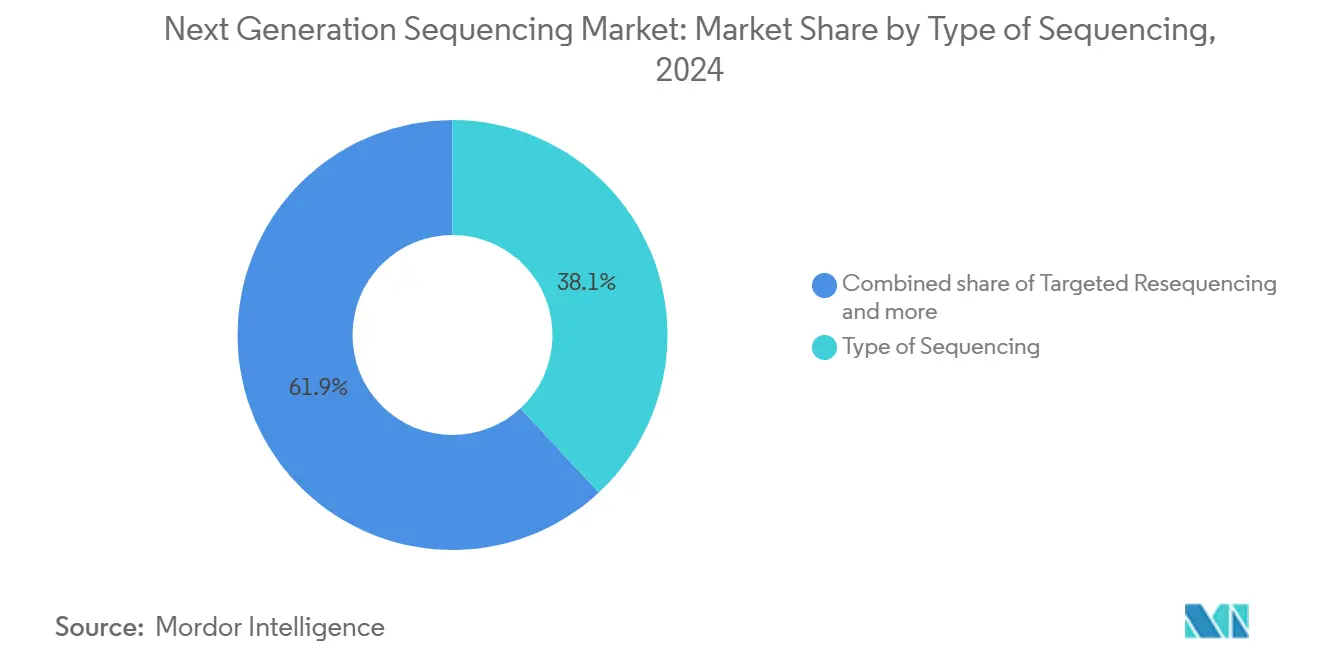
- By sequencing method, targeted resequencing led with 38.1% revenue share in 2024; whole exome sequencing is advancing at a 14.2% CAGR through 2030.
- By application, drug discovery and personalized medicine commanded 35.2% of the next generation sequencing market size in 2024, whereas genetic screening is poised for a 14.3% CAGR to 2030.
- By end user, academic institutions held 48.4% of the next generation sequencing market share in 2024, yet hospitals and health systems are expanding at 14.0% CAGR through 2030.
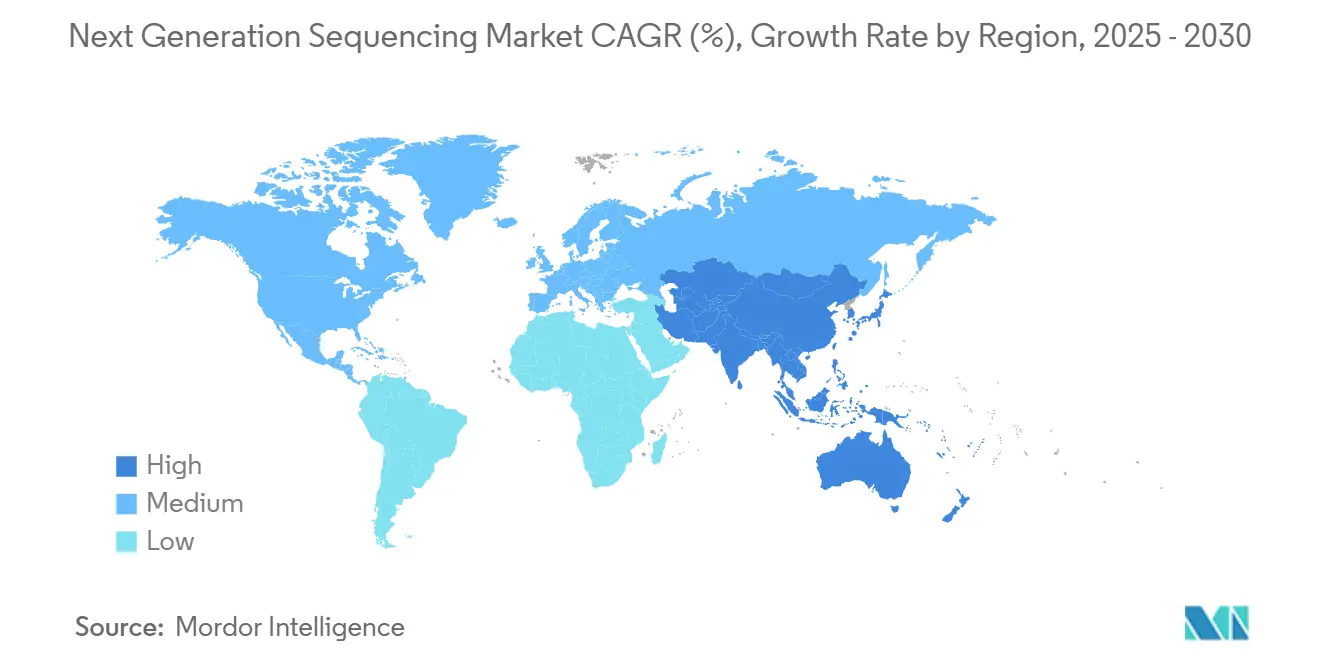
- By region, North America accounted for 41.9% revenue in 2024; Asia-Pacific registers the quickest 14.2% CAGR to 2030.
Global Next-generation Sequencing (NGS) Market Trends and Insights
Drivers Impact Analysis
| Driver | (~) % Impact on CAGR Forecast | Geographic Relevance | Impact Timeline |
|---|---|---|---|
| Precision medicine adoption | +3.2% | Global, with early uptake in North America and Europe | Medium term (2-4 years) |
| Genome cost decline | +2.8% | Global | Short term (≤2 years) |
| Clinical-practice guideline endorsements (NCCN, ACMG) | +2.0% | Global, strongest payer influence in the United States and Western Europe | Short term (≤2 years) |
| Population genomics programs | +1.5% | North America, Europe, expanding to Asia-Pacific | Medium term (2-4 years) |
| AI-enabled bioinformatics pipelines | +1.7% | Global, concentrated in high-throughput academic and clinical sequencing centers | Short term (≤2 years) |
| Pharmaceutical R&D integration | +1.2% | Global, focused in regions with large biopharma clusters | Medium term (2-4 years) |
Source: Mordor Intelligence
Accelerating Adoption of Precision Medicine and Companion Diagnostics Across Oncology and Rare Disease Care Pathways
Oncology crossed a milestone in 2023 when clinical sequencing volumes surpassed research use, confirming hospital confidence that genomic data can guide drug selection and reduce avoidable treatments. The United States NGS oncology segment alone touched USD 3 billion in 2023 and is tracking toward USD 4 billion by 2025, illustrating health-system appetite for broader panel tests. FDA approval of comprehensive assays such as TruSight Oncology Comprehensive widens payer acceptance and accelerates lab conversion from single-gene to multi-gene panels. Combined with EHR integration pilots that deliver pharmacogenomic alerts at the point of care, clinicians now view sequencing as a routine rather than rare test. The next generation sequencing market consequently gains recurring throughput as treatment guidelines reference genomic signatures.
Continuous Decline in Cost Per Genome Driven by Higher-Throughput Chemistries and Innovative Instrument Technologies
Chemistry miniaturization, optics upgrades and base-calling algorithms have pushed the cost per human genome below USD 200 on Illumina’s NovaSeq X system and toward USD 100 on emerging competitors. Providers in oncology and neonatology can now justify sequencing over multi-step legacy assays because price no longer overwhelms diagnostic savings. Falling consumable costs also encourage academic core facilities to expand instrument fleets, driving additional reagent demand that sustains the next generation sequencing market. Continued advancements in flow-cell reusability and kit multiplexing are expected to shave another 20%-30% from per-sample expense within two years, compressing payback periods for capital equipment.
Expansion Of Population-Scale Genomics Programs Supported by Governments and Private Consortia Worldwide
Government-sponsored biobanks such as the Alliance for Genomic Discovery commit to sequence 250,000 genomes to accelerate drug discovery. Australia’s Medical Research Future Fund is channeling USD 500 million over ten years into genomic infrastructure. These projects not only consume large reagent volumes but also create reference databases that improve rare-variant interpretation in under-represented populations. As Asian and Middle Eastern countries launch parallel initiatives, instrument vendors gain access to fresh capital budgets and longer-term consumable contracts, reinforcing multi-year visibility for the next generation sequencing market.
Increasing Utilization of NGS In Pharmaceutical Drug Discovery and Biomarker Identification Workflows
Bristol Myers Squibb, GSK and Novo Nordisk joined the Alliance for Genomic Discovery in 2024, signaling industry-wide reliance on NGS data to stratify trial populations and monitor minimal residual disease. FDA guidance endorsing circulating tumor DNA as a surrogate endpoint lets sponsors use NGS to accelerate oncology approvals, shortening development cycles. Contract research organizations consequently expand sequencing capacity, while kit makers tailor RUO panels for early-phase discovery. Growing volumes of companion-diagnostic studies ensure sustained reagent consumption beyond the traditional research customer base.
Restraints Impact Analysis
| Restraint | (~) % Impact on CAGR Forecast | Geographic Relevance | Impact Timeline |
|---|---|---|---|
| Regulatory fragmentation | -2.1% | Global, highest impact in North America | Short term (≤2 years) |
| Data privacy restrictions | -1.4% | Most severe in the European Union | Medium term (2-4 years) |
| High capital outlay for long-read & spatial sequencing platforms | -1.2% | Emerging markets and smaller institutions globally | Short term (≤2 years) |
| Shortage of bioinformatics talent for clinical-grade interpretation | -1.0% | Global, most acute in rapidly growing markets | Long term (≥4 years) |
Source: Mordor Intelligence
Fragmented Global Regulatory Landscape for Clinical NGS Validation
The FDA final rule classifying most LDTs as medical devices introduces phased compliance through 2028 and compels clinical labs to submit premarket reviews or pivot to FDA-cleared kits. While the policy aims to harmonize quality, legal challenges from laboratory associations create uncertainty over timelines. Laboratories must budget for validation studies and potential system upgrades, temporarily slowing capital orders. Outside the United States, divergent requirements among China’s NMPA, the EU’s IVDR and Japan’s PMDA force vendors to localize documentation, adding expense and lengthening product launches in the next generation sequencing market.
Data-Privacy-Driven Restrictions on Cross-Border Genomic Data Transfer
Restrictions on cross-border genomic data transfer under the EU’s General Data Protection Regulation complicate multinational rare-disease and oncology studies, which depend on aggregated variant datasets[2]Nature Portfolio, “EU-US Data Transfers: An Enduring Challenge for Health Research Collaborations,” nature.com. The upcoming European Health Data Space seeks to provide controlled researcher access but implementation details remain under debate. Sponsors and academic consortia therefore invest in decentralized analysis and federated learning to avoid raw-data movement, incurring additional bioinformatics overhead. For vendors, regionalized databases lessen economies of scale and delay the harmonization of clinical-grade variant interpretation pipelines, muting near-term adoption in Europe within the next generation sequencing market.
Segment Analysis
By Type of Sequencing: Clinical Utility Drives Segment Growth
Targeted resequencing held 38.1% revenue in 2024, reinforcing its role as the workhorse for actionable cancer and germline panels that can be completed within forty-eight hours. Its focused scope reduces data-analysis burden and aligns with reimbursement codes, making it the entry point for most hospital labs in the next generation sequencing market. Whole exome sequencing is gaining as costs fall, recording a 14.2% CAGR to 2030 and serving as the first-line test with 45% diagnostic yield for rare diseases. RNA sequencing continues to proliferate in hematologic malignancies where fusion detection guides targeted therapy. Meanwhile, whole genome sequencing adoption remains modest yet rising because population projects increasingly demand full-coverage data. As AI-driven annotation accelerates, the next generation sequencing market size for WGS is forecast to outpace the overall market after 2028.
Instruments optimized for exome or genome throughput now integrate on-box secondary analysis, reducing the need for separate servers and making end-to-end turnaround more predictable. Laboratories switching from exome to genome workflows often retain existing extraction and library kits, cushioning transition costs. Vendors counterbalance cannibalization risk by offering upgrade paths that re-use flow-cell cartridges across multiple run modes. Consequently, the next generation sequencing market benefits from stickier consumable demand even as run formats diversify.
Note: Segment shares of all individual segments available upon report purchase
By Product Type: Consumables Drive Recurring Revenue
Reagents and consumables captured 69.9% of the next generation sequencing market share in 2024, underscoring the razor-and-blade model that underpins vendor profitability. Their dominant position reflects the monthly restocking cycle of flow cells, enzymes and capture probes in clinical labs that push 90% run capacity utilization. Although instruments represent a smaller base, innovations like Illumina’s single-flow-cell NovaSeq X upgrade are expanding throughput while shrinking floor space. Instrument revenue thus posts a 14.4% CAGR to 2030, reinforced by leasing models that bundle reagents into multi-year contracts and cushion capital budgets.
Service providers—ranging from academic core facilities to commercial reference labs—continue to absorb complex bioinformatics workloads. Demand for data interpretation, particularly around mosaic variants and structural rearrangements, is driving a double-digit expansion in outsourced analysis. As artificial intelligence automates primary base-calling, vendors increasingly differentiate services through tertiary analytics and clinical reporting. That development anchors additional layers of recurring revenue and helps defend margins as reagent prices fall across the next generation sequencing market.
By Application: Precision Medicine Leads Market Utilization
Drug discovery and personalized medicine delivered 35.2% of 2024 revenue, supported by pharmaceutical alliances that integrate genomic stratification from preclinical stages to phase III trials[3]llumina Inc., “The Alliance for Genomic Discovery Welcomes Bristol Myers Squibb, GSK, and Novo Nordisk,” illumina.com. Expanded use of circulating-tumor-DNA assays in neo-adjuvant trial arms increases repeat testing per patient, lifting consumable volumes in the next generation sequencing market. Genetic screening, including carrier and non-invasive prenatal testing, is projected to expand at a 14.3% CAGR, propelled by payer coverage of expanded gene panels. Wider availability of low-coverage whole-genome protocols promises higher detection rates for copy-number variants compared with microarrays, driving clinical adoption.
Diagnostics applications keep widening beyond oncology into cardiovascular disease and immunology. Early sepsis-detection panels that sequence cell-free DNA show promise to direct antibiotic therapy within hours, illustrating how genomic workflows can penetrate acute-care settings. Agricultural genomics, though still niche, benefits from partnerships such as Illumina and LGC Biosearch’s agricultural breeding collaboration. These developments, while incremental, diversify market risk and contribute to sustained revenue momentum in the next generation sequencing industry.

Note: Segment shares of all individual segments available upon report purchase
By End User: Academic Leadership with Clinical Growth
Academic institutions retained 48.4% revenue in 2024 and are forecast to grow nearly in line with the overall next generation sequencing market at 14.0% CAGR. Their strength springs from grant-funded exploratory projects and from leadership of national genome initiatives that demand high throughput. Hospitals and integrated delivery networks, however, represent the fastest-growing customer group as rapid whole-genome sequencing demonstrates clinical utility in neonatal intensive care[4]GeneDx, “Collaboration With Epic to Expand Rapid Whole Genome Sequencing,” genedx.com. Point-of-care workflows that collapse sample-to-report cycles to under forty-eight hours increase diagnostic yield and shorten patient stays, persuading administrators to commit capital budgets.
Pharmaceutical and biotechnology firms deepen sequencing investments to inform target validation, toxicogenomics and companion-diagnostic co-development. As these firms frequently outsource wet-lab sequencing, contract research organizations scale platform fleets to meet Good Clinical Practice requirements. This dynamic bolsters reagent pull-through and sustains premium-service pricing across the next generation sequencing market size.
Geography Analysis
North America contributed 41.9% revenue in 2024 on the back of advanced clinical reimbursement and venture funding for sequencing start-ups. The United States market expansion is reinforced by CMS coverage decisions that reimburse large somatic panels, while the phased LDT rule is expected to standardize quality and gradually accelerate payer confidence. Major academic medical centers leverage NIH grants for population-health genomics, ensuring a steady flow of instrument upgrades and consumables within the next generation sequencing market.
Asia-Pacific registers the fastest 14.2% CAGR through 2030, led by China’s National Genomics Data Center and domestic innovators such as BGI. Local manufacturing incentives and large oncology incidence create favorable economics for home-grown sequencers that often undercut import prices. Japan and South Korea integrate sequencing into national cancer screening programs, while India scales pilot newborn-screening projects, widening reagent consumption. Regional regulatory reforms that streamline import licensing further accelerate technology transfer and platform penetration.
Europe maintains a significant share, supported by Horizon Europe funding and coordinated rare-disease networks. Nevertheless, GDPR data-localization constraints inflate operating costs; laboratories invest in federated analytics that comply with cross-border rules. The Middle East and Africa, though smaller, observe double-digit growth paced by precision-medicine hubs in the Gulf Cooperation Council and by Africa-based pathogen-genomics surveillance consortia that acquired fleet sequencers during the COVID-19 response. Overall, geographic diversification cushions currency risk and underpins long-term resilience of the next generation sequencing market.
Competitive Landscape
The next generation sequencing industry remains oligopolistic but is edging toward broader rivalry. Illumina led 2024 revenue at roughly USD 4.3 billion, yet margin compression and antitrust scrutiny limit growth. Element Biosciences’ USD 277 million fund-raise accelerated its AVITI24 launch, bringing lower-priced mid-throughput instruments to core labs. Ultima Genomics partners with Labcorp to validate whole-genome oncology tests, signaling that disruptive players can secure marquee clinical customers.
Strategic partnerships shape competition as vendors combine strength in chemistry, informatics and multi-omics. Illumina teams with NVIDIA to integrate GPU-accelerated analysis, shrinking secondary-analysis time from hours to minutes. Roche progresses on an in-house nanopore platform to broaden its clinical diagnostics portfolio. MaxCyte’s acquisition of SeQure Dx extends cell-editing quality controls into sequencing workflows, connecting therapeutic manufacturing with genomic analytics. Collectively these moves diversify technology options and create downward price pressure that benefits buyers in the next generation sequencing market.
Emerging business models include reagent rental agreements, cloud-based pipeline subscriptions and bundled hardware-kit-software leases that turn upfront outlays into operating expenses. Vendors also invest in on-instrument AI to help mid-size labs automate variant classification, a capability historically limited to top research centers. As technology barriers fall, brand differentiation tilts toward service quality, supply-chain reliability and ecosystem interoperability.
Next-generation Sequencing (NGS) Industry Leaders
-
Illumina Inc.
-
Thermo Fisher Scientific Inc.
-
BGI Genomics Co. Ltd.
-
F. Hoffmann-La Roche Ltd.
-
Oxford Nanopore Technologies Plc
- *Disclaimer: Major Players sorted in no particular order
Recent Industry Developments
- January 2025: Illumina unveiled a single-flow-cell version of NovaSeq X alongside software upgrades and multi-omic library kits, enhancing data quality while reducing PhiX dependency. Early customer feedback pointed to immediate adoption for high-throughput oncology assays, suggesting that integrated upgrades can drive consumables pull-through.
- October 2024: MGI and OncoDNA launched a streamlined workflow for comprehensive genomic profiling that pairs sample preparation automation with validated oncology panels. The agreement offers laboratories a faster path to implement complete reporting pipelines, potentially lowering barriers for precision oncology adoption.
- September 2024: Illumina and LGC Biosearch Technologies entered a strategic partnership to advance genomic applications in agriculture, combining Amp-Seq library prep with high-throughput sequencing. The collaboration aims to accelerate crop-breeding timelines, hinting at broader diversification beyond human health markets.
- August 2024: Hitachi High-Tech acquired majority ownership of Nabsys, adding electronic genome-mapping to its life-science portfolio. The acquisition positions Hitachi to deliver structural-variation analysis, an application area that complements short-read sequencing platforms.
- August 2024: Illumina released high-throughput TruSight Oncology 500 and ctDNA v2 assays for NovaSeq X users, expanding menu options for comprehensive genomic profiling. The launch provides existing NovaSeq X customers with incremental revenue opportunities in liquid biopsy.
- July 2024: Labcorp broadened its collaboration with Ultima Genomics to incorporate the UG 100 sequencer into oncology testing workflows. The partnership underscores a growing willingness among major reference labs to diversify their instrument fleet with emerging platforms.
- February 2024: Illumina disclosed fiscal-2023 revenue of USD 4.50 billion and confirmed shipment of 352 NovaSeq X units during the year. The update demonstrated that early demand for the new platform exceeded initial manufacturing forecasts.
- January 2024: The Alliance for Genomic Discovery added Bristol Myers Squibb, GSK, and Novo Nordisk to its membership roster, expanding its capacity to generate multi-omic data sets for drug discovery. The broadened consortium highlights industry belief that shared pre-competitive data accelerates therapeutic development.
Global Next-generation Sequencing (NGS) Market Report Scope
As per the scope of the report, NGS is a technology in which millions of DNA strands can be sequenced through massive parallelization. This technique is also known as high-throughput sequencing. The low cost, high accuracy and speed, and precise results, even from low sample inputs, are the main advantages NGS offers over Sanger's sequencing method. The next-generation sequencing market is segmented by Type of Sequencing (Whole Genome Sequencing, Targeted Resequencing, Whole Exome Sequencing, RNA Sequencing, CHIP Sequencing, De Novo Sequencing, and Methyl Sequencing), Product Type (Instruments, Reagents and Consumables, and Services)East and, End User (Hospitals and Healthcare Institutions, Academics, and Pharmaceutical and Biotechnology Companies), Application (Drug Discovery and Personalized Medicine, Genetic Screening, DiagnAgriculture,iculture and Animal Research, and Other Applications), and Geography (North America, Europe, Asia-Pacific, Middle East and AfriMiddlend South America). The market report also covers the estimated market sizes and trends for 17 different countries across major regions globally. The report offers market size and forecasts in value (in USD million) for all the above-mentioned segments.
| By Type of Sequencing | Whole Genome Sequencing | ||
| Targeted Resequencing | |||
| Whole Exome Sequencing | |||
| RNA Sequencing | |||
| CHIP Sequencing | |||
| De Novo Sequencing | |||
| Methyl Sequencing | |||
| By Product Type | Instruments | ||
| Reagents and Consumables | |||
| Services | |||
| By Application | Drug Discovery and Personalized Medicine | ||
| Genetic Screening | |||
| Diagnostics | |||
| Agriculture and Animal Research | |||
| Other Applications (Epigenomics, Metagenomics, Transcriptomics) | |||
| By End User | Hospitals and Healthcare Institutions | ||
| Academics | |||
| Pharmaceuticals and Biotechnology Companies | |||
| Geography | North America | United States | |
| Canada | |||
| Mexico | |||
| Europe | Germany | ||
| United Kingdom | |||
| France | |||
| Italy | |||
| Spain | |||
| Rest of Europe | |||
| Asia-Pacific | China | ||
| Japan | |||
| India | |||
| South Korea | |||
| Australia | |||
| Rest of Asia-Pacific | |||
| Middle-East and Africa | GCC | ||
| South Africa | |||
| Rest of Middle East and Africa | |||
| South America | Brazil | ||
| Argentina | |||
| Rest of South America | |||
| Whole Genome Sequencing |
| Targeted Resequencing |
| Whole Exome Sequencing |
| RNA Sequencing |
| CHIP Sequencing |
| De Novo Sequencing |
| Methyl Sequencing |
| Instruments |
| Reagents and Consumables |
| Services |
| Drug Discovery and Personalized Medicine |
| Genetic Screening |
| Diagnostics |
| Agriculture and Animal Research |
| Other Applications (Epigenomics, Metagenomics, Transcriptomics) |
| Hospitals and Healthcare Institutions |
| Academics |
| Pharmaceuticals and Biotechnology Companies |
| North America | United States |
| Canada | |
| Mexico | |
| Europe | Germany |
| United Kingdom | |
| France | |
| Italy | |
| Spain | |
| Rest of Europe | |
| Asia-Pacific | China |
| Japan | |
| India | |
| South Korea | |
| Australia | |
| Rest of Asia-Pacific | |
| Middle-East and Africa | GCC |
| South Africa | |
| Rest of Middle East and Africa | |
| South America | Brazil |
| Argentina | |
| Rest of South America |
Key Questions Answered in the Report
What is the current value of the next generation sequencing market?
The market is valued at USD 10.39 billion in 2025 and is forecast to reach USD 18.26 billion by 2030.
Which product category generates the most recurring revenue?
Reagents and consumables command 69.88% of revenue, reflecting the repeat-purchase nature of sequencing chemistry and flow cells.
Why is Asia-Pacific the fastest-growing region?
Rising healthcare investments, oncology burden, and government-funded genome projects lift Asia-Pacific to a 14.21% forecast CAGR.
How does the new U.S. LDT rule affect market participants?
Laboratories must phase in quality-system and validation requirements through 2028, raising compliance costs but standardizing test performance.
Which sequencing type is expanding fastest?
Whole exome sequencing grows at 14.23% CAGR as clinicians adopt it for rare disease diagnostics.
What strategic moves are leading companies making?
Illumina partners with NVIDIA for multiomic analytics, Element Biosciences raises significant funding for low-cost platforms, and Roche advances nanopore technology to diversify clinical offerings.

