Global Municipal Solid Waste Management Market Size and Share
Market Overview
| Study Period | 2020 - 2031 |
|---|---|
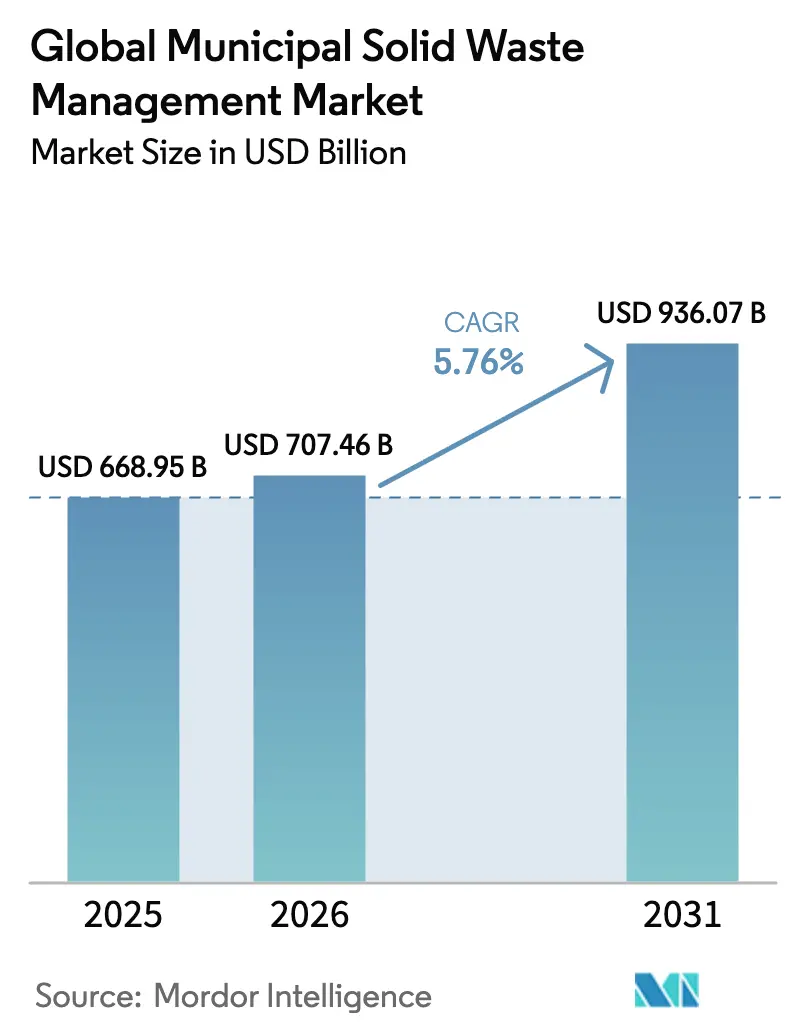
| Market Size (2026) | USD 707.46 Billion |
| Market Size (2031) | USD 936.07 Billion |
| Growth Rate (2026 - 2031) | 5.76% CAGR |
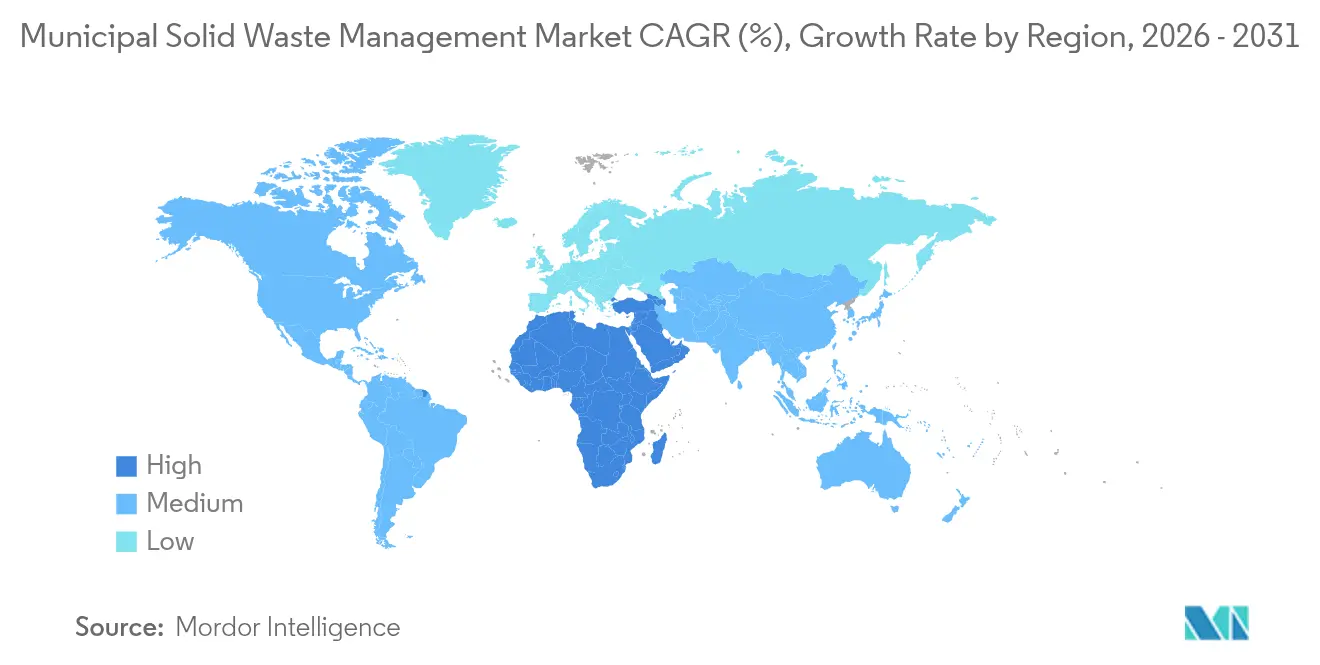
| Fastest Growing Market | Middle East and Africa |
| Largest Market | Asia Pacific |
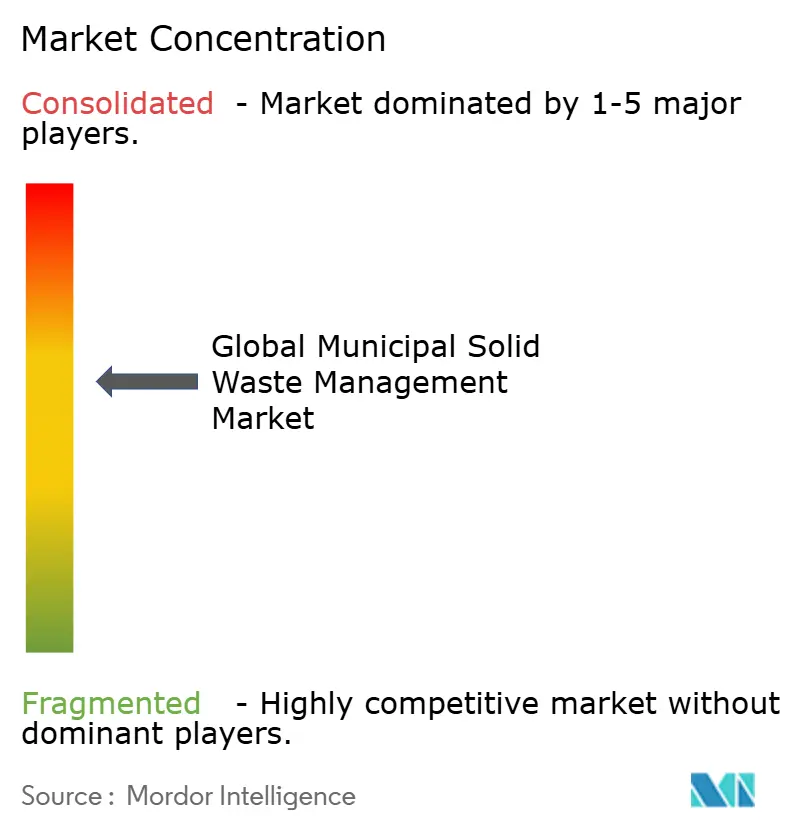
| Market Concentration | Medium |
Major Players *Disclaimer: Major Players sorted in no particular order Image © Mordor Intelligence. Reuse requires attribution under CC BY 4.0. | |
Global Municipal Solid Waste Management Market Analysis by Mordor Intelligence
The Municipal Solid Waste Management Market size was valued at USD 668.95 billion in 2025 and estimated to grow from USD 707.46 billion in 2026 to reach USD 936.07 billion by 2031, at a CAGR of 5.76% during the forecast period (2026-2031). Urban populations continue to climb, and municipal waste volumes are on track to grow 70% by 2050, adding pressure on cities already struggling with outdated disposal models[1]United Nations Environment Programme, “Global Waste Outlook 2024,” United Nations Environment Programme, unep.org. Regulatory mandates banning single-use plastics, green-bond financing for new facilities, and the wider shift to circular-economy strategies are reshaping both capital flows and competitive priorities. Public-sector issuers such as Vadodara and Ottawa have demonstrated that properly structured green bonds can unlock low-cost capital for waste-to-energy and wastewater projects, signalling to private operators that long-term funding is available for technology upgrades. Meanwhile, Asia–Pacific maintains demand leadership, and the Middle East & Africa (MEA) is emerging as the fastest-growing region, propelled by large-scale infrastructure programmes and smart-city roll-outs.
Key Report Takeaways
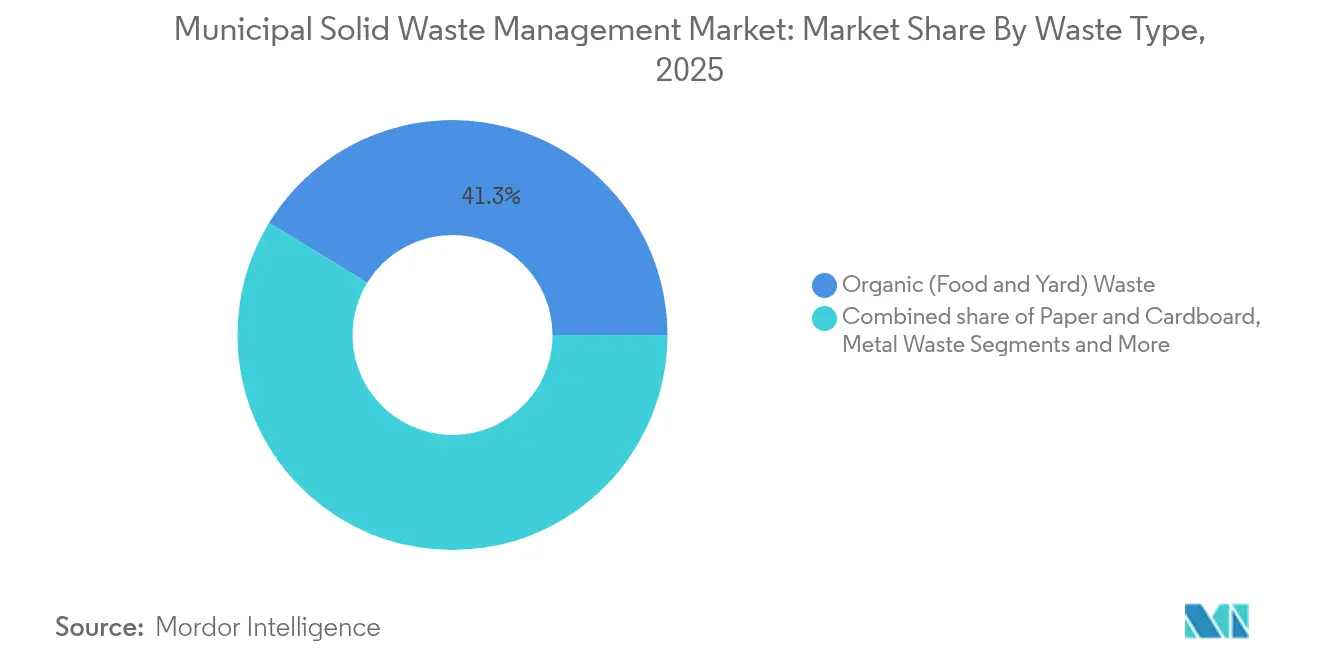
- By waste type, organic waste led with 41.26% of municipal solid waste management market share in 2025; e-waste is forecast to expand at a 7.45% CAGR to 2031.
- By source, residential streams accounted for 54.21% of the municipal solid waste management market size in 2025, while construction & demolition (C&D) waste records the fastest growth at a 5.95% CAGR through 2031.
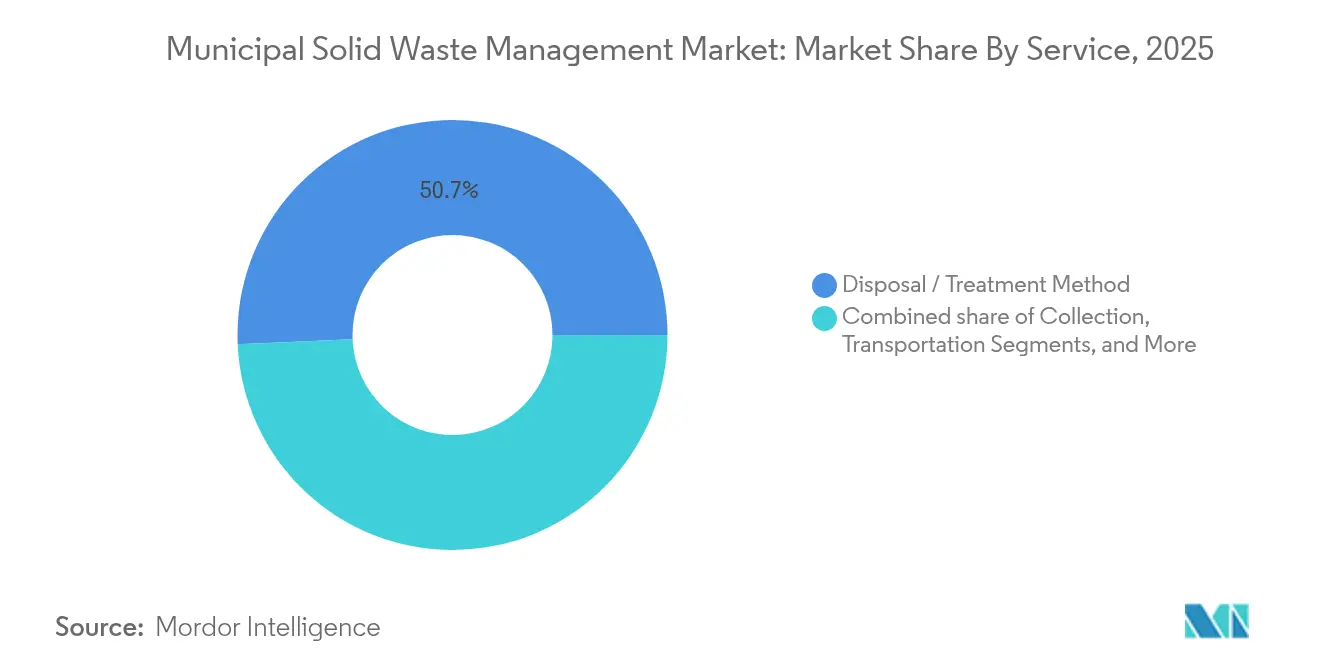
- By service, disposal & treatment held 50.68% revenue share in 2025; recycling and material recovery services are advancing at a 6.98% CAGR across 2026-2031.
- By geography, Asia-Pacific dominated with a 36.42% share of the municipal solid waste management market in 2025; MEA posts the highest regional CAGR at 6.38% to 2031.
Note: Market size and forecast figures in this report are generated using Mordor Intelligence’s proprietary estimation framework, updated with the latest available data and insights as of 2026.
Global Municipal Solid Waste Management Market Trends and Insights
Drivers Impact Analysis*
| Driver | ( ~ ) % Impact on CAGR Forecast | Geographic Relevance | Impact Timeline |
|---|---|---|---|
| Urban bans on single-use plastics | +0.8% | Global, early uptake in Asia–Pacific & Europe | Medium term (2-4 years) |
| Mandated landfill-diversion targets (EU & Australia) | +0.7% | Europe & Australia | Long term (≥ 4 years) |
| Accelerating source-segregated collection (Asia) | +0.6% | Asia–Pacific core; spill-over to MEA | Short term (≤ 2 years) |
| Municipal green-bond funding surge for waste-to-energy (N. America) | +0.5% | North America; expansion to LATAM | Medium term (2-4 years) |
| Rapid smart-city roll-outs fuelling IoT-based collection (GCC, Singapore) | +0.4% | GCC & Singapore | Medium term (2-4 years) |
| Corporate zero-waste certification programmes boosting C&I recycling | +0.3% | Nordics & Japan | Long term (≥ 4 years) |
| Black soldier fly bioconversion of organics | +0.2% | Latin America; pilots in Sub-Saharan Africa | Long term (≥ 4 years) |
| Source: Mordor Intelligence | |||
Urban Bans on Single-Use Plastics
Sweeping restrictions on single-use items are altering waste streams and investment requirements almost overnight. Hong Kong’s 2024 ban covers utensils, straws, and foam containers responsible for 2,369 tons of plastic waste daily, yet only 12.3% is currently recycled, spurring demand for advanced sorting and composting lines. France plans to phase out all single-use plastic packaging by 2040, and California’s SB 54 sets a 2032 deadline for fully recyclable or compostable packaging, each forcing operators to retrofit fleets and build organics facilities. Premium service fees buoy capital-intensive upgrades, while municipalities roll out education campaigns, creating end-to-end business openings for integrated service providers[2]Environmental Protection Department (HKSAR), “Regulation of Disposable Plastic Tableware,” Government of the Hong Kong Special Administrative Region, epd.gov.hk.
Mandated Landfill-diversion Targets in EU & Australia
EU rules curb waste exports and require greater domestic processing. The Waste Shipments Regulation bars hazardous plastics from leaving OECD borders after November 2026 and demands third-party audits of foreign receiving plants, incentivising investment in local material-recovery facilities. Australia complements the trend with a 70% C&D recycling goal. Operators gain revenue certainty through guaranteed inbound tonnage, justifying robotic sorters, optical scanners, and refuse-derived-fuel (RDF) lines that raise recovery rates and unlock secondary materials for domestic manufacturing.
Accelerating Source-segregated Collection(Asia)
Across Asia, mandatory source segregation is raising recycling yields and slashing contamination. China’s 113 “zero-waste cities” pilot requires quantifiable diversion targets under the 14th Five-Year Plan, driving orders for two-bin trucks, kerbside sensors, and digital route-planning tools. Singapore blends policy with IoT, installing smart bins that lifted collection efficiency to 92% and cut CO₂ from haulage by 30%. Private haulers profit through consultancy and system integration, while high-purity recyclate fetches better prices, reinforcing the economic case for segregation.
Municipal Green-bond Funding Surge for Waste-to-Energy in North America
Cities are tapping sustainable debt to bankroll anaerobic digesters and gas-to-grid projects. Ottawa’s Green Debenture programme channels proceeds into collection upgrades, while the USD 271 million Piscataway Bioenergy Facility in Maryland converts biosolids into renewable gas valued at roughly USD 4 million per year. Proven pay-backs are inspiring more issuers, widening the pool of bankable projects and giving operators long-term offtake contracts.
Restraints Impact Analysis*
| Restraint | ( ~ ) % Impact on CAGR Forecast | Geographic Relevance | Impact Timeline |
|---|---|---|---|
| Export restrictions on mixed paper & plastic scrap post-Basel amendments | -0.6% | Southeast Asia; global flows | Short term (≤2years) |
| High CAPEX/ permitting delays for waste-to-energy plants | -0.5% | Europe coastal zones | Long term (≥4years) |
| Fragmented franchise & tipping-fee structures discouraging private investment | -0.4% | U.S. Midwest; similar markets | Medium term (2-4years) |
| Informal sector dominance hindering formal collection revenues | -0.3% | Sub-Saharan Africa | Medium term (2-4years) |
| Source: Mordor Intelligence | |||
Export Restrictions on Mixed Paper & Plastic Scrap (Southeast Asia)
Basel Convention plastic amendments restrict the import of low-grade bales into Malaysia and Vietnam, removing a release valve for surplus scrap from the EU and North America. Domestic capacity in exporting nations lags, so rising stockpiles tilt volumes back to landfill, raise disposal fees, and destabilise commodity prices, chilling investment in recycling upgrades.
Fragmented Franchise & Tipping-fee Structures Discouraging Private Investment (U.S. Midwest)
Municipalities across the U.S. Midwest issue individual hauling contracts, each with its rate schedule, discouraging scale economics. Operators cannot roll out uniform plant designs, inflating per-ton capital costs. Political renewal cycles add regulatory risk, further dampening private equity's appetite for large material-recovery facilities.
*Our forecasts treat driver/restraint impacts as directional, not additive. The impact forecasts reflect baseline growth, mix effects, and variable interactions.
Segment Analysis
By Waste Type: Organic Waste Dominates but E-Waste Climbs Fast
Organic waste held 41.26% municipal solid waste management market share in 2025, owing to food scraps and green waste that flow steadily from households and retailers. Adoption of city-wide food-scrap recycling schemes in California and mandatory source-segregated organics in Seoul keep volumes high, securing baseline cash flows for composting and anaerobic digestion plants. Energy-positive digesters generate electricity or renewable gas that utilities take off under feed-in tariffs, improving plant economics. The e-waste category, though smaller, is scaling rapidly at 7.45% CAGR. Japan’s plan to open 10 national e-waste hubs by 2027, for USD 191 million, underlines the official appetite for copper and rare-earth recovery. AI-enabled optical recognition now identifies circuit boards and separates lithium-ion cells, trimming labour expense and boosting metal yield. Across Europe, extended-producer schemes pay processors per kilogram, creating predictable revenues that draw infrastructure investors.
The plastics sub-stream faces higher regulatory hurdles yet invites chemical-recycling ventures capable of depolymerising post-consumer scrap into naphtha substitutes. Paper and board benefit from mature curbside programmes embedded in packaging directives, while glass recycling remains regional due to haulage weight. C&D metal recovery leverages eddy-current separators and X-ray sorters that deliver ferrous and non-ferrous fractions directly to smelters. Textile waste, still niche, is gaining attention as fashion brands commit to recycled fibre inputs; pilot depolymerisation plants in Sweden and the United States are proving concept viability.


By Source: Residential Leads, but C&D Waste is the Growth Engine
Residential streams accounted for 54.21% of the municipal solid waste management market size in 2025, supported by weekly kerbside pick-ups, unit-based pricing models, and rising per-capita consumption in middle-income cities. Operators invest in RFID-tagged carts and pay-as-you-throw billing that incentivises diversion while creating granular data for route optimisation. The construction & demolition segment is set to outpace all others, expanding 5.95% annually on the back of megaprojects from Riyadh to Mumbai. Saudi Arabia’s Vision 2030 aims to lift C&D recycling from 45% to 100% by 2025, triggering demand for mobile crushers, trommels, and aggregate-cleaning systems suitable for on-site deployment. In the Netherlands, strict landfill tax and mandatory sorting lifted recovery to 99%, offering a blueprint that other markets can emulate.
Commercial and institutional waste streams grow in line with service-sector GDP. Corporate zero-waste certifications in Nordic countries push offices to segregate everything from coffee grounds to toner cartridges, generating consultancy opportunities for haulers who supply signage, training, and data dashboards. Municipal services, waste street sweeping, and park litter remain stable but important for contract renewals and brand visibility. Haulers harness electric side-loader trucks for low-noise night collections in densely populated quarters.
By Service: Disposal Holds the Highest Share, Recycling is Scaling Faster
Disposal and treatment landfills, mass-burn incinerators, and basic transfer—captured 50.68% of 2025 revenue, anchored by tipping fees embedded in long-term municipal franchises. Nonetheless, recycling and material recovery post the fastest growth at 6.98% CAGR as regulators tie diversion targets to operating licences and as brand-owner demand for recycled content strengthens secondary-materials pricing. WM’s new USD 200 million robotics-equipped MRF in Chicago, commissioned in 2024, sorts 420,000 t/y and cuts residual to below 10%, highlighting the productivity gains of AI-driven optical scanners.
Composting and anaerobic digestion ride organics-collection mandates and low-interest green financing. California mandates 75% organics diversion by 2025, spurring dozens of city-scale digesters that co-produce fertiliser and grid-quality gas. Energy-from-waste broadens revenue streams: WSSC Water’s Piscataway project converts biosolids into RNG sold to metro bus fleets at premium rates. Ancillary “smart waste” services, sensors, analytics, and compliance audits command EBITDA margins above 35%, attracting tech entrants who license cloud platforms rather than trucks.
Geography Analysis
Asia-Pacific controlled 36.42% municipal solid waste management market share in 2025, underpinned by China’s expansion of the zero-waste city pilot to 113 municipalities and India’s smart-city programmes. These initiatives mix policy, infrastructure grants, and digital monitoring, generating a pipeline of tenders for collection vehicles, MRFs, and waste-to-energy plants. Japan’s USD 191 million investment in ten e-waste hubs signals a pivot to high-value metal recovery, while Southeast Asia accelerates domestic facility builds to offset tightening Basel-Convention import rules. Australia’s diversion targets reinforce demand for C&D recycling across the Pacific Rim.
The Middle East & Africa records the fastest regional trajectory at 6.38% CAGR through 2031. Rapid urbanisation and mega-projects such as NEOM in Saudi Arabia and Masdar City in the UAE integrate sensor-based bins, pneumatic collection, and solar-powered digesters from the design phase. Region-wide, daily urban waste already exceeds 480,000 t, and governments are moving from ad-hoc dumps to engineered sanitary landfills and energy-recovery plants. Sub-Saharan Africa’s informal recyclers remain pivotal; inclusive concession models pay cooperatives for baled PET and HDPE, raising incomes and feedstock purity. Pilot black-soldier-fly farms in Ghana turn urban food waste into high-protein feed, showcasing circular paths that cut reliance on imported soy.
North America and Europe present mature yet innovation-heavy markets. U.S. municipalities exploit investment-grade credit ratings to issue green bonds for collection fleet electrification and gas-to-grid retrofits. Canada’s extended-producer programmes shift recycling costs onto brand owners, stabilising MRF revenues. Europe leads in circular-economy metrics: the Netherlands reports 99% C&D recovery, and Germany’s packaging ordinance enforces rising recyclate quotas. Latin America’s growth stems from city-level modernisation, where Bogotá and São Paulo add RFID tags to bins and pilot pay-as-you-throw to cut public-sector collection deficits.
Mordor Intelligence provides coverage of the global municipal solid waste management market across other key regional markets, including North America, Europe, and Asia, each with their regulatory frameworks and demand patterns. Detailed country-level analysis extends to India incorporating local coverage and market participation, as required.

Competitive Landscape
The competitive arena is moderately concentrated, with the five largest operators holding a combined 28% of 2024 revenue. Waste Management Inc. completed its USD 7.2 billion Stericycle purchase in January 2025, expanding into healthcare waste and projecting USD 125 million annual cost synergies, an example of horizontal growth into high-margin niches. Republic Services sustains 31.6% EBITDA margins through disciplined pricing and fleet automation. Both firms employ AI route-optimisation, slashing fuel costs and enabling performance-based contracts that smaller rivals struggle to match.
European leaders pursue cross-border acquisitions to secure feedstock as domestic diversion targets cut residual volumes. Veolia and Suez license anaerobic digestion and membrane bioreactor technologies in fast-growing MEA and Southeast Asian markets, diversifying revenue while spreading overhead. Family-owned REMONDIS leverages long-term German concession expertise to win municipal bids in Poland and Australia, bundling recycling, street cleaning, and organics management into single-supplier contracts.
Technology differentiators are reshaping the field. Hitachi Zosen Inova and Keppel Seghers supply modular waste-to-energy plants with energy-efficiency guarantees, allowing mid-sized municipalities to avoid oversizing facilities. Start-ups offering AI-vision sorting and blockchain waste-tracking teach larger haulers to pilot new systems. Yet scale theory still rules: incumbents own transfer stations, landfills and material-sales contracts, making them natural consolidators when urban authorities push for integrated solutions.
Global Municipal Solid Waste Management Industry Leaders
Waste Managemnt Inc.
Veolia Environnement SA
Republic Services, Inc.
Waste Connections, Inc.
Suez SA
- *Disclaimer: Major Players sorted in no particular order

Recent Industry Developments
- April 2025: WM posted record Q1 2025 results, up 16.7% year-on-year, while bringing four RNG plants online to double gas output by year-end.
- February 2025: Waste Connections closed FY 2024 at USD 8.920 billion revenue and guided USD 9.450–9.600 billion for 2025 on healthy organic growth in the U.S. and Canada.
- January 2025: WM finalised the Stericycle acquisition for USD 7.2 billion, unlocking healthcare waste management synergies exceeding USD 125 million.
- October 2024: EQT Infrastructure paid a 37% premium for Covanta, adding 40 waste-to-energy plants that process 21 million tons annually.


Research Methodology Framework and Report Scope
Market Definitions and Key Coverage
Our study defines the municipal solid waste (MSW) management market as all revenue earned from organized collection, transfer, processing, recycling, energy recovery, and engineered disposal of non-hazardous household and community waste across urban and rural jurisdictions worldwide. According to Mordor Intelligence, the market stood at USD 668.95 billion in 2025 and captures service, equipment, and gate-fee income streams.
Scope exclusion: hazardous industrial residues, medical or radioactive wastes, and stand-alone waste-to-energy equipment sales are outside this assessment.
Segmentation Overview
- By Waste Type
- Organic (Food & Yard) Waste
- Paper & Cardboard
- Plastic Waste
- Metal Waste
- Glass Waste
- E-Waste
- Textiles & Leather
- Others (Rubber, wood, etc.)
- By Source
- Residential
- Commercial (Office, Retail, etc.)
- Institutional
- Municipal Services (Street Cleaning, Parks, etc.)
- Construction & Demolition
- By Service
- Collection, Transportation, Segregation & Pre-Processing
- Disposal / Treatment Method
- Recycling & Material Recovery
- Composting
- Anaerobic Digestion
- Energy Recovery (WtE / RDF / Biogas)
- Landfilling
- Others (Incineration without Energy Recovery, MBT)
- Ancillary and Support Services (Auditing, Consulting, Smart Waste Solutions, Etc.)
- By Geography
- North America
- United States
- Canada
- Mexico
- South America
- Brazil
- Argentina
- Peru
- Rest of South America
- Europe
- United Kingdom
- Germany
- France
- Italy
- Spain
- BENELUX (Belgium, Netherlands, and Luxembourg)
- NORDICS (Denmark, Finland, Iceland, Norway, and Sweden)
- Rest of Europe
- Asia-Pacific
- China
- India
- Japan
- Australia
- South Korea
- ASEAN (Indonesia, Thailand, Philippines, Malaysia, Vietnam)
- Rest of Asia-Pacific
- Middle East and Africa
- Saudi Arabia
- United Arab Emirates
- Qatar
- Kuwait
- Turkey
- Egypt
- South Africa
- Nigeria
- Rest of Middle East and Africa
- North America
Detailed Research Methodology and Data Validation
Primary Research
Mordor analysts spoke with city sanitation officers, private haulers, material-recovery-facility managers, and landfill operators across North America, Europe, Asia-Pacific, and the GCC. These conversations confirmed tariff ladders, average tipping fees, service penetration, and policy timelines, letting us fine-tune every critical variable.
Desk Research
We base our desk work on tier-1 public sources such as the World Bank "What-a-Waste" dataset, UNEP circular-economy dashboards, Eurostat treatment tables, the US EPA Sustainable Materials reports, and ISWA yearbooks. Company 10-Ks, municipal audit reports, and procurement tenders provide granular cost and technology insights that help our team sharpen assumptions.
Paid repositories, including D&B Hoovers for operator financials and Dow Jones Factiva for contract verification, complement these open datasets. The sources mentioned are illustrative only; many additional references were reviewed for data gathering and validation.
Market-Sizing & Forecasting
Our model starts with a top-down construct in which national MSW generation volumes are multiplied by collection coverage ratios, treatment-mix shares, and cost-per-ton factors to yield revenue pools. We cross-check outcomes through sampled bottom-up roll-ups of listed haulers' reported tonnage multiplied by blended average selling prices. Urban population growth, per-capita waste generation, mandated recycling targets, landfill tax escalators, and new waste-to-energy capacities form the core variable set. Multivariate regression projects values through 2030, while expert-validated scenarios bound high and low cases. When operator disclosures lag, regional tariff proxies adjusted for purchasing-power parity bridge data gaps.
Data Validation & Update Cycle
Outputs undergo variance scans against independent indicators before layered analyst reviews and sign-off. Reports refresh annually, and interim updates are triggered whenever material policy or price shocks occur, so clients always receive our latest view.
Why Mordor's Municipal Solid Waste Management Baseline Earns Trust
Published MSW estimates frequently differ because firms vary in the waste streams, cost bases, and refresh cadences they select.
Key gap drivers include scopes limited to collection fees, use of constant prices without currency realignment, and infrequent dataset updates, whereas our study captures full treatment revenues, yearly exchange-rate adjustments, and mid-cycle event reviews.
Benchmark comparison
| Market Size | Anonymized source | Primary gap driver |
|---|---|---|
| USD 668.95 bn (2025) | Mordor Intelligence | - |
| USD 125 bn (2024) | Regional Consultancy A | Excludes disposal and energy-recovery income; narrow country coverage |
| USD 129.1 bn (2025) | Trade Journal B | Applies constant 2020 prices; partial treatment mix |
| USD 118.27 bn (2024) | Global Consultancy C | Captures only publicly funded programs; refresh cycle longer than three years |
These comparisons show that our disciplined scope selection, frequent recalibration, and transparent variable logic give decision-makers the most balanced and traceable baseline available today.


Key Questions Answered in the Report
What is the current size of the municipal solid waste management market?
The market is valued at USD 707.46 billion in 2026 and is projected to reach USD 936.07 billion by 2031.
Which waste type commands the largest share today?
Organic waste leads with 41.26% municipal solid waste management market share as of 2025, sustained by consistent household food and green-waste volumes.
Why is the Middle East & Africa considered the fastest-growing region?
The region posts a 6.38% CAGR through 2031, driven by large-scale urban projects such as NEOM and rising regulatory backing for integrated waste infrastructure.
Which service segment is growing quickest?
Recycling and material recovery services are expanding at a 6.98% CAGR, outpacing disposal as regulators mandate higher diversion rates and brand owners seek recycled input.
How are green bonds influencing waste-to-energy projects?
Municipalities use green bonds to secure low-cost capital for digesters and gas-to-grid plants, ensuring long-term revenue streams and accelerating technology adoption, exemplified by Ottawa and Maryland’s Piscataway facility.
What role does e-waste play in future growth?
E-waste is the fastest-rising waste stream at 7.45% CAGR thanks to rapid tech replacement cycles and national programmes like Japan’s USD 191 million e-waste hub network that capture valuable metals for domestic industries.
Page last updated on:


