Disaster Restoration Services Market Size and Share
Market Overview
| Study Period | 2020 - 2031 |
|---|---|
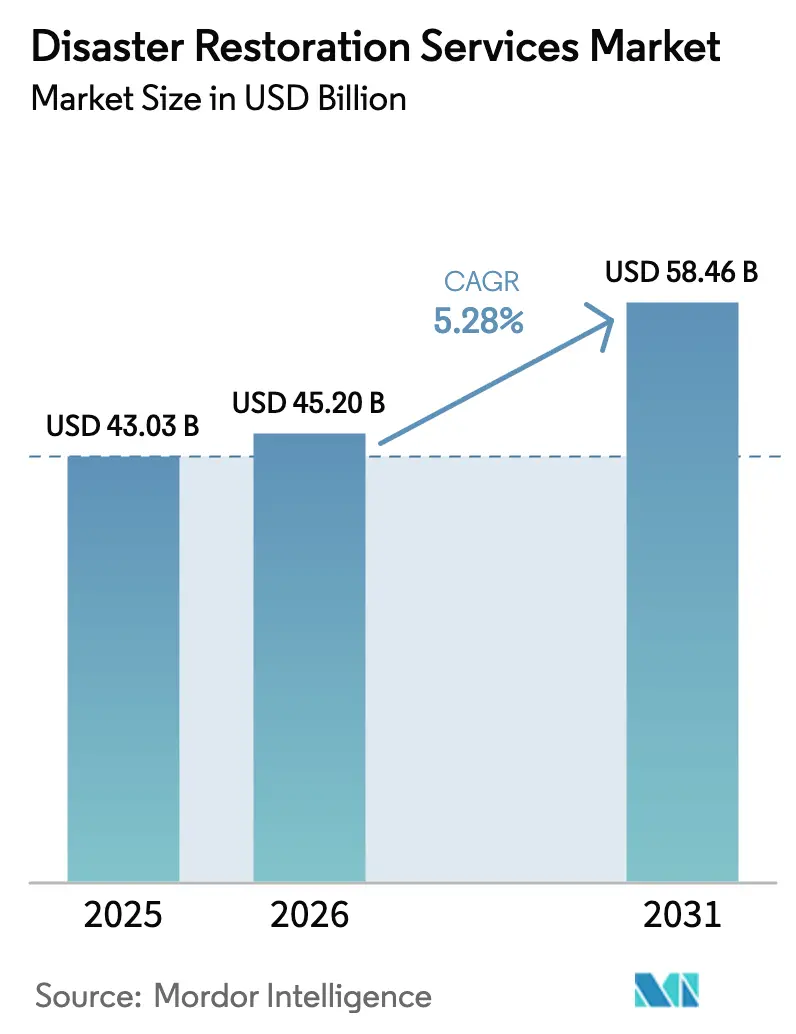
| Market Size (2026) | USD 45.20 Billion |
| Market Size (2031) | USD 58.46 Billion |
| Growth Rate (2026 - 2031) | 5.28% CAGR |
| Fastest Growing Market | Asia Pacific |
| Largest Market | North America |
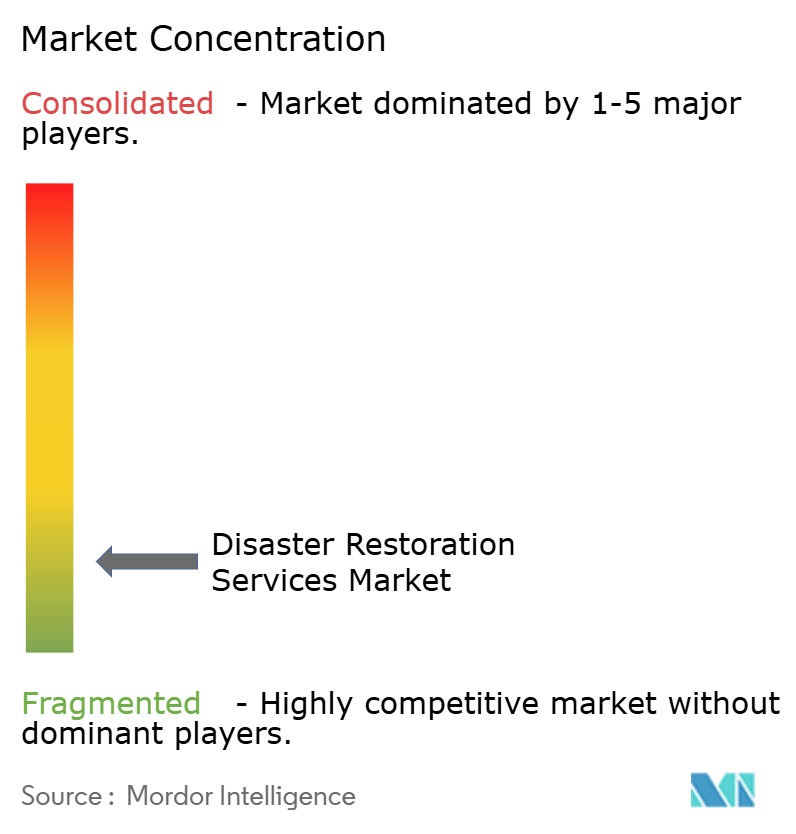
| Market Concentration | Low |
Major Players *Disclaimer: Major Players sorted in no particular order Image © Mordor Intelligence. Reuse requires attribution under CC BY 4.0. | |
Disaster Restoration Services Market Analysis by Mordor Intelligence
The Disaster Restoration Services Market size is projected to be USD 43.03 billion in 2025, USD 45.20 billion in 2026, and reach USD 58.46 billion by 2031, growing at a CAGR of 5.28% from 2026 to 2031.
Insurer withdrawal from high-risk zones and tighter deductibles are reshaping claim flows, while the volume and clustering of severe weather continue to elevate loss events that sustain professional restoration demand. Federal and state resilience funding channels are widening the pipeline for retrofit and mitigation work that complements post-event services, which supports a multi-year growth runway. Enterprise buyers are standardizing vendor requirements around safe-chemical use and documentation, which is raising qualification barriers for smaller firms and improving the bid position of scaled platforms. Technology is sharpening triage and allocation through computer vision, UAV-based inspection, and IoT telemetry, which brings faster decisions, more predictable billing milestones, and closer coordination with carriers and public agencies.
Key Report Takeaways
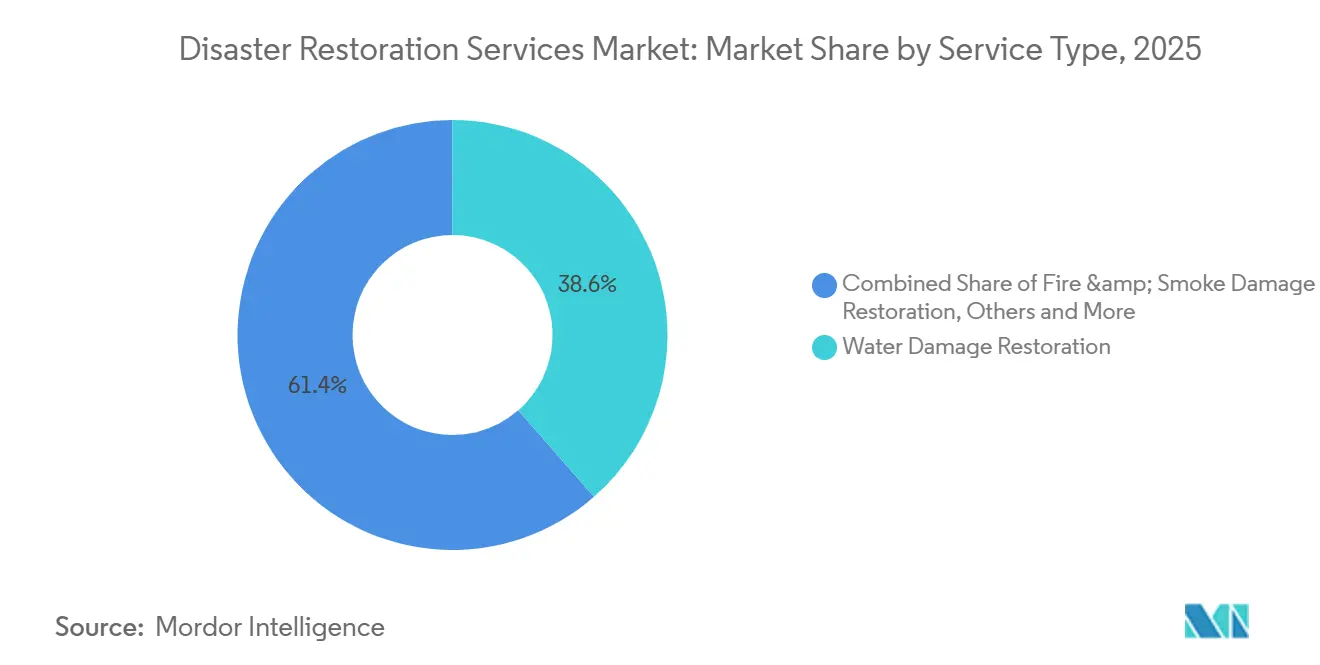
- By service type, Water Damage Restoration led with 38.56% revenue share in 2025, while Specialty & Storm Services is projected to record a 5.78% CAGR through 2031.
- By application, residential accounted for 55.67% of 2025 spending, and Commercial & Industrial is projected to advance at a 6.15% CAGR through 2031.
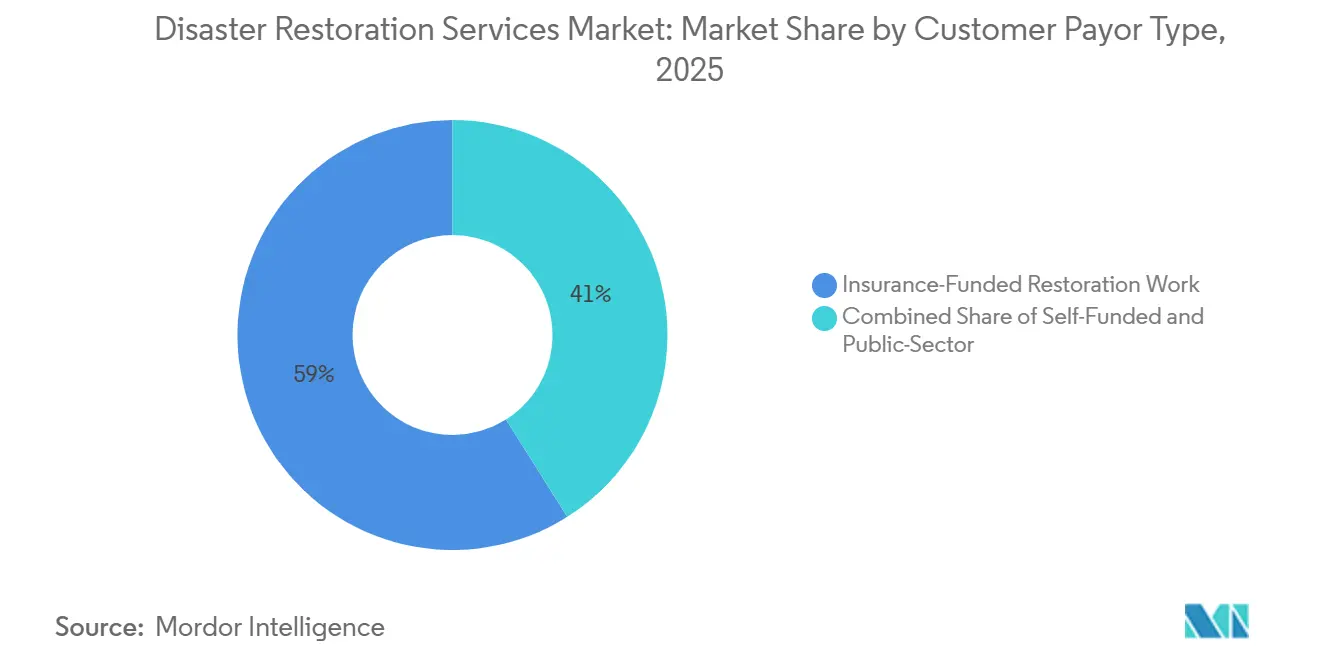
- By payor type, insurance-funded projects represented 58.97% share in 2025, and public-sector or government-funded restoration is projected to expand at a 5.98% CAGR through 2031.
- By geography, North America held 40.56% share in 2025, while Asia-Pacific is projected to be the fastest-growing region at a 6.05% CAGR through 2031.
Note: Market size and forecast figures in this report are generated using Mordor Intelligence’s proprietary estimation framework, updated with the latest available data and insights as of January 2026.
Global Disaster Restoration Services Market Trends and Insights
Drivers Impact Analysis*
| Drivers | (~) % Impact on CAGR Forecast | Geographic Relevance | Impact Timeline |
|---|---|---|---|
| Climate-change-driven spike in extreme weather events | +1.5% | Global, with acute gains in the North America Gulf Coast, California wildfire interface, Southeast Asia monsoon corridors | Long term (≥ 4 years) |
| Government resilience funding for retrofit programs | +1.0% | National, with focused programs in U.S. federal corridors and coastal EU states | Long term (≥ 4 years) |
| Insurance-platform digitization accelerates lead flow | +0.8% | North America and the EU, early enterprise uptake in Singapore, UAE | Medium term (2–4 years) |
| Predictive IoT sensors create proactive restoration contracts | +0.6% | North America core, expanding to EU industrial and hospitality, APAC pilot deployments in Japan and South Korea | Medium term (2–4 years) |
| Franchise expansion taps under-served secondary cities | +0.5% | National U.S. markets in Tier 2 and 3 MSAs, Canada provincial capitals, and Australia regional hubs | Short term (≤ 2 years) |
| ESG demand for low-toxin, sustainable chemicals | +0.4% | EU under REACH enforcement, California, and Washington State, spillover to corporate portfolios in APAC | Medium term (2–4 years) |
| Source: Mordor Intelligence | |||
Climate-Change-Driven Spike in Extreme Weather Events
The United States recorded 27 billion-dollar disasters in 2024, generating USD 182.7 billion in total costs, which kept restoration backlogs elevated across regions and underscored the scale and speed of mobilization now required from providers. First half 2025 insured losses reached USD 80 billion, the second-highest H1 total since 1980, with weather-related disasters dominating the loss mix and reinforcing the need for specialized restoration capacity. UNDRR’s latest assessments show that full-cost disaster burdens, including cascading and ecosystem losses, now run at multi-trillion-dollar levels annually, which broadens addressable work into environmental remediation, infrastructure hardening, and community resilience. Early-warning and modeling systems improve readiness, yet they compress response windows rather than eliminate damage, which places a premium on pre-positioned equipment, cross-border aid compacts, and fast triage. As insurers and public agencies absorb these patterns into planning, the disaster restoration market is stabilizing around year-round preparedness and surge execution rather than episodic mobilization.[1]https://www.ncei.noaa.gov/news/national-climate-202412
Government Resilience Funding for Retrofit Programs
Federal resilience funding is a durable tailwind for mitigation and retrofit scopes, with FEMA’s BRIC program disbursing USD 1 billion in FY 2024 to elevation, wildfire fuel reduction, and seismic upgrades that reduce future losses and open new bid channels to certified contractors. The Infrastructure Investment and Jobs Act channels multi-year capital into hazard mitigation across transport, energy, and community assets, which expands contracting opportunities that sit adjacent to post-disaster work. DOT’s PROTECT program allocated USD 1.4 billion over five years for transportation resilience projects, which aligns restoration competencies with culvert, drainage, and right-of-way upgrades that lower flood risks. Project certification, bonding, and Buy America requirements favor firms with program-management capacity and compliant supply chains, which encourages consolidation and strategic partnerships. Over time, public spending reduces disaster severity, yet it also diversifies revenue into retrofit and code-compliant replacements that underpin the disaster restoration market.[2]https://www.fema.gov/grants/mitigation/learn/building-resilient-infrastructure-communities
Insurance-Platform Digitization Accelerates Lead Flow
Digitized intake, photo-based claim initiation, and UAV-assisted inspection have reduced initial estimates from weeks to hours, which routes more qualified work to restoration dispatch before secondary damage escalates. AI-enabled damage mapping like Texas A&M’s CLARKE compresses the triage cycle to minutes at neighborhood scale, which improves prioritization and speeds documentation for reimbursement. Blockchain-linked audit trails and sensor-validated milestones are starting to support faster payment release and fewer scope disputes on large losses, which strengthens cash flow for qualified contractors. Carrier and reinsurer interest in automation continues to rise as protection gaps and severity trends increase, which elevates the value of real-time telemetry and verified performance in procurement. Over the forecast horizon, the disaster restoration market benefits from faster lead capture and documented outcomes that shrink billing friction and shorten claim cycles.[3]https://www.dhs.gov/science-and-technology/news/2025/08/20/nustl-blue-uas-first-responders-market-survey-report
Predictive IoT Sensors Create Proactive Restoration Contracts
Insurer-backed IoT programs are now mainstream in commercial settings, with HSB and Munich Re reporting 73% fewer claims and 90% lower payouts for sites protected by WINT systems, which quantifies the value of early leak detection. Monitoring and automatic shutoff create opportunities for recurring revenue through device deployment, verification, and maintenance that complement reactive services. EPA WaterSense certification adds policy support for smart leak-detection devices and drives specification language that favors validated systems and contractors with installation credentials. While prevention lowers the frequency of some incidents, contractors can offset volume effects by bundling monitoring with inspection, calibration, and compliance reporting across portfolios. The result is a shift toward hybrid service models, where proactive contracts anchor workload and rapid-response teams address the residual surge in severe weather events.
Restraints Impact Analysis*
| Restraints | (~) % Impact on CAGR Forecast | Geographic Relevance | Impact Timeline |
|---|---|---|---|
| Skilled-labor shortages lengthen response times | -0.7% | North America's deficit, the EU aging workforce, and Australia's trade-skills gaps | Long term (≥ 4 years) |
| Volatile materials and fuel costs compress margins | -0.6% | Global, with acute effects in import-dependent regions | Medium term (2–4 years) |
| Insurance-claim settlement backlogs choke cash flow | -0.5% | U.S. wildfire and hurricane zones with elevated claim volumes | Short term (≤ 2 years) |
| AI-enabled prevention cannibalizes reactive revenue | -0.3% | North America commercial portfolios, EU insurance-linked deployments, and early APAC pilots | Long term (≥ 4 years) |
| Source: Mordor Intelligence | |||
Skilled-Labor Shortages Lengthen Response Times
The U.S. construction ecosystem required 439,000 net new workers in 2025 and faces an even larger gap in 2026, which constrains certified restoration staffing and lengthens dispatch times. Average hourly earnings for production and nonsupervisory construction workers rose 4.5% year over year in late 2025, which lifted project labor costs under fixed-price schedules. Demographics and pipeline issues compound the problem as retirements rise and training supply trails demand, which reinforces wage inflation and turnover in field roles. The sector also depends on a material share of foreign-born workers, and participation shifts affect availability in certain markets and trades. Operators respond with retention, training, and selective project mix, but the labor overhang remains a structural headwind through the forecast period.[4]https://www.bls.gov/news.release/empsit.t24.htm
Volatile Materials and Fuel Costs Compress Margins
Construction input prices moved higher through 2025, with steel mill products up 13.1% and aluminum mill shapes up 22.8%, which pressured restoration margins where reimbursement schedules lag material inflation. Diesel costs climbed during mid-2025, which increased fleet mobilization and generator operations costs for emergency responses. Contracting models that rely on periodic price databases can fall out of sync with monthly spikes, which creates unrecoverable gaps unless escalation clauses are in place. Inventory and logistics strategies help, but carrying costs, obsolescence risk, and space constraints limit how far smaller operators can lean on stockpiles. In this environment, the disaster restoration market rewards vendors that document cost movements and negotiate milestone-based payouts that reflect real-time inputs.[5]https://www.bts.gov/browse-statistical-products/bts-statistical-release/national-average-motor-fuel-price
*Our forecasts treat driver/restraint impacts as directional, not additive. The impact forecasts reflect baseline growth, mix effects, and variable interactions.
Segment Analysis
By Service Type: Emergency Triage and Specialty Surge
Water Damage Restoration held 38.56% share in 2025, the largest slice among service types in the disaster restoration market. The segment remains critical because aging water infrastructure and building stock continue to drive leak and intrusion incidents that require rapid mitigation. Insurer-supported IoT programs are sharpening detection and reducing secondary loss, which shifts some work toward proactive monitoring and equipment servicing under multi-year agreements. The disaster restoration market size attached to water damage is reinforced by high-frequency, lower-severity events that aggregate to a stable baseline, which supports local crew utilization and recurring dispatch volume. Large-loss storm and fire events still redirect drying capacity and equipment fleets during surge periods, but core water mitigation keeps utilization steady between disasters.
Specialty & Storm Services is projected to be the fastest-growing service line at a 5.78% CAGR through 2031, supported by tighter chemical rules, training requirements, and property-owner preferences for certified specialists. These high-complexity jobs require specific credentials and safety protocols, which raise barriers to entry and support premium pricing relative to commoditized mitigation tasks. Providers that integrate content handling, humidity control, and IAQ restoration add margin layers and complete more of the scope in-house, which limits subcontracting leakage and sustains profitability. Across the portfolio, scaled platforms use data-driven triage to allocate crews and specialty kits to maximize throughput during spikes, while maintaining readiness for continuous water jobs that anchor the local book in the disaster restoration market.


By Application: Residential Volume vs. Commercial Velocity
Residential applications represented a 55.67% share in 2025, making them the largest user group in the disaster restoration market by job count and recurring demand. Homeowners and multifamily operators generate steady incident flow from plumbing failures, storm-related roof damage, and IAQ concerns, which produce short-duration jobs that aggregate to significant annual revenue. The disaster restoration market share for residential work reflects widespread property coverage and the geographic distribution of housing stock, which supports dense local networks of technicians and depots. In severe-weather clusters, residential volumes rise rapidly and require mutual-aid coordination across metro areas to maintain standard-of-care response times.
Commercial & Industrial is projected to be the fastest-growing application at a 6.15% CAGR to 2031, supported by data center, healthcare, and manufacturing environments where downtime is costly and technical standards are stringent. These projects often involve specialty coatings, filtration, and compliance documentation, which reward firms that can certify processes and deliver within narrow windows to control business-interruption risk. Portfolio-scale customers prefer outcome-based contracting and telemetry-verified milestones in complex facilities, which sustains higher margins and repeat business. As these programmatic requirements spread, the disaster restoration market tilts toward vendors able to integrate safety, IAQ, and continuous monitoring into standard scopes.
By Customer/Payor Type: Private Capital Redirects Public Burden
Insurance-funded projects accounted for a 58.97% share in 2025, retaining the largest channel in the disaster restoration market. Carrier practices now emphasize faster digital intake, sensor-validated milestones, and tighter documentation, which accelerates throughput when vendors align with platform standards. Insured-loss volatility tied to severe convective storms and wildfire seasons sustains work volume, while some coverage tightening shifts smaller jobs into out-of-pocket or public assistance pathways. Claims-cycle friction remains a risk in catastrophe periods, which raises the value of verified documentation and structured milestone billing to protect contractor cash flow.
Public-sector or government-funded restoration is projected to grow at a 5.98% CAGR, powered by multi-year federal resilience programs and grant mechanisms that favor mitigation, retrofit, and code upgrades. FEMA’s BRIC program disbursed USD 1 billion in FY 2024 and continues to fund pre-disaster mitigation that broadens contract opportunities for qualified firms. DOT’s PROTECT program adds transportation resilience scopes, which unlock civil-adjacent opportunities for restoration firms with engineering partnerships. Across this channel, compliance and bonding requirements raise entry thresholds, yet they also deliver schedule stability and repeat awards that underpin portfolio visibility in the disaster restoration market.
Geography Analysis
North America held a 40.56% share in 2025, which reflects high insured-property density, an established franchise ecosystem, and sustained catastrophe losses that support consistent demand in the disaster restoration market. First half 2025 insured losses totaled USD 80 billion, driven mostly by weather, which reinforced the frequency of work orders across severe convective storms and wildfire corridors. Federal and state programs continued to finance mitigation and retrofit scopes, which add schedule certainty in between peak disaster months. Claims-processing pressure during the 2025 wildfire recovery highlighted cash-flow risks for contractors, which increased the importance of milestone disbursements and verified documentation. Material cost inflation and fuel dynamics elevated project inputs, which incentivized early procurement and inventory management to uphold margins under fixed schedules. Labor scarcity remained the regional constraint that most directly affected response time and capacity allocation in peak months.
Europe’s market momentum reflects regulatory and standards leadership that is shaping vendor qualifications and procurement criteria for resilience and retrofit projects in the disaster restoration market. ISO 22372, supported by UNDRR, established guidelines for resilient infrastructure that are expected to cascade into public procurement by 2026, which raises process and documentation expectations for bidders. EU policy frameworks continue to tighten safe-chemical use and indoor air quality standards, which favors contractors that can evidence compliant materials and practices. European public agencies are also advancing digital tools in hazard forecasting and asset mapping, which support pre-positioned resources and structured triage that reduce secondary damage and accelerate restart timelines.
Asia-Pacific is projected to be the fastest-growing region at a 6.05% CAGR through 2031 as expanding urban exposure, critical infrastructure investment, and rising insurance uptake intensify demand for organized restoration capabilities in the disaster restoration market.
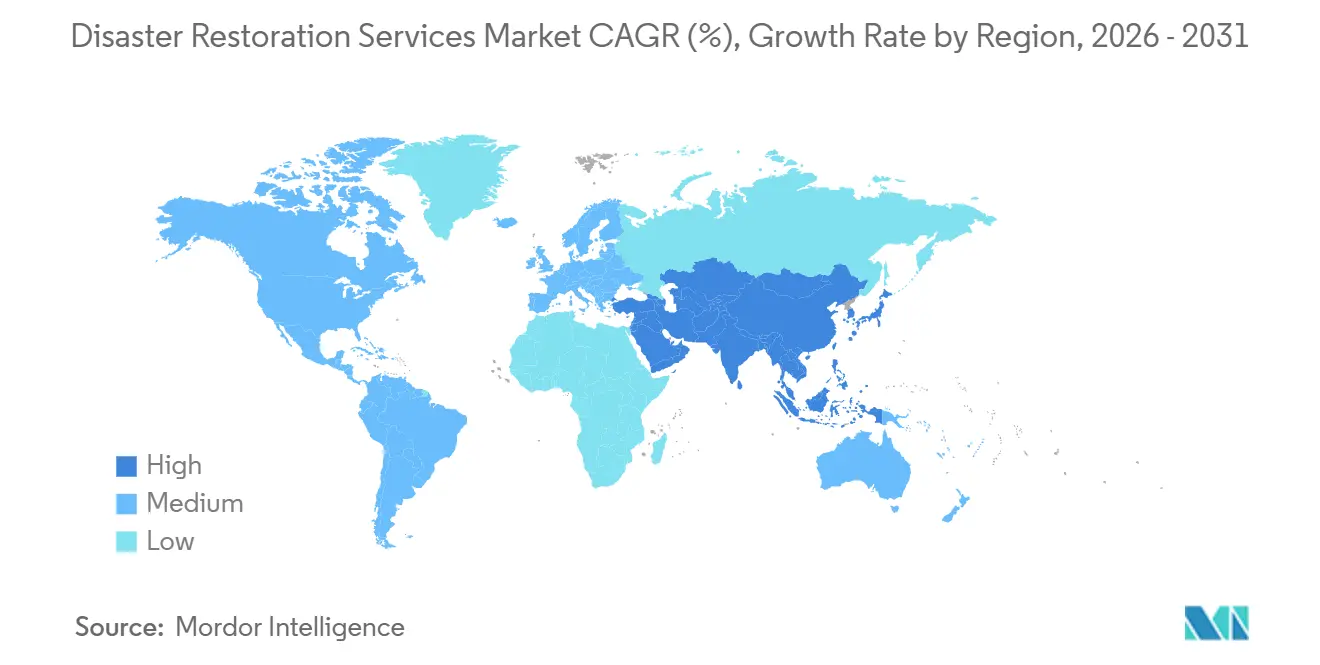

Competitive Landscape
The disaster restoration services market is fragmented. Competition remains local and time-sensitive, yet national and multi-regional platforms are consolidating share where carrier panels, compliance standards, and specialized certifications matter most in the disaster restoration market. Scaled operators use centralized procurement to lower equipment costs, invest in training to expand specialty certifications, and deploy standardized documentation for carrier and public-agency workflows. UAV and computer-vision deployments are increasingly standard in event triage, which improves job routing and accelerates claim support files. University-developed AI tools like CLARKE demonstrate how rapid visual intelligence can compress initial assessment to minutes and shift technician time to mitigation and stabilization.
Strategic moves focus on capital access, technology, and standards alignment. Insurer-linked capital solutions continue to evolve, as shown by structured catastrophe bonds that complement traditional reinsurance and support faster recovery financing. Carriers and large property portfolios are piloting sensor-validated milestones for drying and IAQ, which reduce scope disputes and enable earlier payments to vendors. Standards are also rising, with ISO 22372 orienting infrastructure projects toward resilience and life-cycle risk, which raises documentation expectations for bidders and rewards platforms that invest in process maturity.
Operationally, leading platforms blend asset readiness, surge logistics, and compliance. Fuel and materials volatility has pushed more firms to refine stocking and routing models so emergency deployments can proceed without margin erosion during price spikes. Labor remains the tactical bottleneck, which has spurred investments in training and retention to sustain on-call coverage and skill depth. In parallel, sustainability criteria are expanding in RFPs, from safer-chemical requirements to waste diversion targets, which advantage contractors that can evidence compliant products and track outcomes in the disaster restoration market.
Disaster Restoration Services Industry Leaders
Belfor Holdings, Inc
ServiceMaster Restore
Paul Davis Restoration
Rainbow International
Servpro Industries, LLC
- *Disclaimer: Major Players sorted in no particular order

Recent Industry Developments
- December 2025: Swiss Re Capital Markets structured and closed a USD 400 million catastrophe bond, Topanga Re Ltd., for Farmers Insurance Group with a four-year term and a drop-down mechanism for reinstatement after a third event.
- November 2025: The International Association of Insurance Supervisors published its Global Insurance Market Report special edition on natural catastrophe protection gaps, highlighting large uninsured shares of global losses.
- November 2025: ISO published Standard 22372, Guidelines for Resilient Infrastructure, developed with UNDRR support and aligned to the Sendai Framework, with expected procurement influence by mid-2026.
- October 2025: Munich Re reported global insured losses of USD 80 billion in H1 2025, driven primarily by weather-related disasters, with severe convective storms and wildfires significant in the United States.


Global Disaster Restoration Services Market Report Scope
The disaster restoration services market is defined as the industry focused on providing repair and recovery services for properties impacted by natural or human-induced disasters, such as floods, fires, storms, and mold damage. Services aim to restore safety, functionality, and value across residential, commercial, and industrial sectors post-disaster.
The Disaster Restoration Services Market is segmented into Service Type, Application, and Region. By service type, the market is segmented into water damage restoration, fire and smoke damage restoration, mold remediation, and specialty services. By application, the market is segmented into residential and commercial. By region, the market is segmented into North America, Europe, Asia-Pacific, Latin America, and Middle East & Africa. The report offers market size and forecasts in terms of value (USD) for all the above segments.
| Water Damage Restoration (drying/dehumidification, sewage backup) |
| Fire & Smoke Damage Restoration |
| Mold Remediation |
| Storm / Catastrophe Restoration (wind, hail, flood response, large-loss) |
| Biohazard & Trauma Cleanup (crime scene, unattended death, infectious cleanup) |
| Others (contents restoration, pack-out, cleaning, storage, etc.) |
| Specialty & Storm Services |
| Residential |
| Commercial & Industrial |
| Insurance-funded Restoration Work |
| Self-funded / Direct-pay Restoration Work |
| Public-sector / Government-funded Restoration Work |
| North America | United States |
| Canada | |
| Rest of North Amercia | |
| South America | Brazil |
| Argentina | |
| Rest of South America | |
| Europe | United Kingdom |
| Germany | |
| France | |
| Italy | |
| Spain | |
| Rest of Europe | |
| Asia-Pacific | China |
| India | |
| Japan | |
| Australia | |
| ASEAN (Indonesia, Thailand, Philippines, Malaysia, Vietnam) | |
| Rest of Asia-Pacific | |
| Middle East and Africa | Saudi Arabia |
| United Arab Emirates | |
| Turkey | |
| South Africa | |
| Rest of Middle East and Africa |
| By Service Type | Water Damage Restoration (drying/dehumidification, sewage backup) | |
| Fire & Smoke Damage Restoration | ||
| Mold Remediation | ||
| Storm / Catastrophe Restoration (wind, hail, flood response, large-loss) | ||
| Biohazard & Trauma Cleanup (crime scene, unattended death, infectious cleanup) | ||
| Others (contents restoration, pack-out, cleaning, storage, etc.) | ||
| Specialty & Storm Services | ||
| By Application | Residential | |
| Commercial & Industrial | ||
| By Customer/Payor Type | Insurance-funded Restoration Work | |
| Self-funded / Direct-pay Restoration Work | ||
| Public-sector / Government-funded Restoration Work | ||
| By Geography | North America | United States |
| Canada | ||
| Rest of North Amercia | ||
| South America | Brazil | |
| Argentina | ||
| Rest of South America | ||
| Europe | United Kingdom | |
| Germany | ||
| France | ||
| Italy | ||
| Spain | ||
| Rest of Europe | ||
| Asia-Pacific | China | |
| India | ||
| Japan | ||
| Australia | ||
| ASEAN (Indonesia, Thailand, Philippines, Malaysia, Vietnam) | ||
| Rest of Asia-Pacific | ||
| Middle East and Africa | Saudi Arabia | |
| United Arab Emirates | ||
| Turkey | ||
| South Africa | ||
| Rest of Middle East and Africa | ||


Key Questions Answered in the Report
What is the disaster restoration market size and growth outlook to 2031?
The disaster restoration market size is USD 45.20 billion in 2026 and is forecast to reach USD 58.46 billion by 2031, reflecting a 5.28% CAGR.
Which service type leads the disaster restoration market, and which will grow fastest?
Water Damage Restoration led with 38.56% share in 2025, and Specialty & Storm Services is projected to grow the fastest at a 5.78% CAGR through 2031.
Which application segment is expected to expand most quickly?
Commercial & Industrial is projected to grow at a 6.15% CAGR through 2031, driven by critical facilities and portfolio-scale buyers that value fast recovery and compliance documentation.
How are insurers and public programs shaping demand in the disaster restoration market?
Digital intake, UAV inspection, and sensor-validated milestones are speeding claim cycles, and programs like FEMA’s BRIC and DOT’s PROTECT are funding mitigation projects that complement post-event scopes.
What are the main cost and capacity risks for restoration providers?
Labor shortages and wage growth are stretching response capacity, and material and fuel volatility are compressing margins where reimbursement schedules lag real-time costs.
Which region leads and which grows fastest in the disaster restoration market?
North America held 40.56% share in 2025, while Asia-Pacific is projected to be the fastest-growing at a 6.05% CAGR through 2031.
Page last updated on:


