Marine Port Services Market Size and Share
Market Overview
| Study Period | 2020 - 2031 |
|---|---|
| Market Size (2026) | USD 98.36 Billion |
| Market Size (2031) | USD 120.47 Billion |
| Growth Rate (2026 - 2031) | 4.14% CAGR |
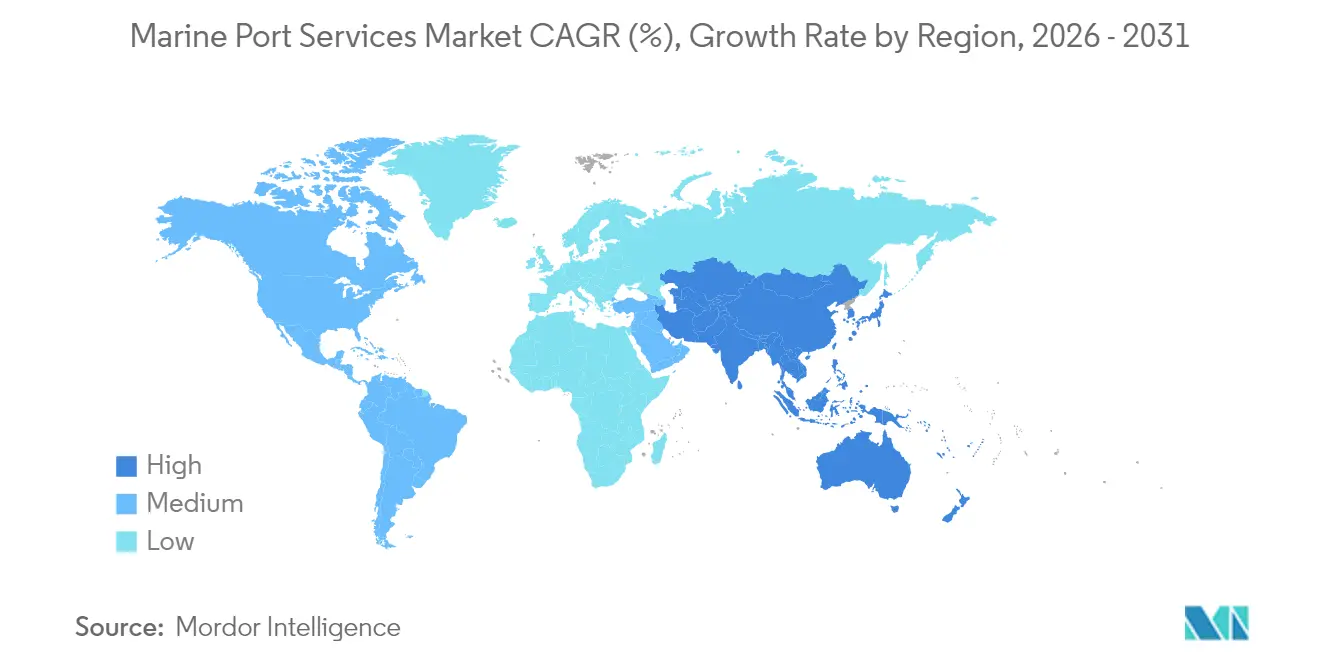
| Fastest Growing Market | Asia Pacific |
| Largest Market | Asia-Pacific |
| Market Concentration | Low |
Major Players
*Disclaimer: Major Players sorted in no particular order Image © Mordor Intelligence. Reuse requires attribution under CC BY 4.0. |
|
Marine Port Services Market Analysis by Mordor Intelligence
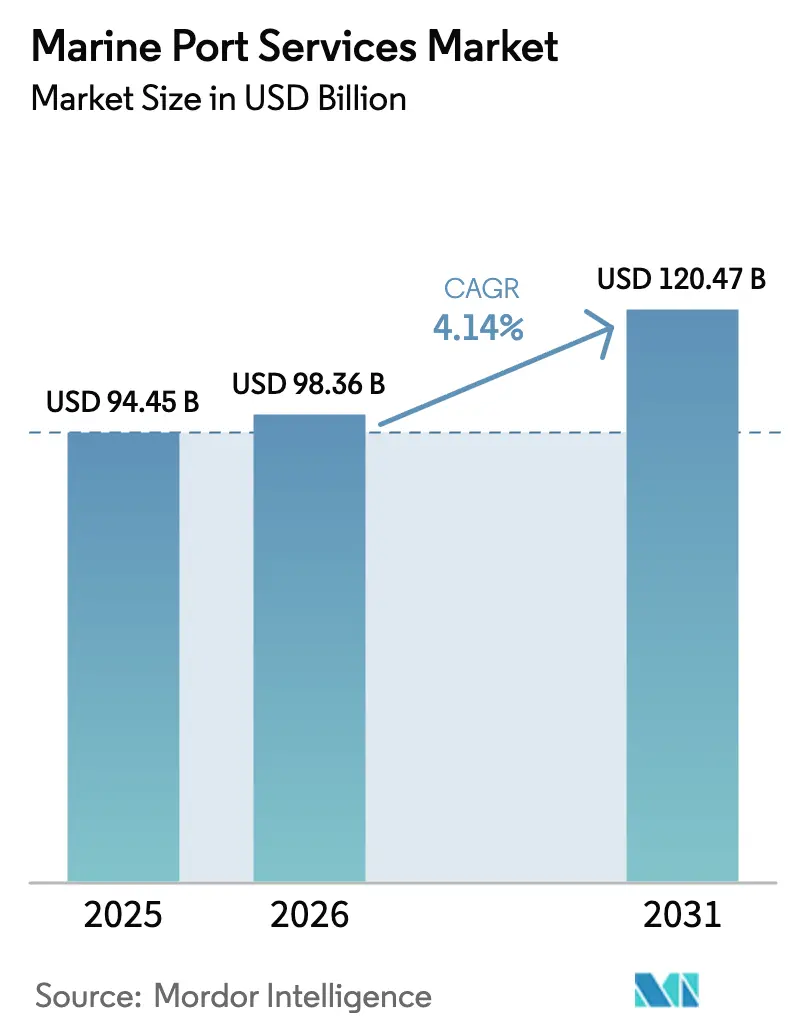
The Marine Port Services Market size was valued at USD 94.45 billion in 2025 and estimated to grow from USD 98.36 billion in 2026 to reach USD 120.47 billion by 2031, at a CAGR of 4.14% during the forecast period (2026-2031).
The steady trajectory is underpinned by a 6% rebound in global container volumes in 2024, with 183.2 million TEUs shipped worldwide. Year-to-date through October 2025, global volumes stand 4% higher than the same period in 2024, with the industry on track for a record-breaking year. Government infrastructure programs inject more than USD 200 billion into port modernization, and the United States alone directs sizable federal funding through comprehensive legislation. Asia-Pacific extends its leadership as both a demand hub and a supply base, while technology adoption improves throughput and creates resilience against geopolitical chokepoints. Environmental regulation accelerates capital spending on shore-power systems, driving new procurement cycles despite near-term cost pressure. Consolidation unfolds by way of alliances rather than outright mergers, enabling operators to scale digital platforms without diluting regional autonomy.
Key Report Takeaways
- By geography, Asia-Pacific held 40.70% of marine port services market share in 2025 while posting the fastest CAGR at 4.67% through 2031.
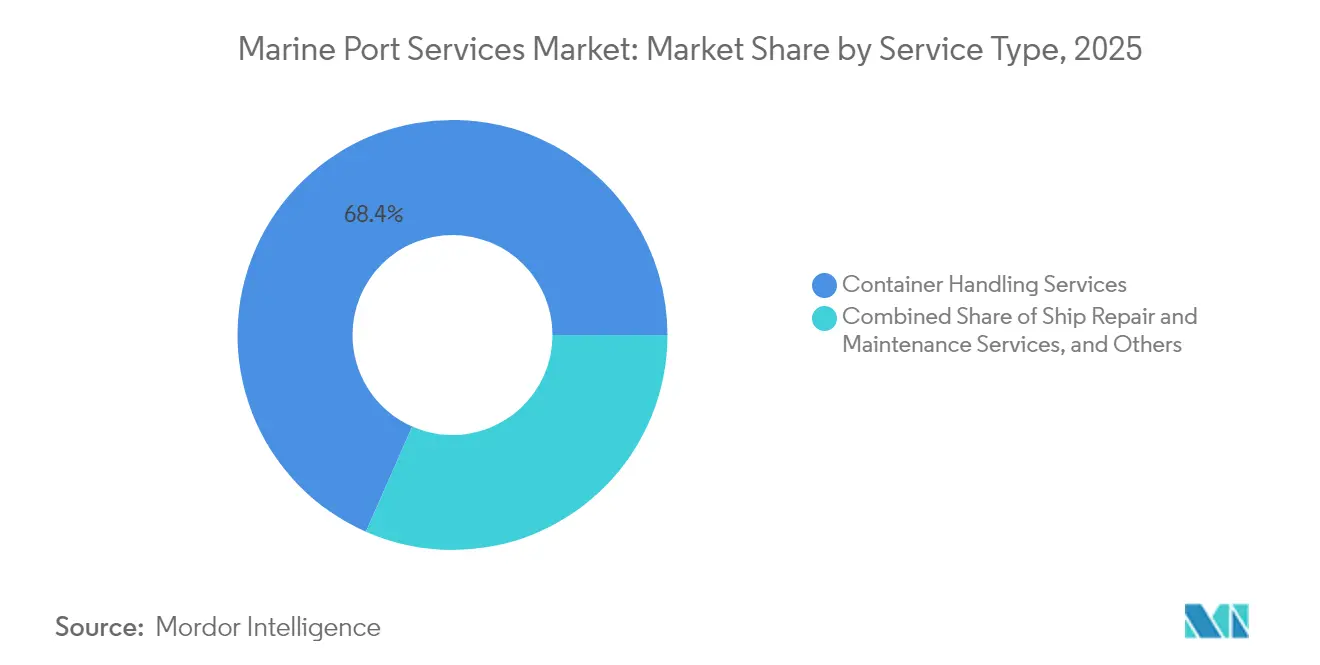
- By service, container handling commanded 68.40% share of the marine port services market size in 2025, whereas supply-chain and logistics solutions are projected to expand at a 4.18% CAGR to 2031.
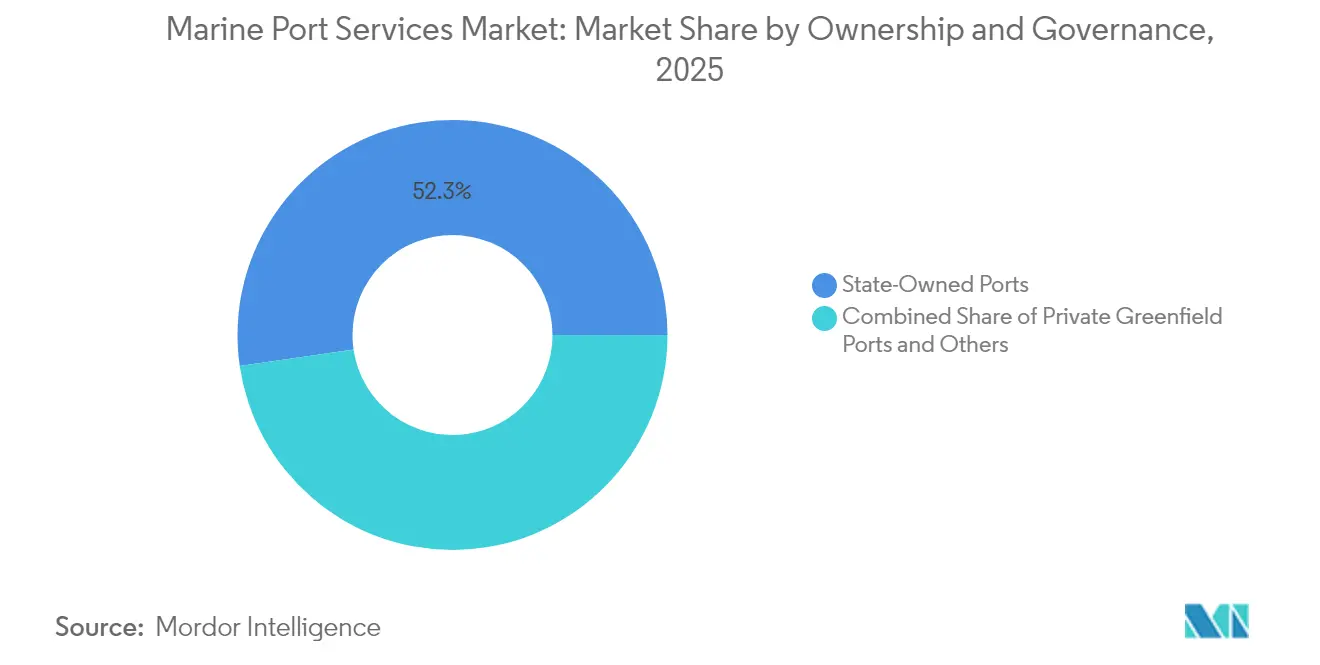
- By ownership, state-owned facilities retained 52.30% share of the marine port services market size in 2025, but PPP/concession ports exhibit the highest forecast CAGR at 3.74% to 2031.
Note: Market size and forecast figures in this report are generated using Mordor Intelligence’s proprietary estimation framework, updated with the latest available data and insights as of 2026.
Global Marine Port Services Market Trends and Insights
Drivers Impact Analysis*
| Driver | % Impact on CAGR Forecast | Geographic Relevance | Impact Timeline |
|---|---|---|---|
| Surge in global containerized trade volumes | +1.2% | Global, with APAC and North America leading | Short term (≤ 2 years) |
| Government-backed port infrastructure investments | +0.8% | Global, concentrated in US, EU, India, China | Medium term (2-4 years) |
| Rapid digitalization & automation of port operations | +0.6% | APAC core, spill-over to Europe and North America | Medium term (2-4 years) |
| Near-shoring-driven secondary-port demand | +0.4% | North America and Latin America primarily | Long term (≥ 4 years) |
| Offshore-wind logistics support services | +0.3% | Europe, North America East Coast, APAC selective markets | Long term (≥ 4 years) |
| Arctic shipping lane emergence | +0.2% | Northern Europe, Russia, Arctic nations | Long term (≥ 4 years) |
| Source: Mordor Intelligence | |||
Surge in Global Containerized Trade Volumes
In 2024, global container volumes rebounded by 6%, reaching a total of 183.2 million TEUs shipped worldwide. As of October 2025, global volumes have already surpassed the previous year's figures by 4%, positioning the industry for a potential record-breaking year. [1]“CTS October 2025 Press Release” container statistics, containerstatistics.com. Leading carriers increased port calls per rotation by 18%, channeling more revenue toward stevedoring and ancillary services. Automated terminals benefited most, registering 25-30% higher productivity and securing price premiums despite larger upfront costs. Port authorities reacted by approving USD 45 billion in expansion projects slated for completion by 2027. The sustained volume pipeline encourages operators to maintain berth utilization above 80%, reinforcing confidence in the marine port services market.
Government-Backed Port Infrastructure Investments
Public funding accelerates modernization, with the EU allocating EUR 12.4 billion (USD 13.68 billion) under TEN-T for maritime corridors[2]"Fact Sheet: The Bipartisan Infrastructure Deal", White House, whitehouse.gov. In India, the Sagarmala program coordinates multipurpose terminals and rail connectivity to boost hinterland reach. Around 60% of approved budgets are dedicated to electrification, shore-power, and renewable energy integration, creating long-term demand for engineering, procurement, and construction expertise. Improved infrastructure attracts private concessionaires who pledge performance guarantees, expanding the addressable base of the marine port services market
Rapid Digitalization and Automation of Port Operations
Asia-Pacific ports pioneer automated guided vehicles, digital twins, and AI-based scheduling tools that raise crane productivity by double digits. Predictive systems lower unplanned downtime and shrink vessel turnaround windows, supporting higher berth utilization. Compliance frameworks such as ISO 28000 elevate demand for secure data interchange platforms, positioning ports as logistics orchestrators rather than passive nodes. Lessons from Malaysia’s automation playbook provide emerging markets with proven pathways to replicate gains[3]“Trans-European Transport Network Funding,” European Commission, transport.ec.europa.eu.
Near-Shoring-Driven Secondary-Port Demand
Manufacturers shifting production closer to consumers reroute cargo to secondary U.S. Gulf Coast terminals that reported record volumes in 2024[4]“Gulf Coast Ports Near-shoring Benefits,” American Association of Port Authorities, aapa-ports.org. Automotive and electronics flows from Mexico prefer ports offering direct rail access to Midwest distribution centers, shortening door-to-door transit times. Private equity funneled USD 2.3 billion into these facilities in 2024, financing cranes, yard equipment, and warehouse space. Ports with resilient intermodal links now compete head-to-head with traditional hub gateways, reshaping the revenue mix of the marine port services market.
Restraints Impact Analysis*
| Restraint | % Impact on CAGR Forecast | Geographic Relevance | Impact Timeline |
|---|---|---|---|
| High capital intensity & long payback cycles | -0.7% | Global, particularly acute in emerging markets | Medium term (2-4 years) |
| Stringent environmental & decarbonization mandates | -0.5% | Europe and North America primarily, expanding globally | Short term (≤ 2 years) |
| Geopolitical chokepoint disruptions | -0.4% | Global, concentrated in Middle East, Asia-Europe routes | Short term (≤ 2 years) |
| Competition from inland dry-ports & land corridors | -0.3% | Europe, North America, China primarily | Long term (≥ 4 years) |
| Source: Mordor Intelligence | |||
High Capital Intensity and Long Payback Cycles
Automated container yards require USD 150-200 million upfront, and payback often extends beyond a decade, limiting participation by smaller authorities. Private operators demand minimum-volume clauses that shift demand risk onto port owners, challenging liquidity management. Currency depreciation in several African economies caused port project costs to overrun by up to 30%, underscoring exchange-rate exposure. Elevated interest rates amplify financing hurdles, slowing expansion of the marine port services market.
Stringent Environmental and Decarbonization Mandates
FuelEU Maritime rules coming into force in 2025 compel container berths handling vessels above 5,000 GT to provide shore-power. Installation budgets of USD 15-25 million per berth intensify capital pressure. Inclusion of shipping in the EU ETS adds USD 80-120 per TEU, squeezing margins for carriers and ports alike. Smaller terminals risk cargo diversion if they cannot meet emission standards quickly, tempering growth prospects for the marine port services market.
*Our forecasts treat driver/restraint impacts as directional, not additive. The impact forecasts reflect baseline growth, mix effects, and variable interactions.
Segment Analysis
By Service: Container Handling Dominates Revenue Streams
Container handling accounted for 68.40% of the marine port services market share in 2025, validating the structural shift toward containerized trade. The segment benefits from high switching costs and scale advantages, keeping throughput fees firm even in volatile demand cycles. Supply-chain and logistics solutions represent the fastest-growing opportunity, rising at a 4.18% CAGR as ports transform into integrated distribution hubs. Technology-enabled visibility platforms further monetize cargo data streams, supplementing traditional handling revenues.
Real-time analytics have lowered dwell times and reduced the need for buffer stock, allowing shippers to adopt just-in-time models without sacrificing reliability. Automated cranes and stackers require 40% fewer personnel, boosting margins while creating room for performance-based contracting. As multimodal offerings expand, supply-chain services could narrow the revenue gap with core handling functions, reinforcing diversification across the marine port services market.


By Ownership and Governance: Private Capital Accelerates Efficiency
State-controlled entities still command 52.30% of the marine port services market size, but PPP and concession formats are scaling faster with a 3.74% CAGR. Governments leverage private sector know-how to accelerate automation and unlock efficiencies, illustrated by Brazil’s USD 1.2 billion terminal awards in 2024. Private greenfield ports, though currently the smallest slice, achieve crane moves per hour 20-25% above state averages and roll out new technology several years earlier.
ISO 28000 certification has become table stakes for winning long-term concessions because carriers emphasize secure, traceable supply chains. Private sponsors often embed performance clauses tied to yard throughput, encouraging continuous improvement. This alignment positions concessionaires to outpace legacy facilities, heightening competitive intensity in the marine port services market.
Geography Analysis
Asia-Pacific retained 40.70% of overall revenue in 2025 and is forecast to grow at 4.67% CAGR through 2031, bolstered by China’s automation roadmap and India’s Sagarmala corridors. Belt and Road investments totaling USD 62 billion across 34 foreign projects extend Chinese terminal influence, diverting cargo toward preferred routes. Southeast Asian facilities gained 12% volume in 2024, aided by electronics and apparel manufacturing shifts to Vietnam, Thailand, and Indonesia. Port planners emphasize dual-fuel equipment and renewable energy, keeping environmental compliance on track while optimizing operating expenditure.
Europe focuses on decarbonization and digital twins. Rotterdam’s EUR 850 million (USD 938.09 million) green-bond program targets shore-power across 25 berths, aiming for carbon-neutral operations by 2030. Hamburg reduced equipment downtime by 22% after adopting predictive models, freeing berth capacity for higher-margin services. Integrated rail and river networks extend port hinterlands deep into Central Europe, mitigating congestion risk and stabilizing the marine port services market.
North America leverages near-shoring to Mexico and infrastructure funding to modernize East and Gulf Coast terminals. Federal support complements private investment, raising crane density and on-dock rail capacity at Houston, New Orleans, and Mobile. Canadian Arctic gateways prepare for seasonal cargo via the Northern Sea Route, positioning for niche grains and minerals trades as ice-free periods lengthen. Competition now hinges on reliability and integrated customs processing rather than solely on vessel size accommodation, reshaping regional dynamics of the marine port services market.

Competitive Landscape
Global operators remain fragmented yet cooperative. DP World, APM Terminals, and PSA build digital corridors that integrate customs, trucking, and warehousing under single platforms. Strategic partnerships allow sharing of predictive analytics without full asset consolidation, preserving regional control while scaling technology. AI-based maintenance cuts troubleshooting hours and reduces spare-parts inventory, trimming operational overhead and widening margins.
Niche entrants capture opportunities in offshore wind logistics and Arctic support, areas overlooked by mainstream players. Specialized fleets and heavy-lift cranes differentiate service capability and attract project cargo. ISO-certified environmental management systems are now prerequisites for long-term carrier contracts, raising the qualification bar for new entrants. The moderate concentration leaves room for further clustering, yet capital barriers deter rapid newcomer entry, maintaining balance within the marine port services market.
Mergers have been limited; instead, operators acquire minority stakes or sign long-term management contracts. Hutchison Ports’ USD 580 million entry into Barcelona enhances Mediterranean reach without full-scale consolidation risk. DP World’s extra capacity at Jebel Ali raises its throughput to secure rerouted Asia-Europe flows, further anchoring its role as a transshipment hub between the two regions. Competitive positioning increasingly revolves around carbon-management credentials and data transparency, not only berth length or draft depth.
Marine Port Services Industry Leaders
-
APM Terminals
-
MAN-TESS group
-
Schulte & Bruns GmbH & Co. KG
-
American President Lines (APL) (Subsdiary of CMA CGM)
-
Ports America
- *Disclaimer: Major Players sorted in no particular order


Recent Industry Developments
- January 2025: DP World closed a USD 1.8 billion expansion at Jebel Ali, adding 4.5 million TEU of capacity to capture traffic diverted from the Red Sea.
- December 2024: COSCO Shipping Ports invested USD 2.1 billion in eight mainland China terminals to deploy autonomous cranes and vehicles, aiming for 30% productivity improvement by 2026.
- November 2024: Port of Rotterdam Authority issued EUR 850 million (USD 938.09 million) in green bonds to install shore-power at 25 berths.
- October 2024: APM Terminals signed a USD 650 million concession with Santos Port Authority to automate Terminal 4 and integrate rail links to Sao Paulo.


Global Marine Port Services Market Report Scope
Global Port Services are ideally placed to provide clients with an unparalleled solution in marine logistics and port agency services, handling in excess of 800 port call movements. In the UK and overseas, global port services means the company that has an infrastructure that supports the main operational ports as well as having a very strong supply chain team that allows pre-planned or short notice calls to be managed efficiently and effectively utilising a skilled, multi-disciplined workforce. The Global Marine port Services Market is segmented By Service Analysis (container handling services, ship repair and maintenance services, supply chain, Mechanical and electrical engineering services, navigation services and Logistics Solutions) and By Geography (North America, Europe, Asia-Pacific and Latin America , Middle East and Africa). The report offers market size and forecasts for Global Marine Port Services Market in value ( USD Billion ) for all above segments.
| Container Handling Services |
| Ship Repair and Maintenance Services |
| Supply-Chain and Logistics Solutions |
| Other Services |
| State-Owned Ports |
| PPP / Concession Ports |
| Private Greenfield Ports |
| North America | United States |
| Canada | |
| Mexico | |
| South America | Brazil |
| Peru | |
| Chile | |
| Argentina | |
| Rest of South America | |
| Asia-Pacific | India |
| China | |
| Japan | |
| Australia | |
| South Korea | |
| South East Asia (Singapore, Malaysia, Thailand, Indonesia, Vietnam, and Philippines) | |
| Rest of Asia-Pacific | |
| Europe | United Kingdom |
| Germany | |
| France | |
| Spain | |
| Italy | |
| BENELUX (Belgium, Netherlands, and Luxembourg) | |
| NORDICS (Denmark, Finland, Iceland, Norway, and Sweden) | |
| Rest of Europe | |
| Middle East and Africa | United Arab of Emirates |
| Saudi Arabia | |
| South Africa | |
| Nigeria | |
| Rest of Middle East And Africa |
| By Service | Container Handling Services | |
| Ship Repair and Maintenance Services | ||
| Supply-Chain and Logistics Solutions | ||
| Other Services | ||
| By Ownership and Governance | State-Owned Ports | |
| PPP / Concession Ports | ||
| Private Greenfield Ports | ||
| By Geography (Value, USD billion) | North America | United States |
| Canada | ||
| Mexico | ||
| South America | Brazil | |
| Peru | ||
| Chile | ||
| Argentina | ||
| Rest of South America | ||
| Asia-Pacific | India | |
| China | ||
| Japan | ||
| Australia | ||
| South Korea | ||
| South East Asia (Singapore, Malaysia, Thailand, Indonesia, Vietnam, and Philippines) | ||
| Rest of Asia-Pacific | ||
| Europe | United Kingdom | |
| Germany | ||
| France | ||
| Spain | ||
| Italy | ||
| BENELUX (Belgium, Netherlands, and Luxembourg) | ||
| NORDICS (Denmark, Finland, Iceland, Norway, and Sweden) | ||
| Rest of Europe | ||
| Middle East and Africa | United Arab of Emirates | |
| Saudi Arabia | ||
| South Africa | ||
| Nigeria | ||
| Rest of Middle East And Africa | ||


Key Questions Answered in the Report
How fast is container handling revenue expected to grow through 2031?
It is projected to advance at a 4.14% CAGR, keeping pace with overall market expansion documented in this report.
Which region adds the greatest absolute value between 2026 and 2031?
Asia-Pacific contributes the largest incremental revenue due to high trade volumes and sustained 4.67% CAGR, supported by automation and infrastructure funding.
What drives interest in secondary U.S. Gulf Coast ports?
Supply-chain near-shoring from Mexico, combined with federal modernization grants, has lifted Gulf Coast throughput to record levels in 2024.
How do FuelEU Maritime rules influence capital spending?
Each qualifying berth must install shore-power at a cost of USD 15-25 million, prompting ports to raise green-bond financing or seek concessionaire funding.
Why are PPP models gaining momentum in emerging markets?
Private capital accelerates technology deployment and reduces public debt burdens, leading to productivity rates 20-25% above comparable state-owned facilities.
Page last updated on:


