Market Overview
| Study Period | 2020 - 2031 |
|---|---|
| Market Size (2026) | USD 117.22 Billion |
| Market Size (2031) | USD 147.15 Billion |
| Growth Rate (2026 - 2031) | 4.65% CAGR |
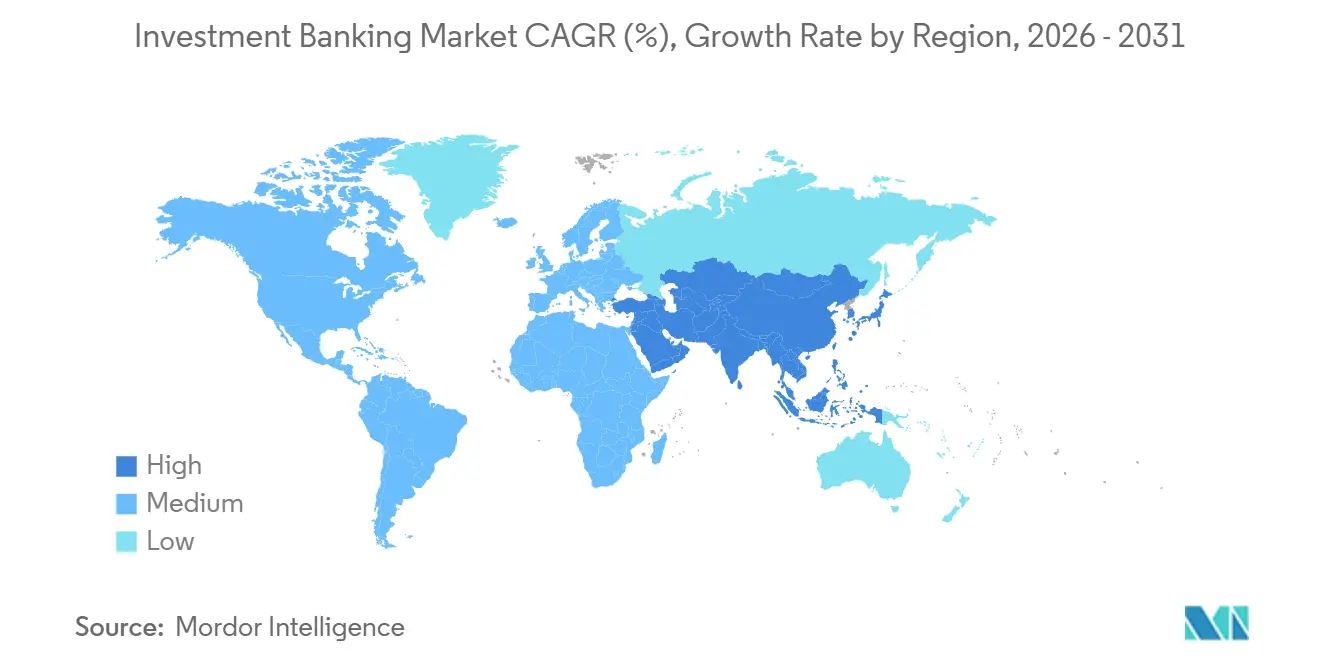
| Fastest Growing Market | Asia Pacific |
| Largest Market | North America |
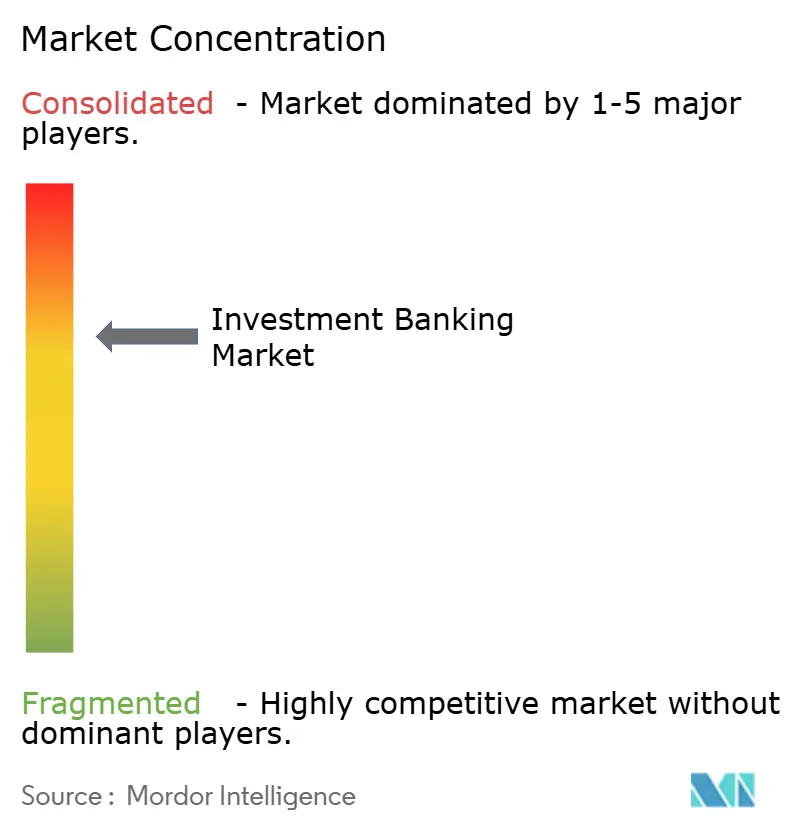
| Market Concentration | Medium |
Major Players *Disclaimer: Major Players sorted in no particular order Image © Mordor Intelligence. Reuse requires attribution under CC BY 4.0. | |
Investment Banking Market Analysis by Mordor Intelligence
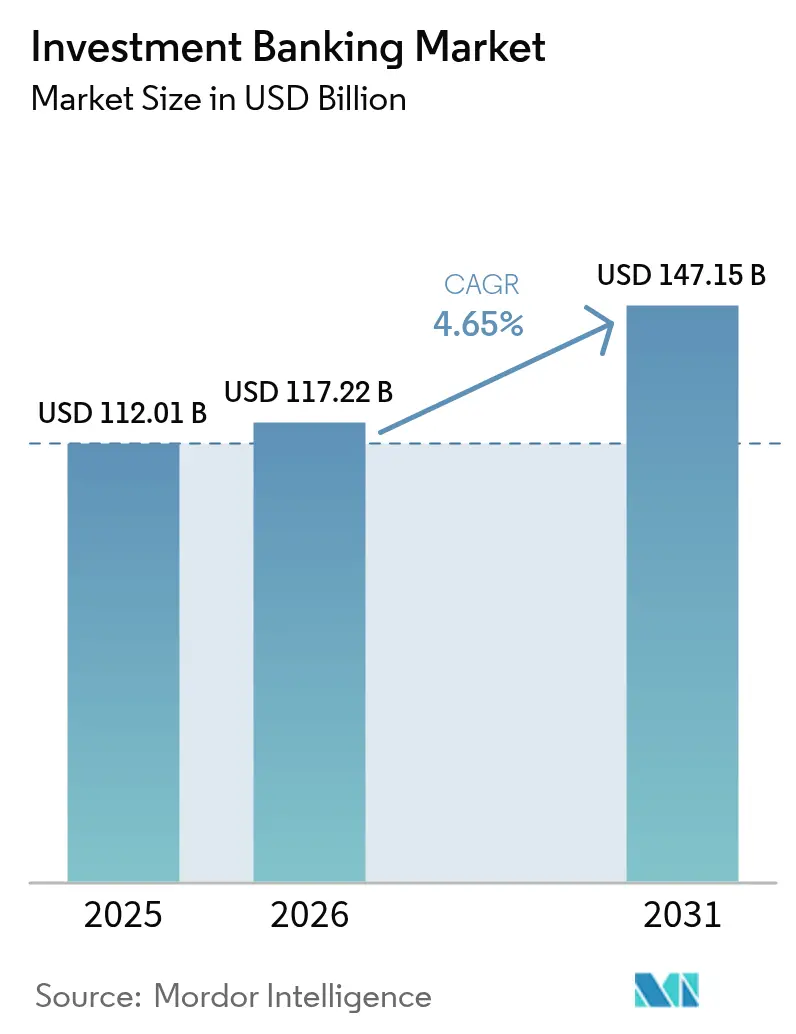
The Investment Banking Market size is expected to grow from USD 112.01 billion in 2025 to USD 117.22 billion in 2026 and is forecast to reach USD 147.15 billion by 2031 at 4.65% CAGR over 2026-2031.
The recovery aligns with a steadier equity issuance runway in 2025, as new listings and follow-ons improved alongside firmer aftermarket performance, which helped strengthen issuer confidence through early 2026. Debt formation is also supportive as corporates refinance at scale, which is visible in new corporate security issuance data for 2025 in the United States, reflecting persistent demand for bond underwriting and liability management. Equity-linked financing contributed as convertible issuance rebounded in 2025, reinforcing a bridge to later-stage listings and recapitalizations in the pipeline for 2026. Settlement-cycle changes to T+1 in North America have compressed operating windows for cross-border books, which issuers and underwriters have absorbed through process adjustments, dedicated United States workflow coverage, and earlier documentation readiness. These dynamics, together with calmer volatility conditions, have supported a more selective, quality-focused issuance environment and a measured uplift in activity across key product lines as 2026 gets underway.
Key Report Takeaways
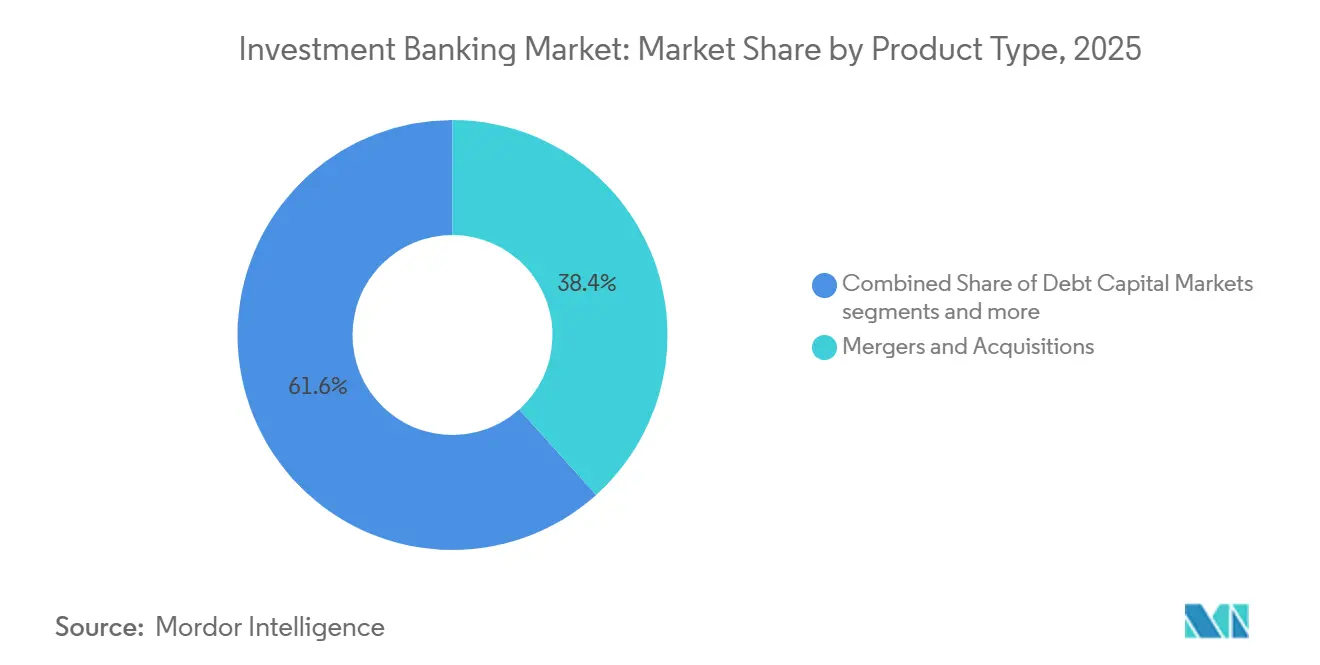
- By product type, mergers & acquisitions led with 38.35% of the Investment Banking market share in 2025, while equity capital markets is projected to grow at a 5.54% CAGR through 2031.
- By deal size, large-cap transactions accounted for 33.78% of the Investment Banking market share in 2025, while small-cap deals are projected to expand at a 6.66% CAGR through 2031.
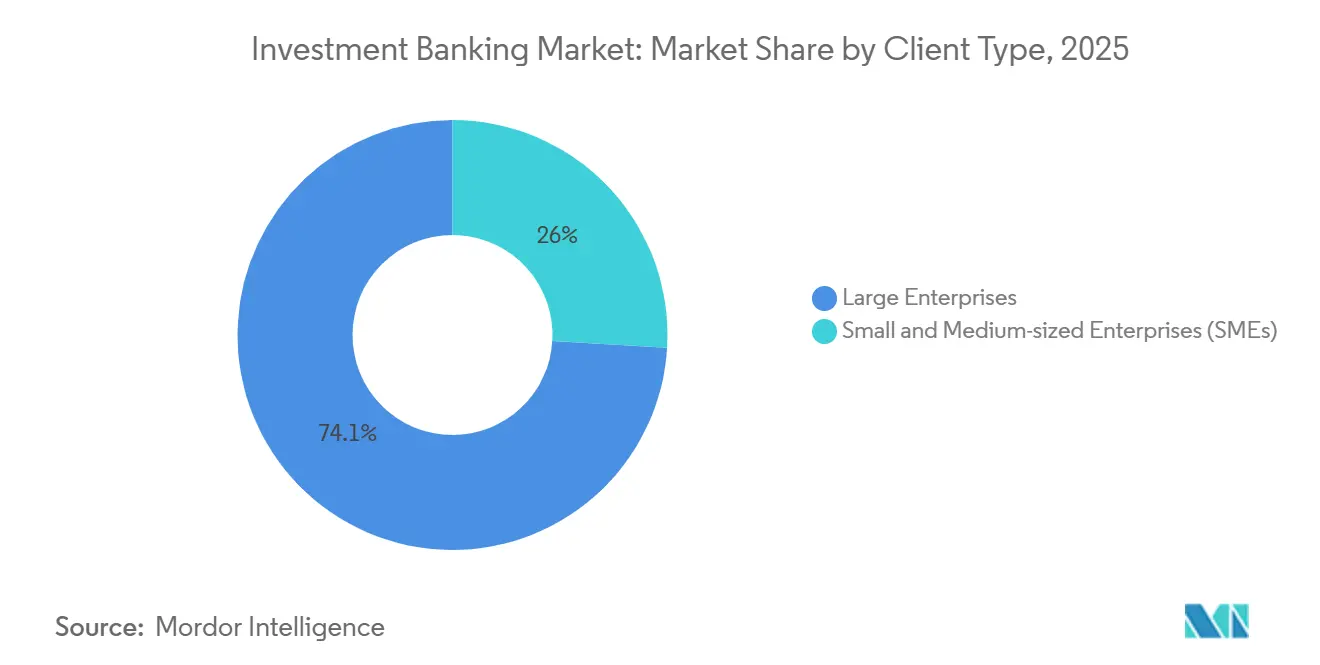
- By client type, large enterprises held 74.05% revenue of the Investment Banking market share in 2025, while SMEs are projected to grow at a 7.12% CAGR through 2031.
- By industry vertical, BFSI captured 37.36% revenue of the Investment Banking market share in 2025, while healthcare and pharmaceuticals are projected to grow at a 5.86% CAGR through 2031.
- By geography, North America held 52.10% of the Investment Banking market share in 2025, while Asia-Pacific is projected to expand at a 6.37% CAGR through 2031.
Note: Market size and forecast figures in this report are generated using Mordor Intelligence’s proprietary estimation framework, updated with the latest available data and insights as of 2026.
Global Investment Banking Market Trends and Insights
Drivers Impact Analysis*
| Driver | (~) % Impact on CAGR Forecast | Geographic Relevance | Impact Timeline |
|---|---|---|---|
| IPO and follow-on window reopen at stable rates and lower volatility | +1.2% | Global, with primary concentration in North America and the Asia-Pacific | Medium term (2-4 years) |
| Refinancing "maturity wall" catalyzes bond and loan issuance | +0.9% | Global, with heightened urgency in the United States and Europe | Short term (≤ 2 years) |
| Private equity dry powder and exit cycle revival lift advisory demand | +1.1% | Global, with North America and Europe holding the majority of the dry powder | Medium term (2-4 years) |
| Cross-border and carve-out megadeal resurface, lifting fee density | +0.8% | Global, with the strongest activity in North America inbound flows and the Asia Pacific outbound expansion | Long term (≥ 4 years) |
| Bank–private credit club solutions unlock fee pools without heavy RWA | +0.4% | North America and Europe, where Basel III pressures are most acute | Short term (≤ 2 years) |
| AI-enabled origination and diligence improve pitch-to-mandate conversion | +0.3% | Global, with the fastest adoption in North America and select EMEA institutions | Long term (≥ 4 years) |
| Source: Mordor Intelligence | |||
IPO and Follow-On Window Reopens on Stable Rates and Lower Volatility
Equity primary markets stabilized in 2025, which improved execution quality and broadened investor participation in the core United States issuance venues [1]RBC Capital Markets Research, “2025 Takeaways and 2026 Outlooks: U.S. Equity Markets Perspectives,” RBC Capital Markets, rbccm.com. New-issue volume and investor reception strengthened as capital markets digested a steadier rate outlook and pricing discipline, with the United States IPO market posting higher proceeds and better relative performance by late 2025. Asia-Pacific issuance momentum complemented this trend, with Hong Kong ranking at the top for global IPO fundraising in 2025 on the back of larger transaction sizes and improved aftermarket support. Equity-linked financing helped bridge issuers into public markets as convertible bond issuance climbed during 2025, which reflected both refinancing needs and issuer preference for flexible structures. The sum of these catalysts supported a healthier pipeline into 2026, with banks prioritizing quality mandates and ready-to-list profiles that meet selective investor demand across North America and Asia-Pacific.
Refinancing "Maturity Wall" Catalyzes Bond and Loan Issuance
A material wall of maturing high-yield bonds and leveraged loans through the mid-2020s has been a clear catalyst for elevated underwriting, liability management, and refinancing activity for banks and issuers. Investment-grade issuers continue to refinance opportunistically in a higher but stabilizing rate environment, sustaining robust new-issue calendars into 2026 as credit markets prize duration, spread discipline, and forward capacity. In the United States, new corporate security issuance expanded in 2025, underscoring the centrality of bond markets for corporate funding needs and providing fee durability for underwriting platforms[2]Board of Governors of the Federal Reserve System, “New Security Issues, U.S. Corporations,” Federal Reserve, federalreserve.gov. Secondary market depth, active dealer support, and institutional demand for high-quality paper have reinforced issuer confidence to pull forward maturities and term out debt, which channels steady fee flow into debt capital markets franchises. The interplay of refinancing needs, investor demand, and issuer readiness is set to keep Investment Banking market activity constructive across DCM and liability management mandates during 2026.
Private Equity Dry Powder and Exit Cycle Revival Lift Advisory Demand
Private equity exit routes reopened in 2025, with sponsor-backed IPOs returning in greater size and with sturdier aftermarket outcomes, which improved confidence in equity-based exits. Equity markets posted another year of double-digit returns in 2025, which helped narrow bid-ask spreads and supported board-level decisions to advance sell-side processes in 2026. The ongoing rotation toward high-quality, cash-generative targets with clear opportunity cases has increased the share of larger mandates in advisory pipelines, concentrating fee pools in complex, multi-product transactions. Refinancing windows have also supported sponsor flexibility to extend holds or prepare balance sheets ahead of exit, which sustains demand for advisory support on secondary sales and equity recapitalizations. These crosscurrents point to continued Investment Banking market engagement with private capital sponsors across sell-side M&A, carve-outs, and capital raising as 2026 advances.
Cross-Border and Carve-Out Megadeals Resurface, Lifting Fee Density
Cross-border M&A returned to a more active footing through 2025, with inbound transactions into the Americas and outbound activity from parts of Asia improving fee density for banks with global platforms and regulatory depth. Carve-outs accelerated as corporates streamlined portfolios, which created complex separation, diligence, and financing workstreams that benefit advisors with sector and transaction-ops capabilities. These transactions attract premium advisory rates due to cross-border complexity, regulatory timelines, and multi-product structuring, which concentrate revenue opportunities among platforms that combine advisory with ECM, DCM, and risk solutions. With a more favorable equity backdrop and refinancing optionality in place, boards are advancing strategic alternatives that include separations or asset sales, which reinforces the Investment Banking market’s mix shift toward higher-value mandates. Broader participation by sovereign investors and strategic partners has also supported larger transaction checks and execution certainty on transformational deals, especially where long-dated capital is required.
Restraints Impact Analysis*
| Restraint | (~) % Impact on CAGR Forecast | Geographic Relevance | Impact Timeline |
|---|---|---|---|
| Stricter antitrust and national security reviews elongate/tamp mega deals | -0.7% | Global, with the highest intensity in the United States (CFIUS/DOJ) and the EU (EC merger control) | Medium term (2-4 years) |
| Basel III Endgame raises RWA/capital, constraining underwriting appetite | -0.5% | Global, with the United States and Europe facing the most acute implementation pressure | Short term (≤ 2 years) |
| T+1/T+0 settlement frictions for cross-border equity issuance | -0.2% | United States, Canada, Mexico (T+1 live), United Kingdom, EU, Switzerland (T+1 Oct 2027), ongoing for emerging markets | Medium term (2-4 years) |
| Private credit siphons fee-rich leveraged loan syndications | -0.4% | North America and Europe, where private credit AUM is concentrated | Long term (≥ 4 years) |
| Source: Mordor Intelligence | |||
Stricter Antitrust and National Security Reviews Elongate or Tamp Mega Deals
Transaction reviews remain rigorous in 2026, as national security and competition authorities have sustained close scrutiny of large strategic deals and sensitive-sector investments. CFIUS continues to focus on technology, data, infrastructure, and critical supply chains, and has reinforced expectations that parties plan for mitigation and extended timelines on cross-border transactions that touch these domains. The combination of expanded filing content in merger regimes and intensified screening has lengthened sign-to-close intervals for complex multi-jurisdictional deals, which affects execution schedules and increases the cost of capital for acquirers. Advisory practices have been adapted by investing in regulatory strategy, which includes early engagement planning and remedy frameworks that reduce uncertainty but still add preparation time. This regulatory cadence can deter marginal deals while channeling Investment Banking market focus toward transactions that can underwrite regulatory certainty and value creation within reasonable timelines.
Basel III Endgame Raises RWA and Capital, Constraining Underwriting Appetite
Large-bank capital recalibration under the final Basel III implementation remains a central constraint for balance-sheet-intensive activities in 2026. United States agencies issued a final rule that modifies certain capital standards and reduces the enhanced supplementary leverage ratio at the depository institution level, which offers limited relief while leaving aggregate Tier 1 requirements broadly intact for large banking organizations [3]Federal Reserve Board, “Agencies issue final rule to modify certain capital standards,” Federal Reserve, federalreserve.gov. The Bank Policy Institute has highlighted how higher capital requirements can reduce balance-sheet flexibility and growth, which encourages banks to prioritize fee-based advisory work and capital-light intermediation models. In the United Kingdom, the Prudential Regulation Authority finalized its Basel 3.1 implementation timeline with an effective date in 2027, which provides banks additional time to prepare systems and capital structures [4]Bank of England, “Implementation of the Basel 3.1: Final rules,” Bank of England, bankofengland.co.uk. These capital and leverage dynamics reinforce a broader Investment Banking market shift toward originate-to-distribute models, club financing with private credit, and structured capital solutions that optimize risk-weighted asset usage while safeguarding client coverage.
*Our forecasts treat driver/restraint impacts as directional, not additive. The impact forecasts reflect baseline growth, mix effects, and variable interactions.
Segment Analysis
By Product Type: M&A Advisory Retains Scale, ECM Captures Momentum
M&A advisory accounted for 38.35% of global revenues in 2025, underscoring the primacy of relationship-led, board-level mandates in fee pools for the Investment Banking market. Advisory pipelines benefited from a healthier equity backdrop in late 2025, which improved exit optionality and narrowed valuation gaps, allowing corporates and sponsors to re-engage on strategic alternatives with firmer conviction. Equity Capital Markets is the fastest-growing product line, with the Investment Banking market size for ECM projected to expand at a 5.54% CAGR through 2031 as IPO and follow-on volumes continue to rebuild. United States IPO proceeds improved in 2025 and helped validate a more durable issuance window, while Hong Kong led global IPO fundraising in 2025, reinforcing the cross-regional depth of ECM opportunities. Equity-linked financing further supported balance-sheet flexibility for issuers, with 2025 convertible activity providing an additional path to time-to-market execution in ECM pipelines for 2026.
Debt Capital Markets remained active around refinancing and terming out liabilities, aided by steady demand for investment-grade issuance and a constructive rate environment that encouraged proactive calendar management. Liability management exercises, including exchanges and tender offers, helped issuers address maturity peaks, which channeled stable underwriting and advisory revenues to DCM teams. Syndicated loans and leveraged finance activity faced share pressure from private credit in the middle market, yet banks remained central in complex, cross-product financings that require risk management, hedging, and broad distribution. Across product lines, platforms that pair advisory with ECM and DCM have sustained an advantage in multi-track processes where financing certainty, regulatory depth, and investor access determine outcomes in the Investment Banking market. The Investment Banking industry continues to shift wallet share toward mandates that combine strategic advice with financing, data, and technology-enabled execution, which supports platform earnings quality into 2026.


By Deal Size: Large-Cap Dominates Value, Small-Cap Accelerates Growth
Large-cap transactions at USD 1–5 billion accounted for 33.78% of 2025 transaction value, reflecting the concentration of fee pools in mandates that require deeper advisory benches and multi-product execution in the Investment Banking market. Banks with integrated advisory, ECM, DCM, and risk-solutions capabilities have remained well placed to win these mandates, especially where simultaneous financing and hedging are required. The return of a steadier equity issuance window helps facilitate larger public-to-private or corporate combinations by enhancing exit visibility and capital structure flexibility. Refinancing depth in bond markets also supports execution certainty on larger deals, as issuers and sponsors look to align maturities and fund strategic actions in 2026. The Investment Banking industry uses these conditions to prioritize mandates where advisory, underwriting, and risk distribution can be combined in a single engagement.
Small-cap transactions under USD 250 million are projected to grow at a 6.66% CAGR through 2031, the fastest rate by deal size, which broadens coverage needs and emphasizes technology-enabled origination and execution for Investment Banking market participants. As part of this trend, banks and advisors are investing in digital sourcing, standardized diligence, and streamlined documentation to reduce transaction costs and cycle times for sub-USD 250 million deals without compromising quality. Regional platforms and sector boutiques that leverage data, automation, and targeted investor networks have become more competitive in the lower middle market. For financing, private credit engagement complements bank-led solutions at smaller sizes, which allows sponsors and founder-led companies to secure capital without relying on public ratings or broadly syndicated loans. The Investment Banking market size across these tiers benefits from more accessible digital toolkits that raise throughput and win rates for teams working multiple live mandates concurrently.
By Client Type: Large Enterprises Anchor Revenue, SMEs Offer Accelerated Growth
Large enterprises held 74.05% of 2025 revenues, underlining their central role across large strategic M&A, investment-grade bond issuance, and equity-linked financing in the Investment Banking market. These corporates typically engage banks across multiple product lines at once, which raises wallet concentration and justifies dedicated coverage and industry specialization. A more supportive equity and bond climate gives treasurers and boards latitude to advance growth strategies, pursue separations, and lock in capital structures that extend duration. The Investment Banking market continues to reward platforms that can combine execution with insights on regulatory clearance, investor signaling, and balance-sheet implications for large corporates. On multi-track mandates, integrated offerings across advisory, ECM, DCM, and risk help align timing and investor messaging, which improves close rates and fee density.
SMEs are projected to grow at a 7.12% CAGR through 2031, which makes them the fastest-growing client cohort in the Investment Banking market as technology and alternative financing broaden access to sophisticated advisory. Digital origination and workflow tools have reduced time-to-engage and diligence costs, which improves feasibility for sub-USD 100 million transactions where advisory budgets are tighter. Private credit partnerships and bank distribution offer execution certainly at smaller sizes, helping SMEs finance acquisitions, recapitalize, or pursue growth that might otherwise require public market access. Cross-border flows in the lower middle market are also rising, which creates opportunities for advisors with niche sector knowledge and cross-regional investor networks. The Investment Banking industry is responding by tailoring coverage to founder-led companies and regional champions with curated investor access and cost-aware, time-certain processes.
By Industry Vertical: BFSI Leads Share, Healthcare Accelerates Growth
BFSI captured 37.36% revenue share in 2025, reflecting sustained bank consolidation, asset and wealth management combinations, and broader platform digitization that continues to generate advisory and capital-raising mandates for the Investment Banking market. The sector’s ongoing technology modernization is visible in bank partnership announcements that incorporate AI and cloud-native infrastructure for operating resilience and client experience gains. Capital relief tools and structured transactions, including risk transfer and balance-sheet optimization, remain important for lenders adjusting to revised capital and leverage requirements. With active debt markets and selective equity windows, BFSI deal flow spans domestic consolidation, platform buildouts, and divestitures, which sustain fee pools across M&A, ECM, and DCM. The Investment Banking market continues to emphasize regulatory depth and product integration when serving BFSI clients that require parallel workstreams across multiple capital solutions.
Healthcare and pharmaceuticals are projected to grow at a 5.86% CAGR through 2031, supported by pipeline refills, strategic acquisitions in therapeutics, and a recovery in healthcare new listings, which together underpin an expanding advisory and capital-raising slate. The sector’s IPO cohort delivered stronger relative returns in 2025, which improved confidence for future listings and secondary activity in 2026. With innovation and regulatory pathways shaping outcomes, healthcare mandates reward advisors with deep scientific diligence and regulatory expertise at the FDA and EMA interface. Financing depth across equity and equity-linked products helps issuers sequence trials, fund acquisitions, and sustain development, which creates multi-year Investment Banking market engagement in the vertical. Energy transition infrastructure and data economy buildouts in related adjacent verticals also support healthcare supply chains and digital infrastructure for clinical operations and commercialization.
Geography Analysis
North America held 52.10% of global revenues in 2025 and remains the largest regional contributor to the Investment Banking market, supported by healthier equity issuance and solid bond market activity that together sustain advisory and underwriting momentum. United States market breadth improved in 2025 as IPO proceeds strengthened and equity-linked financing rose, which helped fund growth and refinancing agendas for issuers preparing for 2026. Debt capital markets remained a durable anchor as new corporate security issuance increased in 2025, which demonstrated capacity for refinancing and liability management at scale. While the T+1 rule in the United States improved settlement efficiency, it also introduced new operational demands on cross-border allocations and FX funding that underwriters and investors addressed with earlier confirmations and process changes. These features collectively kept Investment Banking market engagement high across M&A, ECM, and DCM in North America during 2025 and into 2026.
Asia-Pacific is projected to expand at a 6.37% CAGR through 2031, the fastest among major regions for the Investment Banking market size, supported by robust issuance in 2025 and deepening cross-border flows. Hong Kong was the leading global IPO fundraising venue in 2025, which signaled investor readiness for larger issues and stronger aftermarket support in the region. Regional IPO proceeds in 2025 were strong, and banks point to a constructive 2026 outlook on the back of an improved pipeline and selective reopening of windows in key markets. Institutions are also investing capacity to capture intra-Asia flows and cross-border advisory as globalization patterns shift and regional capital markets deepen. With increased emphasis on technology, infrastructure, and energy transition, the Asia-Pacific is positioned to deliver incremental mandates across ECM, DCM, and M&A in 2026.
Europe sustained a healthier M&A and capital-raising environment in 2025 and is preparing for operating changes tied to T+1 settlement in 2027, which will align European settlement cycles with North America and support post-trade efficiency. The United Kingdom’s Basel 3.1 timeline gives banks time to adapt capital structures and systems, which may help maintain underwriting and market-making capacity as rules phase in. In South America, selective issuance and cross-border listings by multilateral institutions on European venues underscore the availability of capital for regional priorities, including infrastructure and energy. Across the Middle East and Africa, sovereign investment programs and strategic partnerships have increased capital flows into North America and Europe, which create co-investment and advisory opportunities for banks with cross-regional coverage. These developments keep the Investment Banking market globally engaged and diversified across regions, even as local regulatory and settlement calendars require careful execution planning in 2026.

Competitive Landscape
Competitive intensity in the Investment Banking market remains elevated, with bulge-bracket platforms using integrated advisory and underwriting capabilities to compete for complex, multi-product mandates that command premium fees. Firms with strong ECM franchises benefited from steadier United States and Asia-Pacific equity windows in 2025, which supported sponsor exits and corporate financings into early 2026. DCM platforms continued to anchor fee pools on refinancing and liability management as issuers addressed near-term maturities. Banks that combine advisory with risk management, hedging, and distribution have captured more wallets share on multi-track deals where certainty and timing are pivotal. This integrated model underpins the Investment Banking market’s resilience across cycles and regions.
Partnerships between banks and private credit providers have become a durable feature of large-cap and middle-market financings, which allows banks to originate and structure while using partner balance sheets for hold positions. The regulatory environment continues to steer banks toward capital-light revenue, an orientation reinforced by Basel III Endgame calibration and leverage considerations. These constraints, coupled with strong investor appetite for private credit, have encouraged hybrid club structures where banks preserve client primacy and origination fees while distributing risk. At the same time, operational innovations around T+1 have raised the bar for post-trade readiness and global coordination in cross-border equity deals. Banks and advisors that institutionalize these practices are positioned to capture share as issuance conditions improve in 2026.
Strategic moves by leading players have focused on capacity expansion in high-growth regions, risk-transfer transactions to free capital, and digital infrastructure partnerships to modernize operations. For example, global banks announced staffing expansions in Asia-Pacific to pursue rising intra-Asia flows and deepen client coverage in Hong Kong, India, and Singapore. Advisory support for significant risk transfer structures continued into 2026, highlighting the growing use of synthetic securitizations to optimize capital. Banks also renewed technology partnerships to embed AI into operations and risk management, which improves resilience and speeds execution across front-to-back processes. These choices reinforce a competitive playbook that pairs advisory depth with capital efficiency and digital enablement in the Investment Banking market.
Investment Banking Industry Leaders
J.P. Morgan Chase & Co.
Morgan Stanley
Citi Group Inc
Goldman Sachs Group, Inc.
BofA Securities, Inc.
- *Disclaimer: Major Players sorted in no particular order

Recent Industry Developments
- February 2026: UBS, following record North Asia inflows in 2025, announced plans to recruit approximately 50 wealth-management bankers in Hong Kong. This strategic initiative aims to strengthen its high-net-worth client coverage and enhance regional integration efforts, reflecting its commitment to expanding its presence in the region.
- October 2025: NiSource established an at-the-market equity offering program for up to USD 1.5 billion through 2028, appointing a multi-bank syndicate, which exemplifies the use of flexible equity-raising mechanisms for infrastructure capex funding.
- September 2025: BBVA, a global financial services group, renewed its technology services agreement with Kyndryl, an enterprise technology provider, establishing joint ventures in Spain and Mexico. This partnership enhances IT operations, integrates AI for operational efficiency, and ensures compliance with regulatory standards and market trends.
- May 2025: Capital One finalized its USD 35.3 billion acquisition of Discover, demonstrating regulatory approval for strategic consolidation within the consumer finance market, which involves the integration of financial services platforms to enhance operational efficiency and expand market presence.


Research Methodology Framework and Report Scope
Market Definitions and Key Coverage
Mordor Intelligence defines the investment banking market as the revenue earned from advisory and capital-raising services, namely mergers and acquisitions, equity capital markets, debt capital markets, and syndicated lending, delivered by registered investment banks to corporate, institutional, and sovereign clients worldwide. Figures exclude proprietary trading, asset management, retail brokerage, and private-banking income.
Scope Exclusion: Trading desks' buy-side execution revenue and clearing fees lie outside this study.
Segmentation Overview
- By Product Type
- Mergers & Acquisitions
- Debt Capital Markets
- Equity Capital Markets
- Syndicated Loans & Others
- By Deal Size
- Mega-cap (More than USD 5 billion)
- Large-cap (USD 1-5 billion)
- Mid-market (USD 250 million-1 billion)
- Small-cap (Less than USD 250 million)
- By Client Type
- Large Enterprises
- Small and Medium-sized Enterprises (SMEs)
- By Industry Vertical
- Banking, Financial Services, Insurance (BFSI)
- IT & Telecommunication
- Manufacturing
- Retail And E-Commerce
- Public Sector
- Healthcare And Pharmaceuticals
- Other Industry Verticals
- By Region
- North America
- United States
- Canada
- Mexico
- South America
- Brazil
- Argentina
- Chile
- Peru
- Rest of South America
- Europe
- United Kingdom
- Germany
- France
- Spain
- Italy
- Benelux (Belgium, Netherlands, and Luxembourg)
- Nordics (Sweden, Norway, Denmark, Finland, and Iceland)
- Rest of Europe
- Asia-Pacific
- China
- India
- Japan
- South Korea
- Australia
- South-East Asia (Singapore, Indonesia, Malaysia, Thailand, Vietnam, and Philippines)
- Rest of Asia-Pacific
- Middle East and Africa
- United Arab Emirates
- Saudi Arabia
- South Africa
- Nigeria
- Rest of Middle East and Africa
- North America
Detailed Research Methodology and Data Validation
Primary Research
We interview senior dealmakers, syndicate desk leads, and CFOs across North America, Europe, Asia-Pacific, and the Gulf to probe pipeline strength, fee spreads, and post-Basel capital allocation. Structured questionnaires and follow-up calls let us verify secondary findings, fill data gaps, and stress-test early model outputs.
Desk Research
Our analysts start with publicly available tier-one sources such as the US Securities and Exchange Commission filings, Financial Conduct Authority disclosures, Dealogic and Refinitiv league-table datasets, Organisation for Economic Co-operation and Development bond issuance statistics, and the International Monetary Fund's Financial Soundness Indicators. Macroeconomic context is strengthened through central-bank rate releases and Bank for International Settlements debt-service ratios. Company presentations, reputable financial press, and academic journals on Basel III capital buffers round out foundational inputs. Select paid platforms, including D&B Hoovers for bank financials and Dow Jones Factiva for deal news, supply timely validation. This list is illustrative; many additional sources inform our desk work.
Market-Sizing & Forecasting
A top-down reconstruction of historical fee pools uses disclosed global issuance volumes multiplied by sampled average fee percentages for M&A, ECM, DCM, and loans. We then reconcile totals with selective bottom-up checks, such as rolling up the ten largest banks' advisory revenues, to fine-tune anomalies. Key variables driving the model include announced-to-completed deal ratios, cross-border M&A share, high-yield issuance spreads, private-equity dry-powder levels, and Basel III "Endgame" risk-weighted asset inflation. Forecasts run through a multivariate regression that links these drivers to fee growth before scenario analysis adjusts for macro shocks. Where disclosure gaps appear, weighted regional proxies are applied and later overwritten once firmer data emerge.
Data Validation & Update Cycle
Outputs undergo multi-stage variance checks, analyst peer reviews, and outlier flagging against SIFMA fee trackers. Our team revisits sources quarterly; full models refresh annually or sooner if material events, such as rate shocks or policy shifts, move the market.
Why Mordor's Investment Banking Baseline Earns Trust
Published estimates often diverge because firms adopt dissimilar scopes, currencies, and refresh cadences. Mordor's disciplined segmentation, driver-based forecasting, and yearly updates anchor a figure that decision-makers can rely on.
Benchmark comparison
| Market Size | Anonymized source | Primary gap driver |
|---|---|---|
| USD 112.47 B (2025) | Mordor Intelligence | - |
| USD 424.07 B (2025) | Global Consultancy A | Includes trading services and brokerage flows, uses revenue recognition rather than fee generation, relies on top-down only |
| USD 150.49 B (2025) | Trade Journal B | Excludes syndicated lending, applies single global growth rate, refreshes every four years |
Other publishers swing higher when they merge trading income or lower when they strip out loan-related fees. By isolating pure advisory and capital-raising revenues and validating each input with market fingerprints, Mordor delivers a balanced, transparent baseline that is repeatable for clients and auditors alike.


Key Questions Answered in the Report
What is the current size and growth outlook for the Investment Banking market?
The Investment Banking market size is expected to increase from USD 112.01 billion in 2025 to USD 117.22 billion in 2026 and reach USD 147.15 billion by 2031, at a 4.65% CAGR over 2026-2031.
Which products and client types are leading and growing fastest in the Investment Banking market?
M&A led with 38.35% share in 2025, while ECM is projected to grow at 5.54% CAGR; large enterprises held 74.05% share, and SMEs are projected to grow at 7.12% CAGR to 2031.
Which regions are most important for Investment Banking market activity through 2031?
North America held a 52.10% share in 2025, while Asia-Pacific is projected to be the fastest-growing region with a 6.37% CAGR, supported by strong IPO pipelines and regional capital flows.
What are the main drivers and constraints shaping Investment Banking market conditions in 2026?
A reopened IPO window, a large refinancing cycle, and cross-border carve-outs are positive drivers, while capital requirements under Basel III Endgame and tighter national security reviews create headwinds that elongate timelines and constrain balance sheets.
How is T+1 settlement affecting cross-border equity issuance in the Investment Banking market?
T+1 has compressed post-trade processing and foreign-exchange funding windows, which elevates the need for earlier allocations and confirmations and tighter operations for global offerings.
What capabilities are helping banks win higher-value mandates in the Investment Banking market?
Integrated advisory, ECM, DCM, and risk solutions, combined with regulatory strategy and faster front-to-back workflows, raise win rates on complex, multi-track transactions that concentrate fee pools.
Page last updated on:


