
Home Appliances Market Analysis by Mordor Intelligence
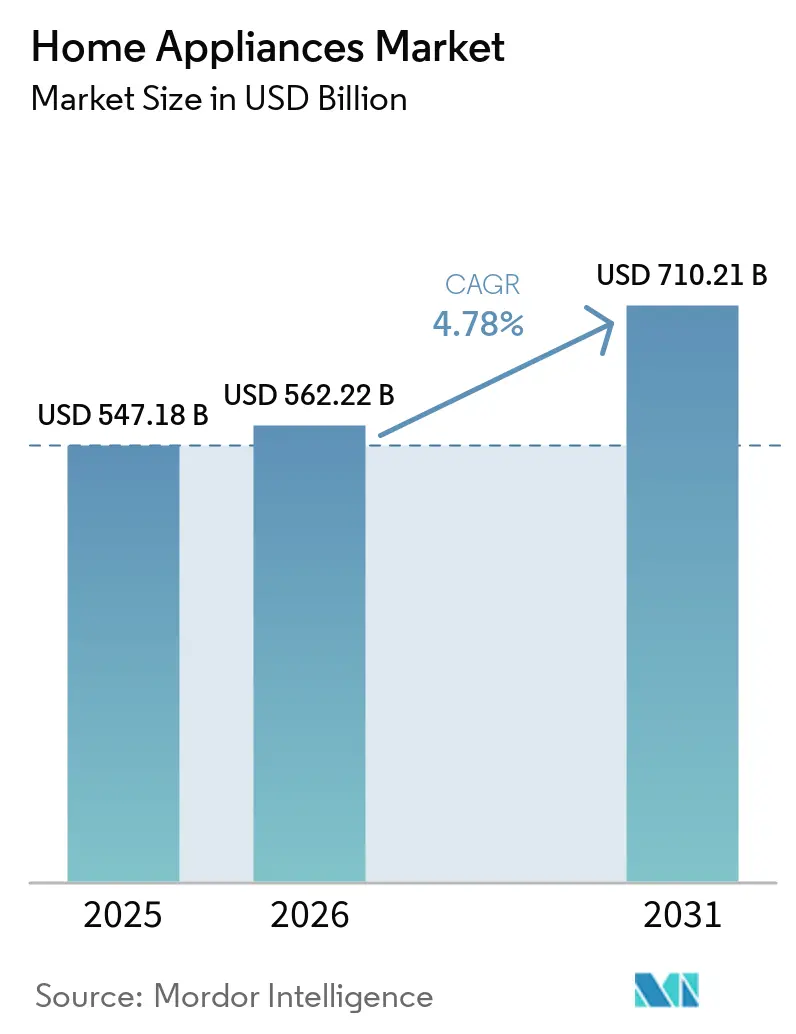
The home appliances market size is expected to increase from USD 562.2 billion in 2026 to USD 589.1 billion in 2027 and reach USD 734.8 billion by 2032, growing at a CAGR of 4.52% over 2027-2032.
Rising purchasing power in China and a larger connected-appliance base support replacement offers combining efficiency with convenience. Online retail expands customer access, but households need a compelling reason to accept the initial payment. Refrigerators and laundry appliances bring design requirements and affordability into the same decision. Higher metal, energy and logistics costs narrow manufacturers’ room to absorb a premium while renewing products and expanding distribution. The entry price of an efficiency-led replacement limits how far rising purchasing power and connectivity can translate into appliance demand.
Key Report Takeaways
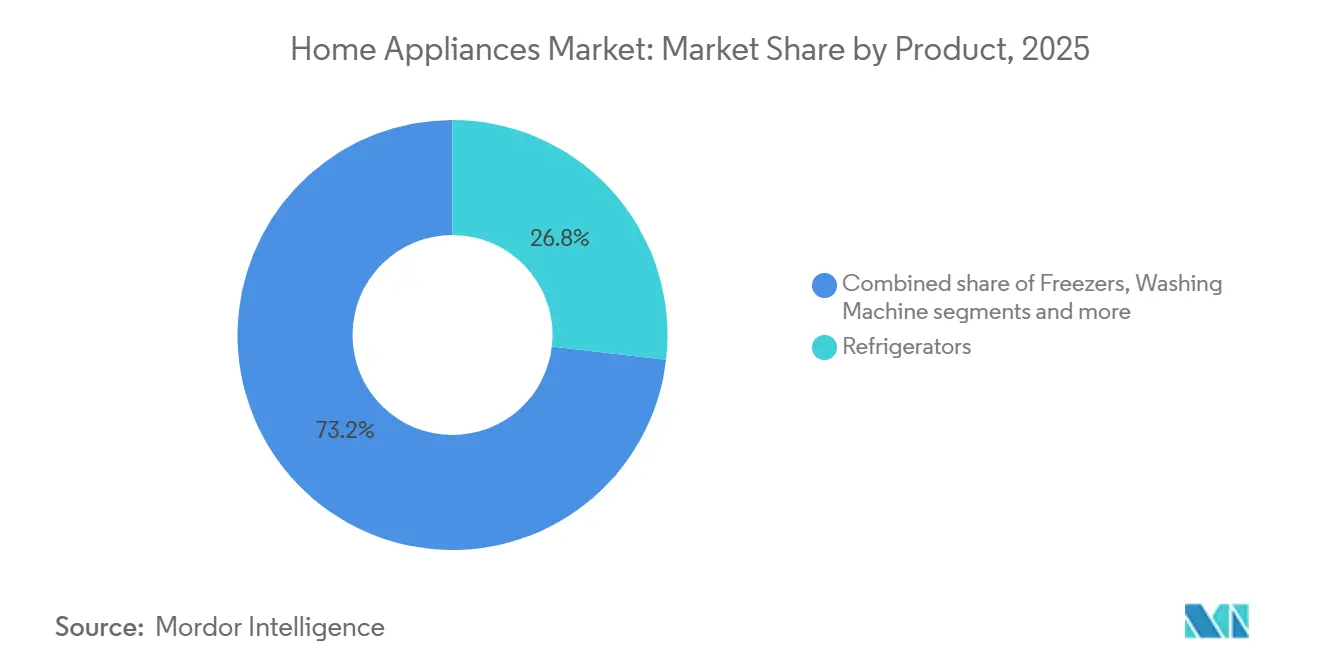
- By product, major home appliances held a 72.55% home appliances market share in 2026, while small home appliances are the fastest-growing segment at a forecast CAGR of 6.25% over 2027-2032.
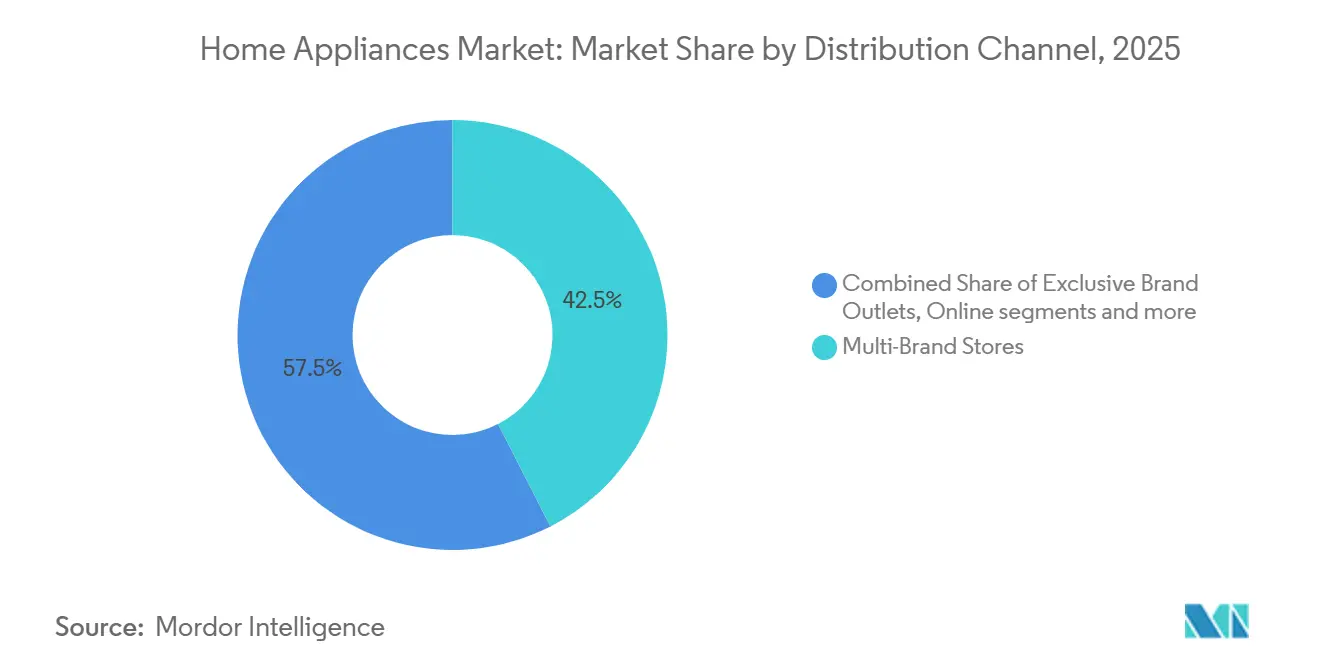
- Multi-brand stores led distribution with a 42.21% share of the home appliances market size in 2026, and online is the fastest-growing segment at a forecast CAGR of 6% over 2027-2032.
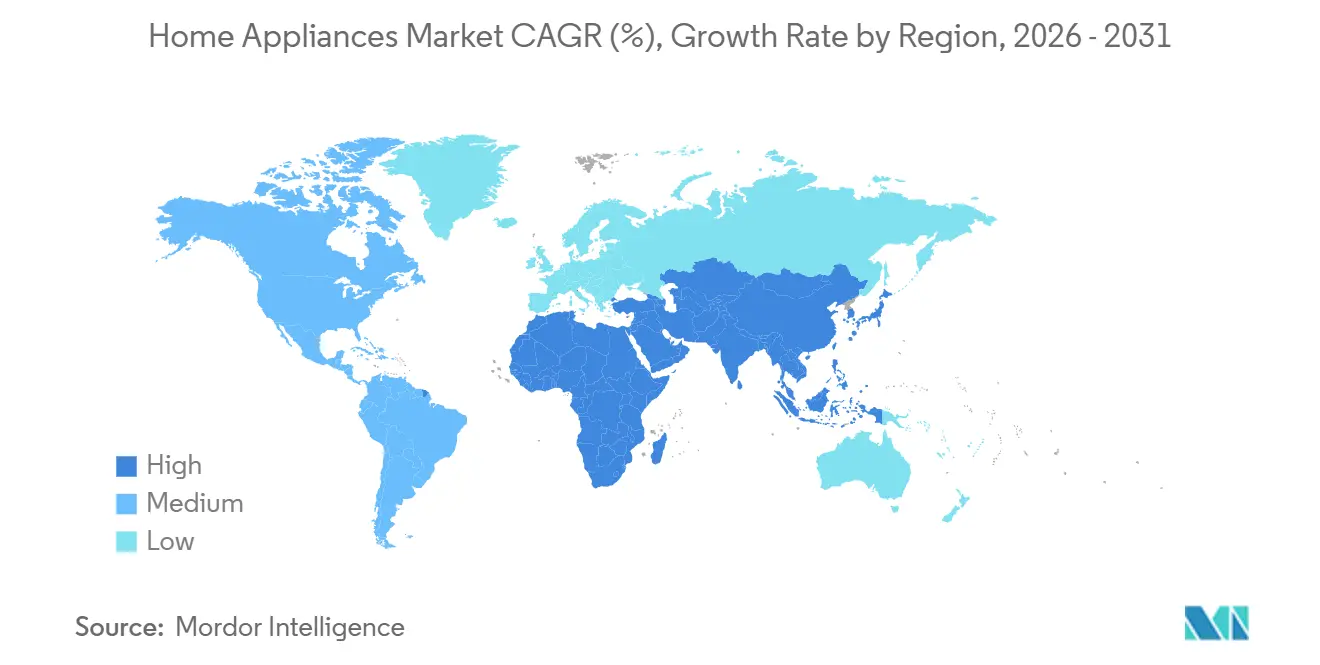
- Across geographies, Aisa-Pacific accounted for 48.71% of the market in 2026, while the Middle East and Africa is the fastest-growing geography at a forecast CAGR of 7.9% over 2027-2032.
Note: Market numbers in this report are based on Mordor Intelligence's proprietary estimation framework, which combines nine months of actuals with Q4 projections for base year 2026.
Market Trends and Insights
Drivers Impact Analysis of Home Appliances Market*
| Driver | (~) % Impact on CAGR Forecast | Geographic Relevance | Impact Timeline |
|---|---|---|---|
| Rising Disposable Income and Consumer Spending Power | +1.6% | Urban and rural China | Medium term (2-4 years) |
| IoT-Enabled Convenience & Home Automation Boom | +1.4% | North America, Europe, and Aisa-Pacific | Medium term (2-4 years) |
| Stricter Energy-Efficiency Mandates Spurring Replacement Demand | +1.3% | Urban and rural China | Short term (≤ 2 years) |
| Growth of E-Commerce and Online Sales Channels | +1.1% | Japan and the United Kingdom | Medium term (2-4 years) |
| Urbanization and Changing Lifestyles | +0.9% | India, Nigeria, Pakistan, Egypt, Bangladesh, and Ethiopia | Long term (≥ 4 years) |
| Premiumization and demand for feature-rich appliances | +0.6% | Urban and rural China | Medium term (2-4 years) |
| Source: Mordor Intelligence | |||
Rising Disposable Income and Consumer Spending Power
Higher real income gives households more room to consider appliance functionality beyond the minimum needed for replacement. China’s nationwide per-capita disposable income rose 5% in real terms in 2025.[1] Real per-capita disposable income increased 6% for rural residents and 4.2% for urban residents in China in 2025. For appliance suppliers, gains in both populations widen the potential audience for upgraded replacements, although higher average income does not make a higher price attainable for every household. Nationwide per-capita household facilities, articles and services spending grew 7.7% nominally in 2025 versus 4.4% for total consumption expenditure, so Chinese households allocated a larger proportion of spending to that broad category.
IoT-Enabled Convenience & Home Automation Boom
An established connected-appliance base gives manufacturers a broader setting in which to sell the next household device. Samsung Electronics reported 33 million home appliances connected to SmartThings globally in November 2025, about 30% more than at the beginning of 2025.[2] A supplier can build its replacement proposition around participation in the same home-automation environment, making connectivity relevant to an additional purchase. Because the count covers appliances connected to Samsung’s own SmartThings platform, the installed base is a Samsung-specific lever for selling the next appliance rather than an industry-wide measure.
Stricter Energy-Efficiency Mandates Spurring Replacement Demand
Efficiency policy can influence both the appliances suppliers offer and the models households select when replacing equipment. China’s mandatory household refrigerator standard GB 12021.2-2025 took effect on June 1, 2026, replacing GB 12021.2-2015. China’s 2025 trade-in program offered 15% subsidies for eligible level-2-or-higher energy- or water-efficiency refrigerators and washing machines, plus 5% for level-1-or-higher products, subject to per-consumer and per-item caps. The additional incentive made the efficiency tier relevant to the purchase price as well as to appliance operation. Suppliers could therefore position qualifying replacements around both technical performance and the subsidized household payment. The demand opportunity lies in joining compliant design with a price proposition that makes the efficiency upgrade attainable.
Growth of E-Commerce and Online Sales Channels
Growth in online purchasing creates a larger customer-acquisition opportunity for appliance retailers. Japanese households with 2 or more people increased nominal average monthly online spending on home appliances and furniture by 8.1% in 2025. AO World’s UK B2C Retail business gained over 720,000 new customers in the fiscal year ended March 31, 2026. That business sells major domestic appliances and other product categories primarily through ao.com and selected third-party marketplaces. Japan’s higher spending per household and AO’s customer additions point to separate sources of online expansion, one from deeper spending and the other from wider buyer reach.
Restraints Impact Analysis of Home Appliances Market*
| Restraint | (~) % Impact on CAGR Forecast | Geographic Relevance | Impact Timeline |
|---|---|---|---|
| Commodity & Freight-Cost Volatility Compressing Margins | -0.9% | Urban and rural India | Short term (≤ 2 years) |
| High Initial Costs Of Smart And Energy-Efficient Appliances | -0.8% | Urban and rural New Zealand | Medium term (2-4 years) |
| Chip-Set Supply Bottlenecks Disrupting Production | -0.3% | Urban and rural China | Short term (≤ 2 years) |
| Intense price competition and product commoditization | -0.4% | Latin America, especially Brazil | Medium term (2-4 years) |
| Source: Mordor Intelligence | |||
Commodity & Freight-Cost Volatility Compressing Margins
Input-cost increases force appliance producers to choose how much pressure to absorb before seeking higher selling prices. LG Electronics India reported in September 2026 that copper, resin, steel and aluminum costs had risen 34%, 17%, 24% and 16%, respectively. It also identified higher logistics and energy costs and adverse foreign-exchange movements. Together, these pressures can weaken the economics of maintaining an unchanged appliance price, even before a supplier considers additional product features. The company announced a 5% to 7% increase for air conditioners and home appliances, with an October 1, 2026 effective date. Passing costs onward may protect unit economics, but it leaves manufacturers confronting a more expensive offer to the household.
High Initial Costs Of Smart And Energy-Efficient Appliances
A lower running cost does not necessarily make a higher appliance purchase price acceptable to households. New Zealand’s Energy Efficiency and Conservation Authority (EECA) found that fewer than half, 46%, of 3,085 FY2025 survey respondents in New Zealand would typically pay more upfront for a more efficient large household appliance such as a washing machine or dishwasher with lower running costs.[3] Most surveyed buyers therefore did not make that trade-off, which limits suppliers’ ability to recover the cost of efficiency through the initial selling price. The household must accept the larger payment before receiving the subsequent operating benefit, so lifetime value alone may not resolve affordability.
*Our forecasts treat driver/restraint impacts as directional, not additive. The impact forecasts reflect baseline growth, mix effects, and variable interactions.
Home Appliances Market Segment Analysis
By Product:
Fulfillment Scale and Specialized Uses Support DemandMajor home appliances accounted for a 72.55% share of the home appliances market size in 2026, making them the largest segment. Haier Smart Home reported double-digit revenue growth in its domestic air-conditioning business in China in 2025. At the end of 2025, its RRS Logistics operation delivered 100,000 units to users daily in China. Its 24-hour delivery service covered 1,944 districts and counties, and its integrated delivery-and-installation rate reached 97%. For Haier, reach extends to putting the appliance into use, so delivery and setup form part of the service a buyer receives with the equipment.
Small home appliances are the fastest-growing segment, with a forecast CAGR of 6.25% over 2027-2032. SharkNinja reported consolidated Cooking and Beverage Appliances net sales of USD 913.6 million in the six months ended June 30, 2026, compared with USD 711.7 million in the same period of 2025. Its consolidated Food Preparation Appliances net sales rose from USD 702.2 million to USD 746.1 million over the same comparable six-month periods. Cooking and beverage appliances started from a revenue base similar to food preparation but generated a much larger sales increase, showing different expansion opportunities within this producer’s kitchen-appliance business.

By Distribution Channel:
Retail Scale and Digital Reach Shape AccessMulti-brand stores represented a 42.21% home appliances market share in 2026, making them the largest segment. Lowe’s recorded USD 12.89 billion in appliance sales in fiscal 2025, ended January 30, 2026. That category represented 14.9% of Lowe’s own sales. At that scale, a manufacturer supplying Lowe’s serves an account with its own category economics. Winning in this channel can depend on serving a retailer’s appliance business at scale as well as on the appeal of an individual model.
Online is the fastest-growing segment, with a forecast CAGR of 6% over 2027-2032. In mainland China, Midea Group’s e-commerce sales, including lower-tier market penetration, exceeded 55% of its domestic Smart Home Solutions sales revenue in 2025. For Midea, e-commerce is the majority of domestic Smart Home Solutions revenue, so digital distribution is its core channel rather than an addition to a store-led offer. Exclusive brand outlets provide a different route, and LG Electronics India reported 788 third-party franchise stores selling LG consumer-electronics and home-appliance products exclusively in FY2026. The contrast is between digitally mediated reach and a single-brand physical presence, allowing manufacturers to choose how much of the customer relationship to organize around their own brand.
Geography Analysis
Aisa-Pacific Home Appliances Market
Aisa-Pacific accounted for a 48.71% share of the home appliances market size in 2026, making it the largest geography. China’s consumer-goods trade-in program recorded purchases of over 129 million home appliances across 12 categories in 2025. This scale makes policy-linked demand significant for appliance suppliers because a single national program can aggregate many household purchase decisions within a defined sales channel. Serving that demand requires an offer suited to the program’s appliance categories, so policy coverage can shape which parts of a manufacturer’s portfolio have the clearest route to buyers.
Middle East And Africa Home Appliances Market
The Middle East and Africa is the fastest-growing geography, with a forecast CAGR of 7.9% over 2027-2032. LG Electronics projected year-over-year growth in aggregate refrigerator and washing-machine demand by amount in the Middle East and Africa for 2026, independently of its own sales forecasts. Vanward began local production of water-heater components and parts in Egypt through the first phase of its factory in January 2026. Vanward’s second phase, at groundbreaking in October 2026, targets expanded component production and complete water-heater assembly. For suppliers, the opening spans projected refrigerator and laundry demand and the development of water-heater assembly capacity from an operating component base.
North America has a substantial domestic-production example in Whirlpool, which reported that approximately 80% of its major appliances sold in the United States in 2025 came from American factories. In South America, Brazil’s energy research agency EPE (Empresa de Pesquisa Energética) reported that lower unemployment, higher income and continued income-transfer policies favored appliance acquisition and more intensive use in 2025. APPLiA reported that European sales ended 2025 at roughly 170 million units, returning volumes to 2015 levels, while the share of appliances made in Europe for European consumers fell from over 80% to 71%. Whirlpool’s domestic supply position for its U.S. sales contrasts with Europe’s falling locally made share, while Brazil’s household finances support acquisition and use. The expansion decision differs across these examples, requiring a factory-supply assessment in North America, household-demand positioning in South America and a volume-recovery case in Europe.
Regulatory Framework and Outlook
This comparison of selected jurisdictions assesses policy attractiveness for manufacturers placing energy-efficient household appliances on the market. Amended refrigerator and freezer standards in the United States took effect May 16, 2024, with compliance due January 31, 2029, or January 31, 2030, depending on product class. In July 2026, the Department of Energy proposed a change to the process used to set appliance standards. DOE’s docket listed the proposal as not finalized in October 2026, so the adopted refrigerator and freezer deadlines stand.
Regulatory Table of Home Appliances Market
| Decision factor | United States | United Kingdom | China | Brazil | Saudi Arabia |
|---|---|---|---|---|---|
| Primary authority | U.S. Department of Energy | Office for Product Safety and Standards (OPSS) | State Administration for Market Regulation and Standardization Administration of China | INMETRO | Saudi Standards, Metrology and Quality Organization |
| Key instruments or direction | 10 CFR 430.32(a), consumer refrigerator and freezer standards | Ecodesign for Energy Related Products Regulations 2010 and Energy Information Regulations 2011; proposed Great Britain standby updates | GB 21456-2024 kitchen-appliance efficiency limits and grades, effective September 1, 2025 | Brazilian Labeling Program and National Energy Conservation Label product tables | SASO 2892 refrigerator and freezer energy-label licensing |
| Commercial effect | Meet current product standards and phase in adopted amendments | Enforcement exposure under applicable product measures | Efficiency qualification for covered kitchen appliances | Product classification and approved-label visibility | Product-specific energy-label licensing |
| Current policy attractiveness | Medium | Medium | Medium | Medium | Medium |
| Future direction of policy attractiveness | Easing | Hardening | No change | No change | No change |
| Source: Mordor Intelligence | |||||
The United States’ Medium rating reflects the adopted refrigerator and freezer duties, while the Easing direction reflects DOE’s pending July 2026 proposal to change the Process Rule that governs how appliance standards are set. The United Kingdom’s Medium assessment turns toward Hardening because a Great Britain consultation opened October 16, 2026, on proposed standby-efficiency updates for household and office equipment, with comments due December 24, 2026. China’s operative kitchen-appliance standard supports Medium attractiveness with continuity, as do Brazil’s published classifications and planned 2026-2027 consolidation without technical or safety changes. Saudi Arabia’s licensing supports a Medium assessment, with SASO’s September 21, 2026, workshop introducing SASO 2892:2025 refrigerator and freezer requirements scheduled for mandatory application at customs ports and local factories on November 21, 2027, according to Al-Baha Chamber.
Value Chain Stages
The value chain compares component supply, appliance manufacturing, and retail fulfillment as distinct sources of supplier earnings. Texas Instruments introduced the F28E120SC and F28E120SB microcontrollers for appliance motor-control and power-factor-correction systems in September 2025. Whirlpool manufactures kitchen and laundry appliances and reported approximately USD 16 billion in global sales in 2025, close to 90% in the Americas. Component vendors capture value through hardware sales, while manufacturers and retailers recover different portions of the finished product’s selling price.
Value Chain Analysis Table of Home Appliances Market
| Primary activity | Key participants | Value capture | Bottleneck | Resilience response |
|---|---|---|---|---|
| Appliance control components | Microcontroller suppliers such as Texas Instruments | Microcontroller sales | Design-specific component qualification | Qualify alternative controls before production changes |
| Appliance manufacturing | Kitchen and laundry appliance producers such as Whirlpool Corporation | Finished-appliance sales | Production ramp costs and quality consistency | Stage production ramps and validate process changes |
| Retail and fulfillment coordination | Multibrand retailers such as Lowe’s | Retail sales | Aligning delivery and installation capacity with orders | Link fulfillment promises to provider availability |
| Source: Mordor Intelligence | ||||
In fiscal 2025, Lowe’s provided installation through independent installers or third-party providers across its home-improvement business. That arrangement can broaden service reach, but it also means the retailer must align its sales promise with execution by other businesses. Capacity at the installer handoff can therefore become a separate limit on completing an appliance transaction, even when the product is ready for delivery.
Competitive Landscape
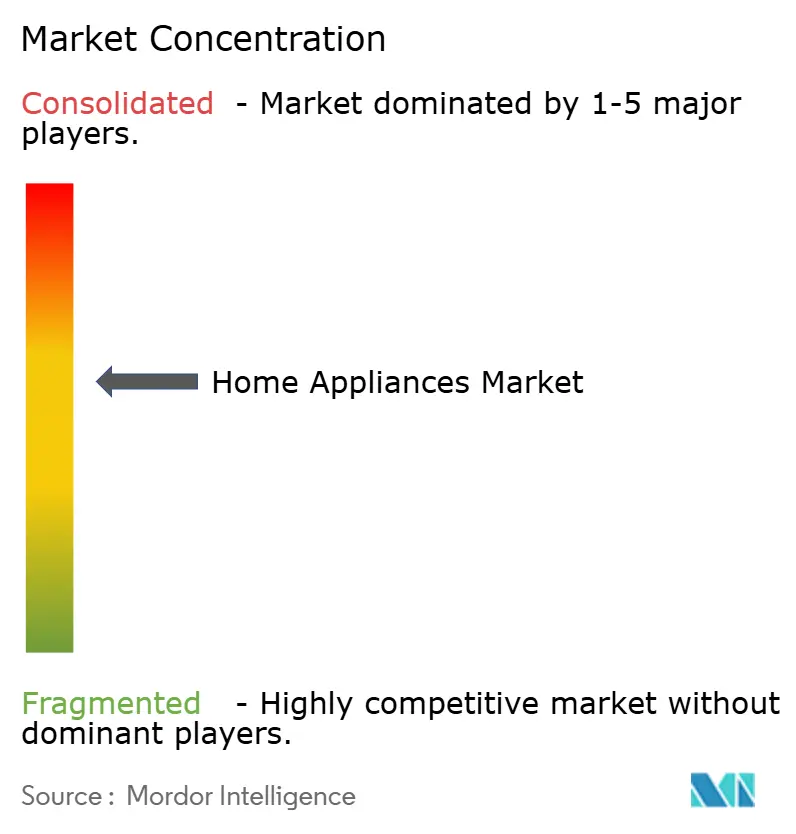
Established appliance groups give the industry a strong incumbent presence, with Whirlpool Corporation, Haier, LG Electronics, Samsung Electronics and Midea Group among its leaders. LG Electronics’ Home Appliance Solution Company reported its highest-ever revenue in 2025. Haier Smart Home ranked first globally in major home appliance brand retail volume for 17 consecutive years through 2025, according to Euromonitor International. Midea Group reported that Midea-brand smart-appliance sales volume ranked first worldwide among own-brand manufacturers in 2025, also citing Euromonitor. Haier’s ranking rests on major-appliance brand retail volume and Midea’s on smart-appliance volume among own-brand manufacturers, so no single leader’s ranking covers the full range of home appliances.
Product renewal and channel position offer distinct ways to defend that scale. Whirlpool Corporation attributed strong North American major-appliance share gains in the second half of 2025 to its largest product refresh in over a decade. Midea Group reported that its appliance sales value ranked first on China’s major online platforms and in major offline channels in the first half of 2026. Because Midea’s ranking covers China and Whirlpool’s gains cover North America, a challenger in either region meets a different incumbent advantage, channel reach in China and a refreshed product line in North America.
Earnings discipline will shape how far producers can pursue demand through additional features and wider distribution. Samsung Electronics reported Digital Appliances revenue growth from increased air-conditioner demand in the second quarter of 2026, despite cost pressures weighing on earnings. This contrast makes profitable product differentiation more significant than revenue expansion by itself, especially for a challenger with less room to absorb added costs. In China, the Grade 1 daily energy-use requirement for an illustrative 500-liter side-by-side, 2-door refrigerator fell from 0.92 to 0.55 kWh under the standard effective June 1, 2026. The standard’s registry record lists Haier-, Midea- and Samsung-linked entities, including Qingdao Haier Refrigerator and Hefei Midea Refrigerator, among its main drafting units, so the threshold challengers must meet was drafted with participation from entities linked to 3 of the 5 leaders.
Home Appliances Industry Leaders
-
Whirlpool Corporation
-
Haier
-
LG Electronics
-
Samsung Electronics
-
Midea Group
- *Disclaimer: Major Players sorted in no particular order
Home Appliances Market Companies Covered in this Report
- Haier
- Whirlpool Corporation
- Samsung Electronics
- LG Electronics
- BSH Hausgeräte
- Midea Group
- Electrolux AB
- Panasonic Corporation
- Versuni
- GE Appliances
- Hisense
- Arcelik (Beko, Grundig)
- Sharp Corporation
- Gree Electric Appliances
- TCL Electronics
- Sub-Zero Group
- SMEG
- Dyson
- SharkNinja
- Fisher & Paykel
- Miele & Cie. KG
Key Opportunities for Market Participants
The product opportunities compare compliant heat-pump dryers, repairable refrigerating appliances and dryer designs prepared for repairability labeling. EU dryer measures applied from July 1, 2025, to new machines placed on the market, while previously placed retail stock was outside the new measures. From July 31, 2026, EU Member States must ensure manufacturers repair Annex II refrigerating appliances under repairability requirements on consumer request, where possible, for defects arising or becoming apparent outside the seller’s liability period. Those repairs must be free or reasonably priced and completed within a reasonable time after the manufacturer receives or gains access to the appliance.
Market Opportunities Table of Home Appliances Market
| Opportunity | Why now | Buyer / lead segment | Recommended play | Main barrier | Likely beneficiaries |
|---|---|---|---|---|---|
| Compliant heat-pump dryer replacements | Applied EU requirements favor efficient new dryer technologies | EU households replacing tumble dryers | Develop heat-pump models and verify full ecodesign compliance | Engineering and qualification costs | Heat-pump dryer makers such as BSH Hausgeräte through Bosch |
| Refrigerators designed around repair access | Covered refrigerator repair duties apply from July 2026 | EU households selecting refrigerating appliances | Link appliance design to practical repair fulfillment | Sustaining repair capacity at a reasonable price | Refrigerating-appliance makers such as BSH Hausgeräte through Bosch |
| Dryer repairability differentiation | Repairability labels with A to E classes and information sheets apply to dryers placed on the EU market from January 1, 2027 | EU households comparing new tumble dryers | Substantiate repairability alongside energy performance | Proving repairability while meeting energy requirements | Dryer makers such as BSH Hausgeräte through Bosch |
| Source: Mordor Intelligence | |||||
EU suppliers may provide repairability labels and information sheets before January 1, 2027, and dealers may sell dryers placed on the market before that date without the repairability index. That stock distinction makes new-model design and label preparation more immediate than blanket replacement of every retail unit. For refrigerators, integrating repair access into the appliance proposition can align the product offer with the service duty, rather than treating repair as a separate afterthought. The central opening is to make the appliance’s usable life part of the selling proposition while maintaining affordable repair execution.
Recent Industry Developments in Home Appliances Market
- Sep 2026: Samsung India launched its 2026 Bespoke AI appliance lineup in India, connecting categories including climate control, laundry and kitchen through SmartThings.
- Aug 2026: LG Electronics opened a home-appliance factory in Paraná, Brazil, with annual capacity of approximately 600,000 refrigerators and an initial focus on Brazil’s domestic market.
Home Appliances Market Report Scope and Research Methodology
Market Definition and Coverage
The Global Home Appliances Market measures annual retail spending on newly manufactured electrical and gas-powered equipment designed for domestic household tasks worldwide. Value is counted when the appliance is sold to its end user.
Scope exclusions: Audio-visual consumer electronics, including televisions, set-top boxes, and smart speakers, used and refurbished appliances, separately sold appliance parts, repair work and maintenance services, and commercial or professional equipment designed for business operations are excluded.
Segments Covered in This Report
- By Product
- Major Home Appliances
- Refrigerators
- Freezers
- Washing Machines
- Dishwashers
- Ovens (Incl. Combi & Microwave)
- Air Conditioners
- Other Major Home Appliances (range hoods, cooktops, etc.)
- Small Home Appliances
- Coffee Makers
- Food Processors
- Grills and Roasters
- Electric Kettles
- Juicers and Blenders
- Air Fryers
- Vacuum Cleaners
- Other Small Home Appliances (waffle makers, toasters, tea makers, rice cookers, etc.)
- Major Home Appliances
- By Distribution Channel
- Multi-Brand Stores
- Exclusive Brand Outlets
- Online
- Other Distribution Channels
- By Geography
- North America
- Canada
- United States
- Mexico
- South America
- Brazil
- Peru
- Chile
- Argentina
- Rest of South America
- Europe
- United Kingdom
- Germany
- France
- Spain
- Italy
- BENELUX (Belgium, Netherlands, and Luxembourg)
- NORDICS (Denmark, Finland, Iceland, Norway, and Sweden)
- Rest of Europe
- Aisa-Pacific
- India
- China
- Japan
- Australia
- South Korea
- South East Asia (Singapore, Malaysia, Thailand, Indonesia, Vietnam, and Philippines)
- Rest of Asia-Pacific
- Middle East And Africa
- United Arab of Emirates
- Saudi Arabia
- South Africa
- Nigeria
- Rest of Middle East And Africa
- North America
Data Sources, Market Sizing, and Validation
Desk Research
Illustrative public inputs include the World Bank's household consumption survey guidance, which describes durable-goods spending and comparability limits, Eurostat household expenditure by purpose, which provides a regional household-equipment spending context, and European Commission energy-label information, which supports comparisons of appliance energy-use classes and market requirements. U.S. Department of Energy appliance-standards material adds a policy signal for covered product groups and their efficiency requirements.
Company annual reports and 10-K filings, investor materials, public customs and retail statistics, trade-association publications, and reputable press can supplement these indicators with appliance sales, shipment, price, and channel evidence. These named sources are not exhaustive, and further sources inform collection, validation, and clarification.
Primary Interviews and Surveys
Structured interviews and surveys would target appliance manufacturers' product and commercial leaders, regional distributors, multi-brand and brand-specific retailers, and online channel managers across APAC, EMEA, and the Americas. Analysts would use respondents to test secondary-source definitions, replacement timing, category shipment and average-selling-price assumptions, channel mix, and regional demand, then revisit gaps or conflicting signals with relevant respondents and triangulate explanations against independent filings, trade data, and public demand indicators.
Distribution of primary research fieldwork respondents
| Company type | Respondent position | Region |
|---|---|---|
| Top tier: 32% | CXOs: 20% | APAC: 42% |
| Mid tier: 43% | Functional/Unit leaders: 36% | EMEA: 30% |
| Smaller Players: 25% | Managers: 44% | Americas: 28% |
Market-Sizing & Forecasting
After analysts compare household formation and housing activity, real disposable income and durable-goods expenditure, category shipments and average selling prices, online retail penetration, and efficiency rules affecting replacement timing, they estimate global annual value top down and reconcile product, channel, and regional totals to retail spending on newly manufactured domestic appliances sold to end users. Where comparable histories exist, multivariate regression links those indicators to value and segment growth, while scenario analysis handles policy, input-cost, and affordability paths where data are sparse. Selective bottom-up checks multiply sampled category shipments by observed average selling prices and compare supplier or channel roll-ups, with gaps handled through nearby product or regional proxies and sensitivity ranges. Product, channel, and regional shares are built from reported sales and revenue splits, then checked against shipment and price patterns, while interviews with relevant experts would test variable-level forecasts and identify assumptions requiring revision.
Data Validation & Update Cycle
Independent market signals from public statistics, company disclosures, trade data, and channel evidence are triangulated, then material variances between top-down values, sampled shipment-times-price checks, and segment totals are investigated. A second review checks source year, unit, currency, product boundary, duplicate upstream transactions, and regional or channel coverage. Analysts resolve anomalies or re-contact relevant respondents when definitions conflict, a key input changes, or evidence remains inconsistent. The model is refreshed annually, updated between cycles after material policy, supply, or demand events, and reviewed in a fresh pre-delivery pass.
Mordor Intelligence's Global Home Appliances Market Size Versus Other Published Estimates
Published estimates can differ in the transactions and products they count and the inputs used to model demand. The Global Home Appliances Market measures annual retail spending on newly manufactured electrical and gas-powered equipment designed for domestic household tasks worldwide.
Key Gap Drivers include the study's defined coverage and market-specific modeling choices. Product, channel, and regional shares are built from reported sales and revenue splits, then checked against shipment and price patterns, while interviews with relevant experts would test variable-level forecasts and identify assumptions requiring revision.
Benchmark comparison
| Source | Market Size | Gaps in Research Methodology |
|---|---|---|
| Mordor Intelligence | USD 589.1 B (2027) | |
| Global Market Research Firm A | USD 523.6 B (2025) | At its 2025 base, this estimate is 11.1% below this report's 2027 value of USD 589.1 B, 2 years later. Its earlier base year sits on a rising published forecast path, which is consistent with a lower value than the later comparison year. |
| Global Market Research Firm B | USD 520.3 B (2025) | At its 2025 base, this estimate is 11.7% below this report's 2027 value of USD 589.1 B, 2 years later. Its earlier base year and rising forecast path point lower against the later year, while broader end-use and product coverage would push in the opposite direction. |
For Mordor Intelligence, independent market signals from public statistics, company disclosures, trade data, and channel evidence are triangulated, then material variances between top-down values, sampled shipment-times-price checks, and segment totals are investigated.
Key Questions Answered in the Report
What is the Home Appliances market size and growth outlook?
The market is expected to increase from USD 562.2 billion in 2026 to USD 589.1 billion in 2027 and USD 734.8 billion by 2032, at a CAGR of 4.52% over 2027-2032.
What supports demand for household appliances?
Rising income, connected appliances, efficiency incentives and online retail expansion support demand. Samsung Electronics reported 33 million SmartThings-connected home appliances globally in November 2025.
Which appliance product segment leads spending?
Major home appliances held 72.55% of the market in 2026. Small home appliances are forecast to grow fastest at a CAGR of 6.25% over 2027-2032.
Which companies are leading home-appliance producers?
Leading producers include Whirlpool Corporation, Haier, LG Electronics, Samsung Electronics and Midea Group.
What could limit appliance-sector growth?
High initial prices and input-cost pressure can constrain the industry. In EECA’s FY2025 New Zealand survey, fewer than half of 3,085 respondents, 46%, said they would typically pay more upfront for a large household appliance such as a washing machine or dishwasher with greater efficiency and lower running costs.
Which regions lead household-appliance demand and projected growth?
Aisa-Pacific held 48.71% of the market in 2026. The Middle East and Africa is the fastest-growing geography, with a forecast CAGR of 7.9% over 2027-2032.