Market Overview
| Study Period | 2020 - 2031 |
|---|---|
| Forecast Data Period | 2026 - 2031 |
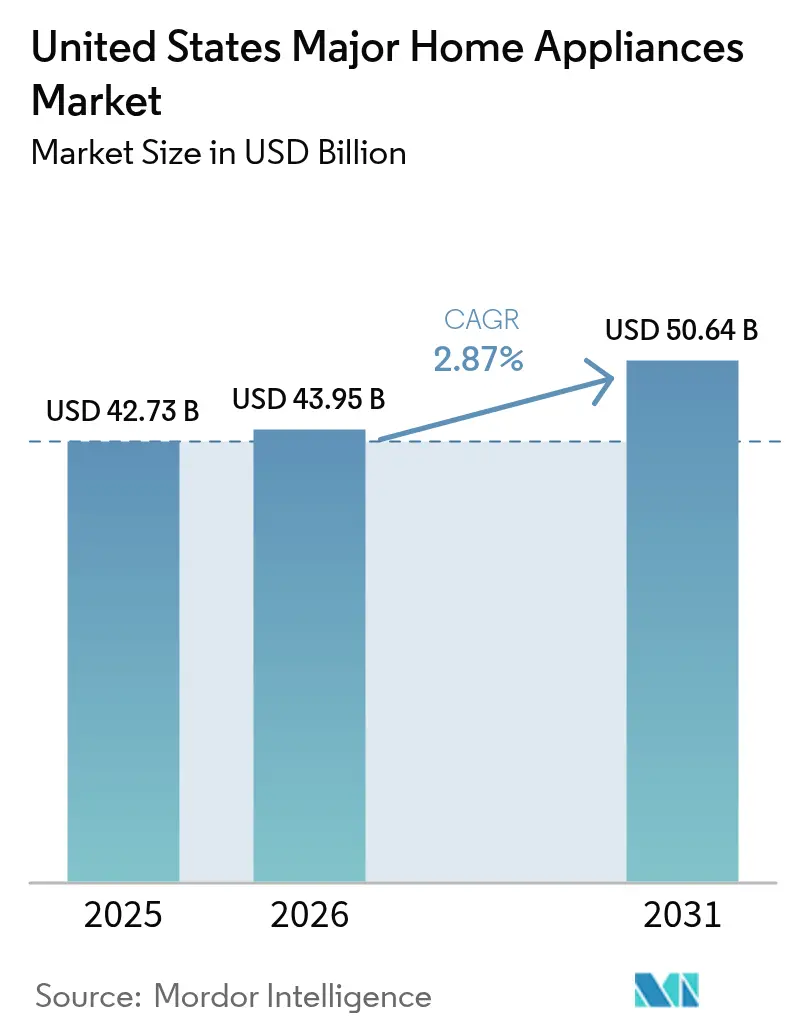
| Base Year Market Size (2025) | USD 42.73 Billion |
| Market Size (2026) | USD 43.95 Billion |
| Market Size (2031) | USD 50.64 Billion |
| Growth Rate (2026 - 2031) | 2.87% CAGR |
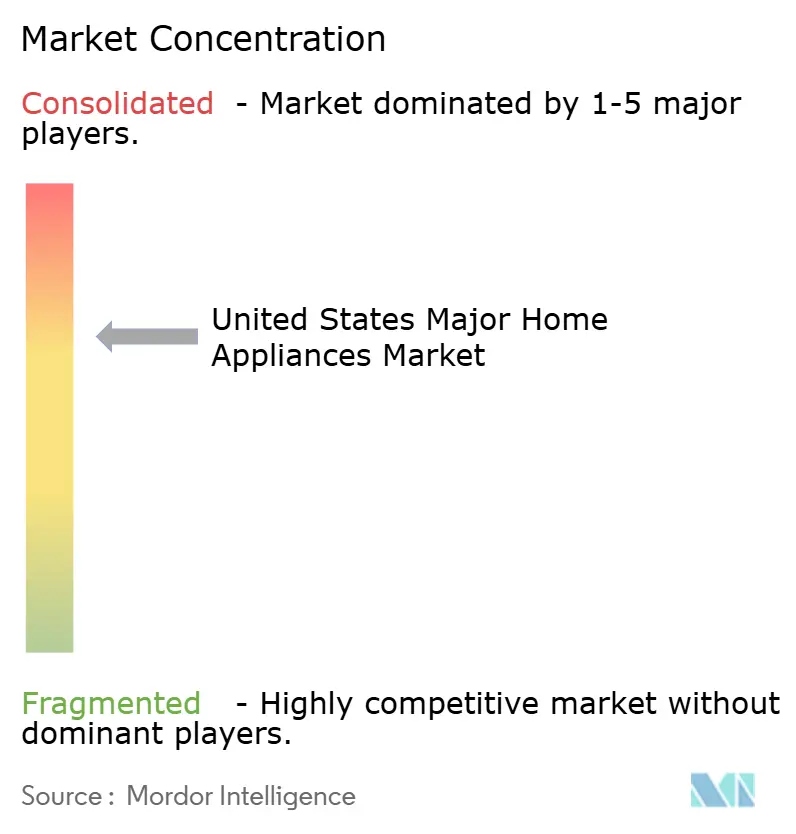
| Market Concentration | Medium |
Major Players *Disclaimer: Major Players sorted in no particular order Image © Mordor Intelligence. Reuse requires attribution under CC BY 4.0. | |
United States Major Home Appliances Market Analysis by Mordor Intelligence
The United States major home appliances market size is USD 42.73 billion in 2025, is projected to reach USD 43.95 billion in 2026, and is expected to reach USD 50.64 billion by 2031 at a 2.87% CAGR. Smart and connected lines are outpacing conventional models due to federal efficiency standards that lower household bills, layered incentives that reduce upfront costs, and utility pilots that reward demand flexibility. Policy uncertainty from the February 2025 suspension of several efficiency rules tempers near-term gains, yet manufacturers that design for connectivity, interoperability, and grid integration continue to capture share in premium and replacement cycles. Smart and connected appliances are growing at more than twice the rate of conventional variants, as federal efficiency standards that saved American consumers USD 105 billion in 2024 alone, representing approximately USD 576 in annual household savings, combine with IRA tax credits of up to USD 3,200 annually[1]The Invading Sea, “Appliance efficiency standards save consumers billions, reduce pollution and fight climate change,” theinvadingsea.com. Mixed housing signals, including slow existing-home turnover, keep value shoppers focused on promotions, while premium buyers consolidate spending on high-feature models. The United States' major home appliances market aligns with the electrification trend, with induction cooking and heat pump platforms driving mid-cycle upgrades in jurisdictions with active rebates and codes.
Key Report Takeaways
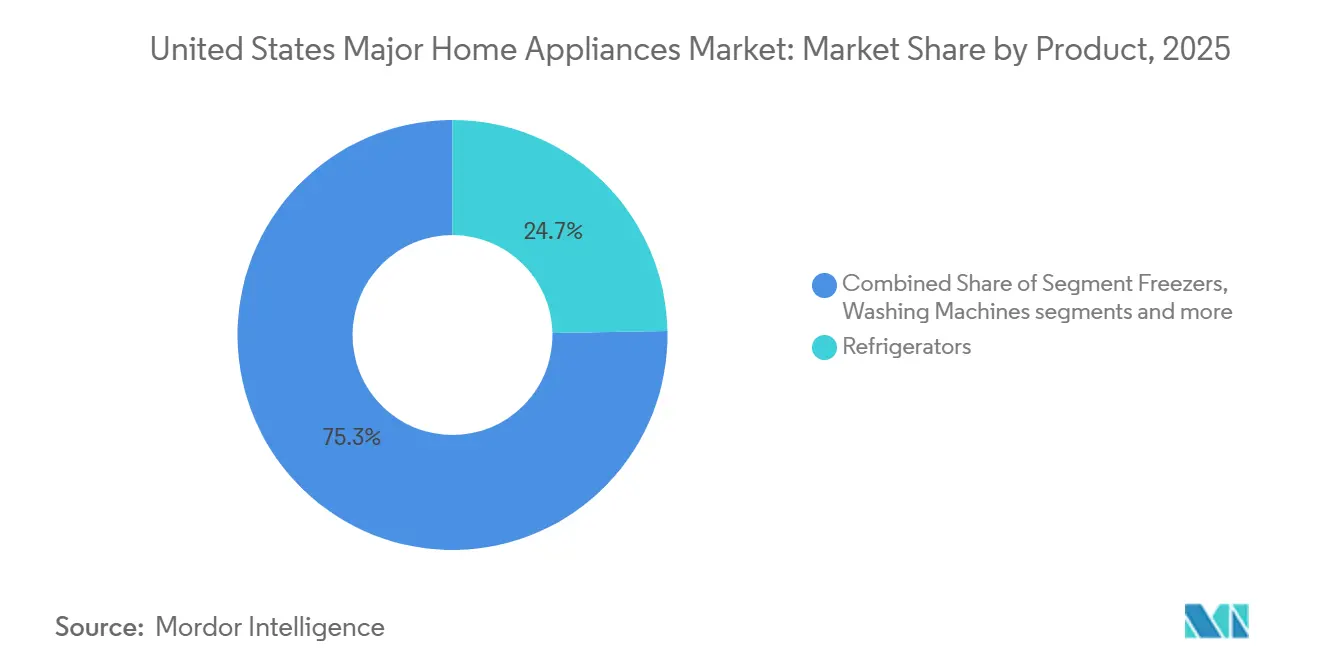
- By product type, refrigerators led with 24.70% of the United States major home appliances market share in 2025, while cooktops and ranges are projected to expand at a 3.62% CAGR through 2031.
- By distribution channel, multi-brand and exclusive brand stores accounted for 44.20% of the United States major home appliances market in 2025, whereas online and e-commerce channels are projected to grow at a 4.58% CAGR through 2031.
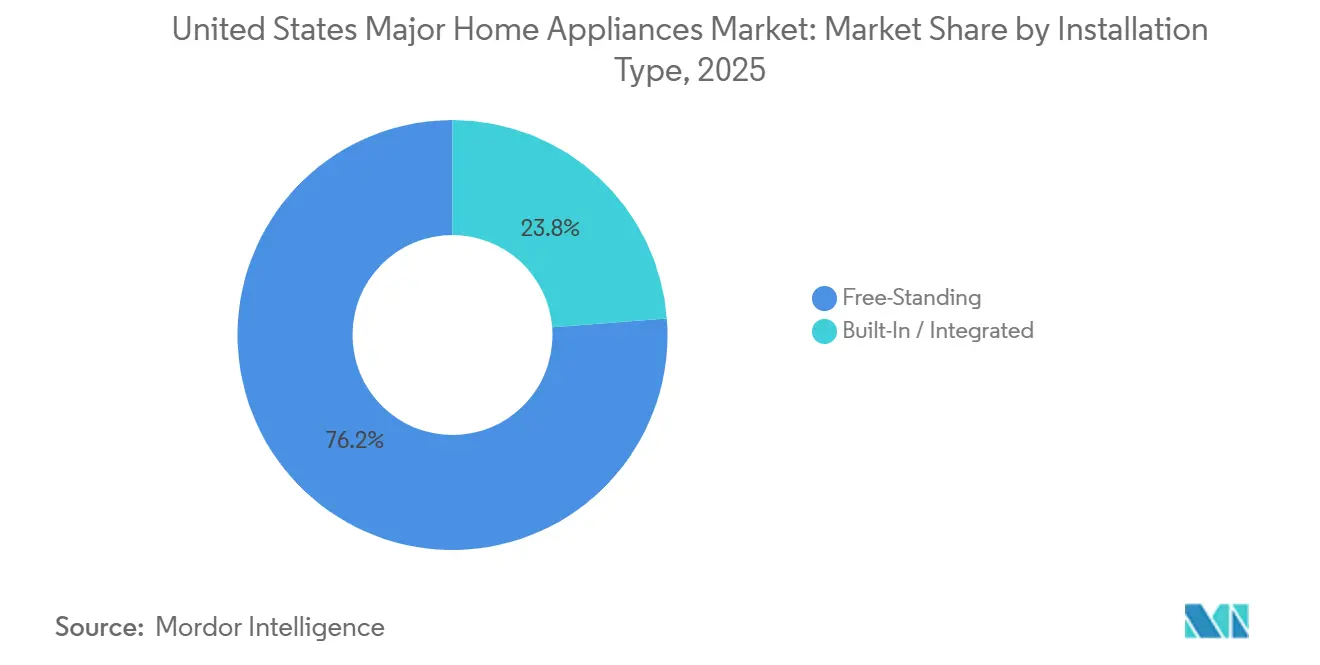
- By installation type, free-standing formats accounted for 76.23% of the United States major home appliances market share in 2025, with a 3.64% CAGR, while built-in formats are gaining traction within active kitchen remodel cohorts and premium residential projects.
- By 2025, conventional appliances accounted for 78.34% of the United States' major home appliances market share, while smart and connected appliances are projected to grow at a 4.92% CAGR through 2031.
- By geography, the Southeast captured 31.40% of the United States' major home appliances market size in 2025, whereas the West is projected to post the fastest CAGR of 3.18% through 2031, supported by electrification mandates and early rebate deployment.
Note: Market size and forecast figures in this report are generated using Mordor Intelligence’s proprietary estimation framework, updated with the latest available data and insights as of 2026.
United States Major Home Appliances Market Trends and Insights
Drivers Impact Analysis*
| Driver | (~) % Impact on CAGR Forecast | Geographic Relevance | Impact Timeline |
|---|---|---|---|
| Efficiency Standards and Incentives Are Accelerating Replacement Cycles | +0.6% | National, with early gains in California, New York, and Massachusetts | Medium term (2-4 years) |
| Subscription-As-a-Service and Predictive Maintenance Are Reducing Time-To-Fail Anxiety | +0.4% | APAC core, spill-over to urban Northeast and West Coast metros | Long term (≥ 4 years) |
| Omnichannel, BOPIS, And Improved Last-Mile Scaling for Large-Appliance E-Commerce | +0.5% | National, concentrated in metropolitan areas with established logistics infrastructure. | Short term (≤ 2 years) |
| Kitchen Remodeling and Premium Built-In Adoption in Mid-To-High Income Households | +0.3% | National, strongest in the Southeast and the West | Medium term (2-4 years) |
| Electrification Rebates and Gas Restrictions Are Shifting Demand to Induction and Heat-Pump Dryers | +0.7% | West and Northeast | Medium term (2-4 years) |
| Utility Demand Response and Time-of-Use Pilots Favoring Grid-Connected Washers, Dishwashers, And Dryers | +0.3% | California, Texas, New York, with pilot expansion to Midwest utilities | Long term (≥ 4 years) |
| Source: Mordor Intelligence | |||
Efficiency Standards and Incentives Propel Replacement Cycles Beyond Traditional Lifespans
Federal appliance efficiency standards drive innovation in product design, pushing manufacturers toward smarter technologies that cut household energy waste. These rules expand coverage over time, ensuring most home devices operate with minimal power draw while maintaining performance. By aligning consumer purchases with sustainability goals, they support national efforts to lower emissions without mandating lifestyle changes. Ultimately, the framework delivers cumulative economic and environmental gains, outweighing any short-term adjustment costs for broader societal benefits [2]U.S. Department of Energy, “Appliance Standards Fact Sheet,” energy.gov. Incentives kept the upgrade path attractive as the Energy Efficient Home Improvement Credit allows up to USD 3,200 per year and pairs with point-of-sale rebates under the Home Electrification and Appliances Rebate program for qualifying households. These programs compress payback periods in high-cost electricity states and nudge households toward efficient heat pumps, advanced heat pump water heaters, and induction ranges. As codes add demand response readiness, manufacturers that integrate secure connectivity and open standards position to capture share from both new construction and deep retrofits within the United States major home appliances market.
Subscription Models and Predictive Diagnostics Reframe Ownership Economics
Manufacturers and retailers are piloting subscription and service bundles that pair hardware with proactive maintenance, software features, and consumables fulfillment. Predictive diagnostics, delivered through connected platforms, help identify component issues and reduce unplanned downtime by alerting users and service networks before failure. These capabilities build stickier relationships across the ownership life cycle and support second-order revenue from parts, accessories, and service extensions. Company ecosystems that support remote monitoring and over-the-air updates aim to extend product relevance without a full hardware refresh. These offerings reinforce premium positioning in the United States major home appliances market, where buyers increasingly equate value with reliability, convenience, and lifecycle cost control[3]ENERGY STAR, “Smart Home Energy Management Systems,” energystar.gov.
E Commerce Infrastructure for Large Appliances Crosses Viability Threshold
Digital’s share in big-ticket durables continues to expand as platforms improve visibility into delivery, installation, and returns. The broader retail baseline also tilts toward e-commerce as a share of total United States retail sales, which has lifted confidence in higher-value online transactions. Amazon's May 2025 partnership with FedEx to handle large and heavy packages directly to residences, announced alongside infrastructure investments in regional distribution centers equipped with appliance-staging areas, removes a critical friction point that previously limited online penetration. Retailers scaling marketplace models expanded their assortments, while mobile apps and AI chat support simplified search, scheduling, and post-purchase tasks. These shifts are redefining merchandising, service, and inventory planning across the United States' major home appliances market.
Kitchen Renovations in Mid to High Income Cohorts Anchor Built-In Appliance Demand
In 2025, homeowners are prioritizing kitchen projects, with a significant portion opting for mid-market and premium remodels. Over half of homeowners are set to undertake kitchen work, often highlighting premium appliances as focal points with at least one standout feature. Built-in appliances are frequently integrated alongside space planning, finish selections, and electrical upgrades, catering to both luxury and move-up market segments. This consistent renovation trend bolsters the United States major home appliances market, even amidst a sluggish housing turnover. Additionally, the growing preference for panel-ready suites and customized designs reflects a shift toward personalized and cohesive kitchen aesthetics. These trends are expected to drive innovation and competition among manufacturers, further shaping the market landscape[4]This Old House, “Kitchen Remodel Trends 2025,” thisoldhouse.com.
Restraints Impact Analysis*
| Restraint | (~) % Impact on CAGR Forecast | Geographic Relevance | Impact Timeline |
|---|---|---|---|
| Excess Retail Inventory Levels Are Leading to Aggressive Discounting and Margin Compression For OEMs | -0.4% | National, with a concentration in multi-brand stores | Short term (≤ 2 years) |
| Housing Turnover and Interest-Rate Sensitivity Are Dampening Big-Ticket Durables | -0.5% | National, pronounced in high-cost metros | Medium term (2-4 years) |
| Tariffs and Component Input Volatility are Raising COGS | -0.6% | National, asymmetric impact on import-reliant brands | Short term (≤ 2 years) |
| Right-to-Repair Obligations are Increasing Parts Inventory and Documentation Costs | -0.2% | California, Colorado, Minnesota, Connecticut, Washington | Medium term (2-4 years) |
| Source: Mordor Intelligence | |||
Inventory Glut and Chinese Competition Drive Margin Compression Across OEMs
Retailers have leaned on promotional intensity to manage elevated inventory levels, compressing margins for both stores and brands. This dynamic coincides with sharper price competition from Chinese manufacturers, which continue to expand their United States portfolios beyond value tiers. OEMs report cost pressure as list‑price changes lag input inflation, and promotions absorb part of tariff‑driven increases. Investments in North American manufacturing and supplier ecosystems have accelerated to mitigate import exposure and shorten lead times. The result is a pricing environment that favors clear value and service differentiation in the United States' major home appliances market.
Housing Market Lock-In Effect Defers Replacement Purchases Beyond Historical Cycles
Lower existing-home turnover has softened some discretionary replacement cycles, particularly for entry- and mid‑tier appliances. Historically, each transaction triggers meaningful spending across major categories, but sluggish sales have reduced this flow. Mortgage rates have retreated from 2023 peaks yet remain above the sub‑4% loans many owners hold, which discourages moves and remodels tied to relocations. Analysts and trade surveys describe a lock‑in effect that postpones upgrades among households that would otherwise transact. This macro backdrop places more weight on incentive‑led retrofits and premium remodels to drive the United States' major home appliances market in 2026.
*Our forecasts treat driver/restraint impacts as directional, not additive. The impact forecasts reflect baseline growth, mix effects, and variable interactions.
Segment Analysis
By Product Type: French Door Refrigerators and Induction Cooking Anchor Premium Adoption
Refrigerators held the largest product‑type share at 24.70% in 2025, supported by French‑door configurations and connected features that help manage food and energy. The United States' major home appliances market continues to showcase premium refrigerator features such as internal cameras that recognize ingredients, inventory tracking, and recipe suggestions. Samsung’s AI Vision Inside recognizes dozens of common items and pairs with a large touchscreen that doubles as a home hub, which appeals to connected households. Efficiency‑minded buyers balance capacity and energy performance, and premium lines concentrate these features for mid‑to‑high income renovators. This mix keeps refrigerators at the center of kitchen packages within the United States major home appliances market.
Electrification incentives and codes favoring induction are propelling cooktops and ranges to become the fastest-growing product group, with a CAGR of 3.62%. DOE’s efficiency standard for gas stoves, effective for new models beginning in 2028, tightens the baseline, while induction’s energy transfer advantages deliver faster heating and cooler kitchens. State and federal rebates lower the cost of upgrading to induction and encourage panel and wiring readiness during remodels. Digital controls and smart‑home integrations increase differentiation in premium ranges and cooktops, which further draws shoppers toward feature‑rich models. This path supports steady share gains for induction systems in the United States' major home appliances market.


By Distribution Channel: Multi-Brand Stores Remain the Core, while Digital Share Keeps Rising
Multi‑brand and exclusive-brand stores remained the largest channel at 44.20% in 2025, as shoppers relied on in‑store consultation, delivery coordination, and installation services. Retailers have sharpened merchandising around kitchen suites and laundry pairs, which improves close rates and basket size. Online platforms have surged in popularity, offering wider product assortments and quicker delivery times. Meanwhile, marketplace models have expanded their SKU offerings while maintaining uniform fulfillment standards. Online and e-commerce platforms are projected to grow at a CAGR of 4.58%. Digital share reached 26% of United States major appliance purchases in Q2 2025, and a rising portion of retailer revenue comes from online orders supported by mobile apps and AI customer service. This hybrid behavior keeps stores central while digital accelerates discovery and conversion in the United States' major home appliances market.
Channel choice is driven by competitive pricing, followed by good product selection, convenient location, and prior store experience. Memorial Day provides discounts on major appliances, coupled with additional savings on higher-value purchases. July 4th features discounts on washers and dryers, with potential savings on matching sets. Labor Day offers discounts on appliances, with added incentives for larger purchases. Notably, during these brief windows, Home Depot and Lowe's manage to sell a significant portion of their annual major appliance volume, all within just a few days of the calendar year.
By Installation Type: Free Standing Leads, Built-In Expands Through Remodels
In 2025, free-standing appliances captured a notable 76.23% of the market share due to their affordability, ease of replacement, and compatibility with standard openings. The free-standing appliances segment is expected to register a CAGR of 3.64% during the forecast period. These appliances cater to both renters and homeowners who seek straightforward, plug-and-play solutions that require no cabinet modifications or panel adjustments. Their lower price points and seamless integration into existing spaces make them an attractive option for consumers prioritizing convenience and cost-effectiveness. This format continues to maintain a stable trajectory, supported by its practicality and widespread appeal in the United States' major home appliances market.
Conversely, built-in and panel-ready appliances are steadily gaining momentum, particularly in premium kitchen remodels. Homeowners undertaking full-scale renovation projects increasingly opt for these appliances to achieve coordinated finishes and a more integrated aesthetic. Remodel budgets in 2025 reflect a growing preference for built-ins, especially for refrigeration, dishwashing, and cooking, as these projects often involve electrical upgrades and layout changes. Additionally, the inclusion of smart features in premium built-ins enhances their appeal, enabling seamless integration into whole-home ecosystems. This trend underscores the rising demand for advanced, high-end solutions within the United States' major home appliances market.
By Technology: Conventional Holds the Majority, Smart Grows Nearly 2x the Market Rate.
In 2025, conventional platforms captured a dominant 78.34% share, driven by buyers' preference for lower upfront costs and straightforward controls. These platforms continue to appeal to cost-conscious consumers who prioritize simplicity and affordability over advanced features. Their widespread adoption reflects the enduring demand for traditional models in the UNITED STATES major home appliances market, where ease of use remains a key purchasing criterion for many households.
Meanwhile, smart and connected formats are emerging as the industry's growth engine, boasting a projected CAGR of 4.92% through 2031. This growth is supported by incentives, advancements in interoperability, and grid-ready features that cater to evolving consumer and utility needs. Leading ecosystems are securing certifications for smart home energy management, thereby enhancing trust and aligning with utility programs. Additionally, connected platforms provide software updates, predictive services, and time-of-use coordination, enabling users in demand response-active areas to lower their bills. This steady adoption trajectory highlights the increasing prominence of connected models in the United States' major home appliances market.
Geography Analysis
The Southeast led with 31.40% of 2025 revenue as single‑family construction and household migration continued to favor Sun Belt metros. Federal programs that support whole‑home electrification bundles are active across the region, and stacked rebates for heat pumps and efficient water heating shorten payback periods. This dynamic benefits package sales tied to new construction and major retrofits, which sustain high throughput for large retailers and builders. As codes and incentives spread, the region’s installed base becomes more receptive to grid‑interactive appliances. This alignment continues to support share leadership for the Southeast in the United States major home appliances market.
The West is projected to post the fastest CAGR of 3.18% through 2031, driven by electrification policies, increased solar adoption, and early deployment of rebates. California’s statewide programs and local initiatives accelerate the adoption of heat pumps and related devices, thereby boosting attach rates for connected appliances with demand‑response features. Induction interest also trends higher in West Coast metros where electric‑ready construction is more common, and efficiency rules are stringent. This policy and infrastructure alignment improve the economics of modern electric appliances and accelerate the adoption of premium features. As a result, the West remains a growth outlier in the United States' major home appliances market.
The Northeast and Midwest display steady replacement demand tied to older housing stock and weather‑driven efficiency priorities. In the Northeast, higher incomes and legacy housing create headroom for premium packages, with utility programs commonly bundling smart thermostats and efficient appliances. The Midwest shows a pragmatic mix of value and durability, with growing participation in demand‑response pilots and rebates for high‑efficiency washers. Across both regions, mortgage rate dynamics and turnover patterns continue to shape discretionary upgrades. These macro and policy elements guide a cautious yet resilient trajectory for the United States' major home appliances market in 2026.
Competitive Landscape
Global and domestic brands are ramping up competition, striving to harmonize hardware innovation with software ecosystems, all while focusing on North American production. GE Appliances unveiled a USD 3 billion investment plan across the region over five years, targeting multiple plants, including a significant new laundry operation. In a bid to bolster regional sourcing, the company also allocated USD 150 million in fresh supplier contracts. Whirlpool, amid challenges posed by tariff fluctuations, dedicated USD 300 million to modernizing its Ohio facilities, emphasizing near-shoring and material resilience. Meanwhile, Samsung, in 2025 and 2026, broadened its AI-driven product lineup, introducing connected washers featuring AI Wash and expansive AI-integrated refrigerators serving as central household hubs. At KBIS 2026, LG seized the opportunity to unveil its design-centric premium lines, harmonizing aesthetics with connectivity to cater to the upscale remodeling trend in the major home appliances arena.
Product strategies pivot on three main axes: efficiency, connectivity, and design. With new standards and rebate systems in play, energy performance has emerged as a pivotal purchase motivator. Consequently, brands are spotlighting ENERGY STAR listings and DR-friendly controls. Software platforms are focusing on interoperability and upgrades, with benchmarks like SHEMS ensuring compatibility for grid-integrated scenarios. In premium kitchens, industrial design and material choices are becoming decisive factors. Here, panel-ready suites and unique finishes are aligning with elevated remodeling budgets. The interplay of these three axes is shaping pricing dynamics and channel trends in the major home appliances sector.
As retailers pivot towards marketplace models, they are amplifying investments in service, delivery, and return experiences. Best Buy's 2026 insights highlighted the profitability of retail media and the robustness of online hardware sales, shaping their product assortment and vendor collaborations. Channels catering to builders and designers are emphasizing reliability, ease of service, and standardized cutouts to mitigate jobsite risks. By near-shoring and nurturing supplier relationships, brands are countering tariff and freight uncertainties. Furthermore, major brands are publicly touting their investments to bolster the built in America narrative. Collectively, these strategies are designed to capture market share and fortify resilience in the major home appliances landscape.
United States Major Home Appliances Industry Leaders
Samsung Electronics
GE Appliances (Haier)
LG Electronics
Whirlpool Corporation
Electrolux Group (Frigidaire)
- *Disclaimer: Major Players sorted in no particular order

Recent Industry Developments
- February 2026: GE Appliances announced its 2026 product lineup, including the GE Profile Smart 4-Door French-Door Refrigerator with Kitchen Assistant and the Monogram 24-inch Premium Fully Integrated Dishwasher with ultra-quiet performance, highlighting innovation in smart kitchen solutions.
- February 2026: LG Electronics announced it will showcase an expanded SKS luxury appliance portfolio at KBIS 2026, featuring its first SKS laundry lineup plus new premium kitchen innovations designed for the United States Market.
- December 2025: Asurion announced a definitive agreement to acquire UK-based appliance care provider Domestic & General, expanding its global appliance protection and repair services in the fast-growing connected home market.
- October 2025: Whirlpool Corporation committed USD 300 million to modernize laundry manufacturing facilities in Ohio, expected to create 400–600 new jobs and strengthen domestic production.


Research Methodology Framework and Report Scope
Market Definitions and Key Coverage
Our study frames the United States major home appliances market as the annual retail and institutional sales value of large, electrically powered domestic machines, including refrigerators, freezers, washing machines, dryers, dishwashers, ovens (including microwave and combination units), and room air conditioners, sold for household use, whether replacement or first-time purchase.
Scope excludes countertop/portable "small" appliances, commercial-grade equipment, and aftermarket services such as installation or extended warranties.
Segmentation Overview
- By Product
- Refrigerators
- Freezers
- Washing Machines
- Dishwashers
- Ovens (Incl. Combi & Microwave)
- Air Conditioners
- Other Major Home Appliances (range hoods, cooktops, etc.)
- By Distribution Channel
- Multi-Brand Stores
- Exclusive Brand Outlets
- Online
- Other Distribution Channels
- By Geography
- Northeast
- Southeast
- Midwest
- Southwest
- West
Detailed Research Methodology and Data Validation
Primary Research
Multiple guided interviews were held with U.S. appliance retailers, buying-group executives, regional distributors, and energy-efficiency program managers. These conversations clarified emerging ASP trends, online/offline mix shifts, and regional replacement cycles. Follow-up surveys with installation contractors and utility rebate administrators helped cross-check penetration assumptions for heat-pump dryers and Energy-Star refrigerators.
Desk Research
Mordor analysts began with public datasets from agencies such as the U.S. Census Bureau's Monthly Retail Trade Survey, the Bureau of Economic Analysis' personal-consumption tables, and the Energy Information Administration's appliance stock data, which illuminate unit demand and average selling prices. Trade association releases (AHAM shipment reports, National Retail Federation sales briefs) and customs import files added directional insight on inbound volumes and price bands. Company 10-Ks, investor decks, and select news feeds accessed through Dow Jones Factiva supplied brand-level benchmarks and channel mix clues. Subscription databases, such as D&B Hoovers for manufacturer financials and Volza for shipment-level HS codes, were tapped to calibrate production versus import splits and to validate retail mark-ups. The sources cited above are illustrative; many additional public and proprietary references underpin the data collection, validation, and clarification process.
Market-Sizing & Forecasting
A top-down model reconstructs demand by reconciling retail sales receipts with domestic production and net import flows, after removing small-appliance revenue. Select bottom-up checks, including brand roll-ups of publicly reported U.S. sales and sampled average selling price multiplied by units for leading retailers, corroborate totals before modest alignment. Key variables feeding the model include housing starts, existing-home sales (replacement trigger), personal disposable income, AHAM shipment indices, and average Energy-Star rebate values, each forecast through the forecast period with multivariate regression. Gaps where distributor margins or gray-channel volumes are opaque are bridged using midpoint estimates agreed upon during expert interviews and stress-tested against historical volatility bands.
Data Validation & Update Cycle
Model outputs pass variance checks against secondary ratios (e.g., replacements-to-housing-stock) and peer benchmarks before senior analyst review. The dataset refreshes annually, with interim updates triggered by material events such as tariff resets or EPA efficiency rule changes. A final pre-publication sweep ensures clients receive the latest vetted view.
Why Our US Major Home Appliance Industry Report Size & Share Analysis Baseline Earns Maximum Trust
Published figures rarely match because firms vary product scope, sales-value definitions, and refresh timing. Mordor's disciplined segmentation and dual-path modeling provide a level, transparent baseline for planners who cannot afford guesswork.
Key gap drivers include some providers bundling small appliances, others relying on manufacturer shipment value rather than end-user spend, a few extrapolating historical growth without validating current ASP erosion, and refresh cycles differing, leading to currency-year mismatches.
Benchmark comparison
| Market Size | Anonymized source | Primary gap driver |
|---|---|---|
| USD 42.73 B (2025) | Mordor Intelligence | - |
| USD 102.54 B (2025) | Global Consultancy A | Includes small appliances and accessories, uses retail receipt basis without trade-promotion adjustment |
| USD 58.33 B (2024) | Regional Consultancy B | Mixes major and small appliances, models on factory shipment value, older base year |
| USD 30.72 B (2023) | Industry Data Platform C | Captures online channels only, excludes in-store sales and regional dealer mark-ups |
The comparison shows that scope breadth, channel coverage, and currency year explain much of the spread. By clearly separating major appliances, aligning to end-user spend, and refreshing every twelve months, Mordor offers a balanced, reproducible baseline that decision-makers can rely on.


Key Questions Answered in the Report
What is the current United States major home appliances market size and expected growth outlook to 2031
The United States major home appliances market size is USD 42.73 billion in 2025, is projected to reach USD 43.95 billion in 2026, and is expected to reach USD 50.64 billion by 2031 at a 2.87% CAGR.
Which product categories are leading the United States major home appliances market in 2026
Refrigerators hold the largest product type share, and cooktops and ranges show the fastest projected growth due to induction adoption and updated standards for new gas models.
How are incentives and codes influencing appliance replacement cycles in the United States
The energy-efficient home improvement credit and the home electrification and appliances rebate program shorten paybacks for efficient heat pumps, heat-pump water heaters, and induction ranges, accelerating upgrades in many states.
What role does e-commerce play in the sales of major appliances in the United States?
Online share reached 26% of United States major appliance purchases in Q2 2025, and leading retailers reported rising online revenue shares supported by marketplace assortment and improved delivery and installation services.
Which United States regions are growing fastest for major home appliances, and why
The West is projected to post the fastest 3.18% CAGR due to electrification policies and early rebate deployment, while the Southeast leads by share, with strong construction and retrofit packages.
Page last updated on:


