Market Overview
| Study Period | 2021 - 2031 |
|---|---|
| Market Size (2026) | USD 185.05 Billion |
| Market Size (2031) | USD 248.57 Billion |
| Growth Rate (2026 - 2031) | 6.08% CAGR |
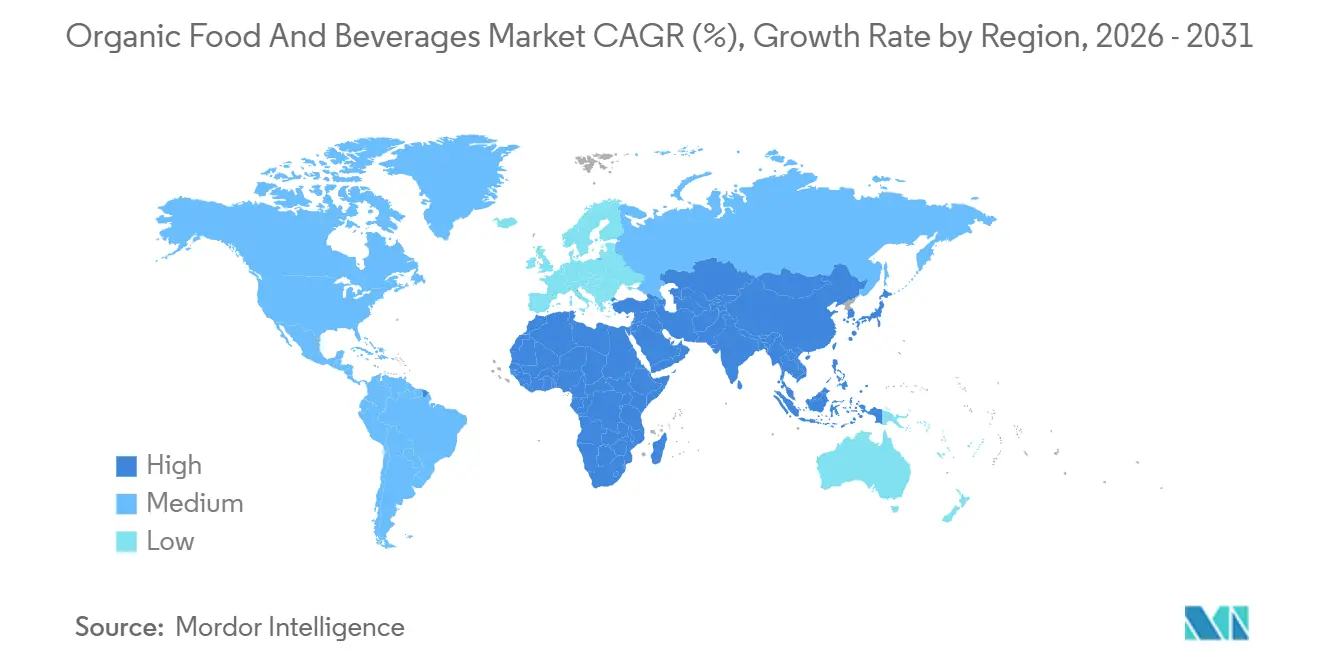
| Fastest Growing Market | Asia Pacific |
| Largest Market | North America |
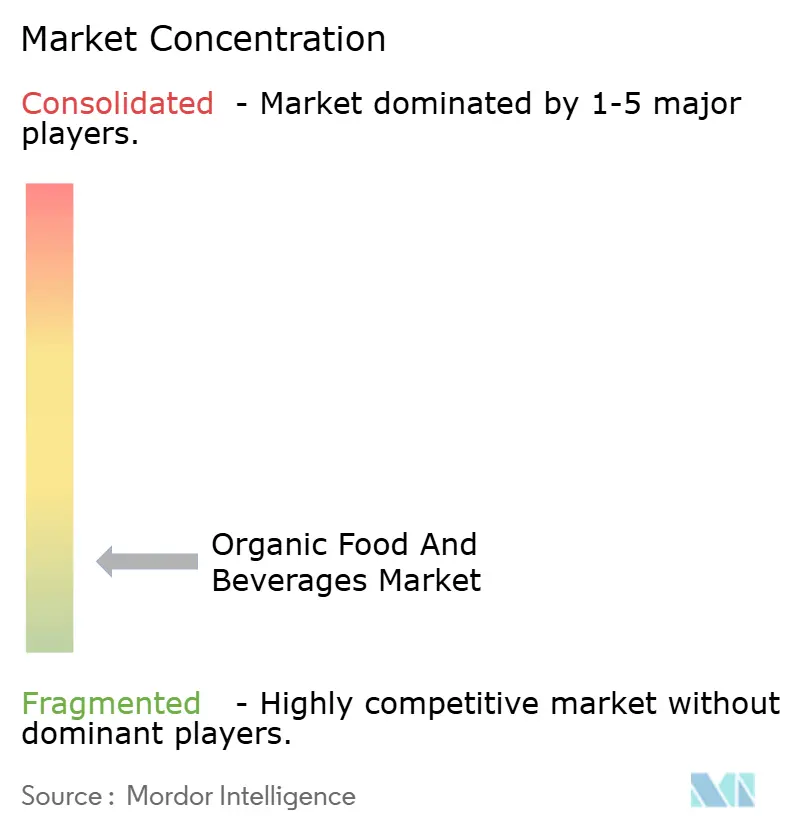
| Market Concentration | Low |
Major Players
*Disclaimer: Major Players sorted in no particular order Image © Mordor Intelligence. Reuse requires attribution under CC BY 4.0. |
|

Organic Food And Beverages Market Analysis by Mordor Intelligence
The global organic food and beverage market is estimated to reach USD 185.05 billion in 2026 and is projected to grow to USD 248.57 billion by 2031, registering a compound annual growth rate (CAGR) of 6.08%. This growth reflects a robust and sustained expansion trajectory. The market's growth is primarily driven by a significant shift in consumer behavior, with food choices increasingly influenced by long-term health considerations, clean-label preferences, and environmental responsibility, rather than short-term dietary trends. Organic products are widely regarded as safer and more reliable due to the absence of synthetic pesticides, chemical fertilizers, genetically modified organisms, and artificial additives, making them a staple in daily consumption rather than occasional premium items. Additionally, growing awareness of climate change, soil degradation, and biodiversity loss is boosting demand for organic and regenerative agricultural practices, positioning organic food and beverages as integral to a sustainability-focused transformation of the food system.
Key Report Takeaways
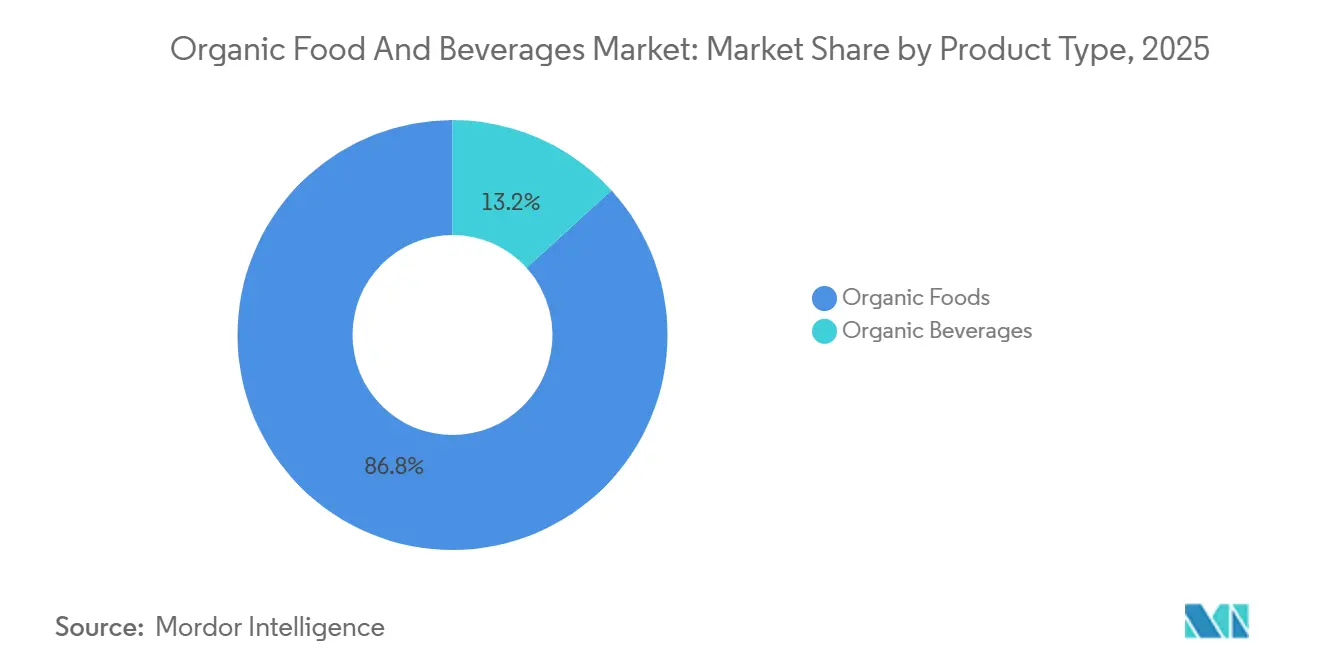
- By product type, organic foods commanded 86.76% revenue share in 2025, while organic beverages are forecast to grow at a 7.29% CAGR through 2031.
- By form, fresh and chilled products held 63.04% of the organic food and beverage market share in 2025, and frozen products are advancing at a 7.65% CAGR to 2031.
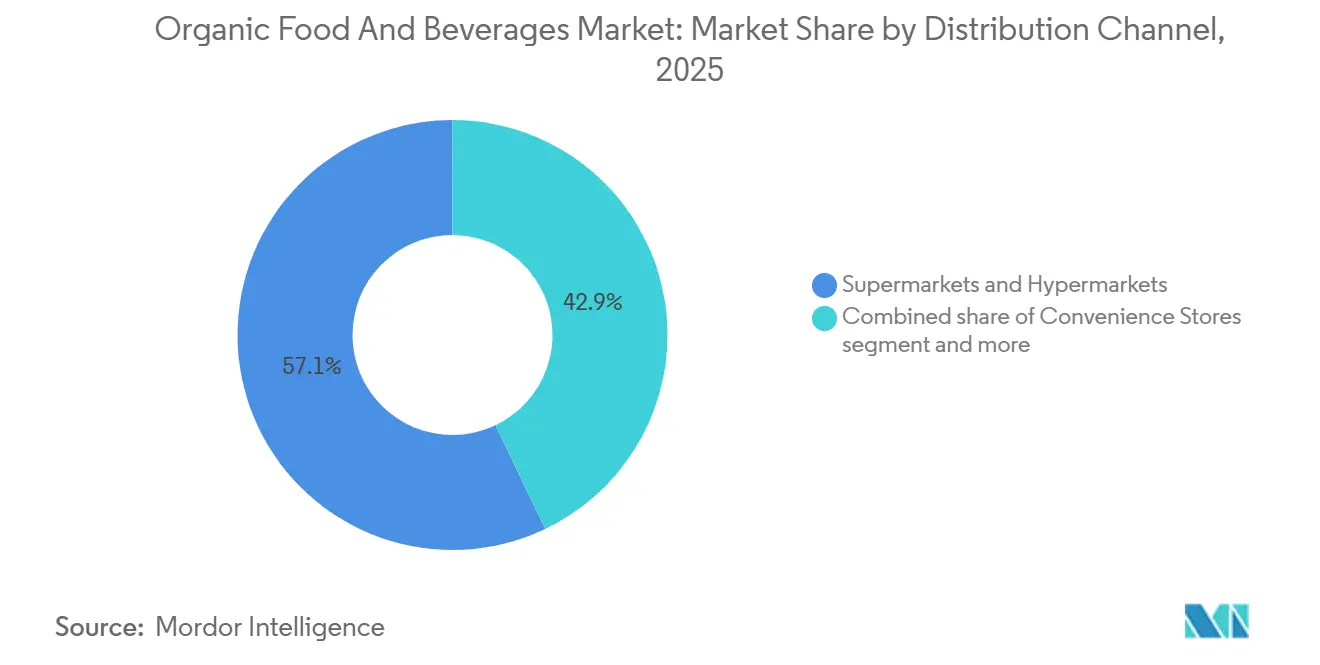
- By distribution channel, supermarkets and hypermarkets captured 57.09% of sales in 2025; online retail is projected to post an 8.49% CAGR to 2031.
- By geography, North America led with 43.39% revenue share in 2025, while Asia-Pacific is set to post the fastest 7.56% CAGR through 2031.
Note: Market size and forecast figures in this report are generated using Mordor Intelligence’s proprietary estimation framework, updated with the latest available data and insights as of January 2026.
Global Organic Food And Beverages Market Trends and Insights
Drivers Impact Analysis*
| Driver | (~) % Impact on CAGR Forecast | Geographic Relevance | Impact Timeline |
|---|---|---|---|
| Health and wellness prioritization | +1.0% | Global, with concentration in North America, Western Europe, and urban Asia-Pacific | Medium term (2-4 years) |
| Clean-label and ingredient transparency expectations | +0.8% | North America and Europe, expanding to Asia-Pacific urban centers | Short term (≤ 2 years) |
| Product innovation driving market growth | +0.7% | Global, led by North America and Europe with Asia-Pacific adoption | Medium term (2-4 years) |
| Environmental sustainability and regenerative agriculture momentum | +0.6% | Europe and North America core, with spillover to Latin America and Oceania | Long term (≥ 4 years) |
| Animal welfare and better livestock practices perception | +0.5% | Western Europe and North America, emerging in Asia-Pacific affluent segments | Medium term (2-4 years) |
| Food safety and traceability focus | +0.4% | Global, acute in markets with recent food safety scandals (China, India) | Short term (≤ 2 years) |
| Source: Mordor Intelligence | |||
Health and wellness prioritization
Health and wellness prioritization has become a significant structural driver of the global organic food and beverages market, as the focus on chronic disease prevention has shifted from being an aspirational lifestyle choice to a risk-management approach among consumers. Increasing awareness of diet-related conditions has led consumers to reassess their daily food choices, with a focus on products perceived as safer, cleaner, and more nutritionally superior. Organic foods are increasingly regarded as a practical preventive measure due to their exclusion of synthetic pesticides, artificial additives, genetically modified organisms (GMOs), and routine antibiotic use in animal farming. This reinforces their role in long-term health maintenance rather than being associated with short-term dietary trends. This behavioral shift is evident in mature markets. For instance, the organic food market in the United States reached USD 71.6 billion in 2024, according to the Organic Trade Association [1]Source: Organic Trade Association, "Organic Trade Association reports sale of organic products", ota.com. The sustained strength of organic sales in a deflationary retail environment highlights that organic purchasing is increasingly driven by health risk mitigation rather than discretionary spending, particularly in high-frequency categories such as fresh produce, dairy, baby food, and functional staples.
Clean-label and ingredient transparency expectations
Clean-label and ingredient transparency have become key drivers of growth in the global organic food and beverages market, as consumers increasingly examine the contents and production methods of their food. There is a noticeable shift away from products containing artificial preservatives, synthetic colors, chemical stabilizers, and lengthy ingredient lists. Instead, consumers are opting for organic foods and beverages with simple, recognizable, and minimally processed ingredients. This trend highlights a growing demand for clear and honest food labeling, with organic certification serving as a reliable indicator of adherence to strict production standards and ingredient quality. Transparency regarding sourcing, farming practices, and processing methods further enhances consumer trust, particularly in segments such as baby food, dairy, beverages, and packaged staples. Organic brands are increasingly utilizing digital labeling tools, QR codes, and front-of-pack claims to provide information on origin, certification, and formulation, fostering trust and encouraging repeat purchases.
Product Innovation driving market growth
Product innovation plays a significant role in driving growth within the global organic food and beverages market. Brands are moving beyond traditional organic staples to introduce function-focused, lifestyle-oriented products that cater to evolving consumer preferences for natural energy, wellness, and clean stimulation. Recent innovations emphasize combining organic certification with functional benefits, such as natural caffeine sources, adaptogenic ingredients, and multi-ingredient formulations that exclude synthetic additives while providing measurable advantages. For instance, in October 2025, Uncle Matt's Organic introduced the first organic yerba mate energy tea. This product is brewed using organic yerba mate leaves, organic lemon juice, and organic green tea caffeine, delivering 100 mg of naturally sourced caffeine per serving. It is positioned as a clean-label alternative to conventional energy drinks that use synthetic caffeine and artificial ingredients. This launch highlights how organic brands are entering high-growth functional beverage segments by integrating organic integrity with performance benefits like sustained energy and mental alertness.
Environmental sustainability and regenerative agriculture momentum
Environmental sustainability and the increasing focus on regenerative agriculture are significant drivers of the global organic food and beverages market. Consumers, regulators, and brands are prioritizing food systems that protect ecosystems while promoting long-term agricultural resilience. Organic food production aligns with sustainability principles, including soil health improvement, biodiversity preservation, reduced chemical runoff, and decreased reliance on synthetic inputs, positioning it as a key beneficiary of this trend. Regenerative agriculture complements these principles by focusing on carbon sequestration, water conservation, crop rotation, and holistic land management practices, appealing to environmentally conscious consumers. Major food companies are supporting this transition through measurable commitments. For instance, Danone and General Mills have pledged to source 30% of their ingredients from regenerative farms by 2030, reflecting a structural shift in sourcing strategies within the food industry. These commitments not only drive demand for organically and regeneratively grown raw materials but also position organic products as viable solutions to climate and sustainability challenges.
Restraints Impact Analysis*
| Restraint | (~) % Impact on CAGR Forecast | Geographic Relevance | Impact Timeline |
|---|---|---|---|
| Limited availability of certified organic raw materials | -0.5% | Global, acute in Asia-Pacific and emerging markets with underdeveloped certification infrastructure | Short term (≤ 2 years) |
| Complex and time-intensive certification processes | -0.4% | Global, particularly burdensome in regions with fragmented regulatory frameworks | Medium term (2-4 years) |
| Higher vulnerability to crop yield variability | -0.3% | Global, most severe in regions with climate volatility (South Asia, Sub-Saharan Africa, Mediterranean) | Medium term (2-4 years) |
| Risk of contamination and decertification | -0.3% | Global, heightened in regions with intensive conventional agriculture adjacency | Short term (≤ 2 years) |
| Source: Mordor Intelligence | |||
Limited availability of certified organic raw materials
The limited availability of certified organic raw materials poses a significant challenge to the global organic food and beverages market, hindering scalability and slowing market growth despite increasing demand. Organic farming requires adherence to stringent certification standards, including multi-year land conversion periods, controlled input usage, and regular compliance audits. These requirements limit the speed at which conventional farmland can transition to certified organic production. Consequently, supply growth often fails to keep pace with demand for key raw materials such as organic grains, fruits, vegetables, dairy inputs, and plant-based proteins, creating bottlenecks for manufacturers aiming to expand product lines or enter new markets. Seasonal variability, climate sensitivity, and a higher risk of crop losses further intensify supply constraints, particularly in regions with underdeveloped organic farming infrastructure. Additionally, the need for segregated handling, storage, and transportation of organic raw materials increases operational complexity and the risk of contamination or decertification, discouraging smaller farmers from transitioning to organic farming.
Complex and time-intensive certification processes
Complex and time-consuming certification processes pose a significant restraint on the global organic food and beverages market by creating entry barriers and hindering supply-side growth. Obtaining organic certification requires adherence to stringent standards, including farming practices, input usage, traceability, processing, storage, and labeling. Additionally, agricultural land must undergo a conversion period of two to three years, during which producers must comply with organic protocols without being able to market their products as certified organic. This transition phase discourages participation, particularly among small and mid-scale farmers and processors. The certification process also entails recurring inspections, extensive documentation, audit expenses, and renewal requirements, adding to administrative complexity and operational challenges. For manufacturers operating across multiple regions, the lack of uniform organic standards and varying certification equivalency rules further complicates cross-border sourcing and product standardization.
*Our forecasts treat driver/restraint impacts as directional, not additive. The impact forecasts reflect baseline growth, mix effects, and variable interactions.
Segment Analysis
By Product Type: Beverages Outpace Foods Despite Smaller Base
Organic foods accounted for a significant 86.76% of total market revenue in 2025, establishing the segment as the primary driver of growth and value within the global organic food and beverages market. This substantial share is largely due to the daily-consumption nature of food products, where organic attributes are highly valued and consistently incorporated into consumer diets. Consumers associate organic foods with reduced exposure to synthetic pesticides, chemical fertilizers, genetically modified organisms (GMOs), and artificial additives, fostering trust, repeat purchases, and long-term dietary integration. This structural strength is evident in established organic markets. For example, according to the German Federation of Organic Food Producers (BÖLW), organic food revenues in Germany reached EUR 16.99 billion, reflecting strong consumer trust and widespread adoption of organic foods in daily consumption [2]Source: German Federation of Organic Food Producers (BÖLW), "Revenue from organic food in Germany", boelw.de.
Organic beverages are projected to grow at a compound annual growth rate (CAGR) of 7.29% through 2031, making it the fastest-growing segment within the global organic food and beverages market and a key contributor to future market expansion. This growth is driven by evolving consumer lifestyles that prioritize convenient, on-the-go nutrition, along with an increasing preference for clean-label and functional drink options. Consumers are particularly attracted to organic beverages offering functional benefits such as digestive health, immunity support, hydration, and natural energy, while avoiding synthetic preservatives, colors, and sweeteners. The segment is further supported by innovations in low-sugar formulations, fermentation-based drinks, and organic-certified plant-based ingredients, enhancing both health benefits and taste profiles.


By Form: Frozen Gains as Cold Chain Expands
Fresh and chilled organic products accounted for 63.04% of the total market share in 2025, highlighting their leading position in the global organic food and beverages market. This dominance underscores the importance of freshness in organic consumption. The segment's leadership is primarily attributed to strong consumer perceptions that the value of organic products is most authentic and evident in fresh formats, particularly in fruits and vegetables, fresh dairy, meat, eggs, and chilled ready-to-eat foods. Consumers tend to prioritize organic certification when purchasing perishable items, driven by concerns over pesticide residues, antibiotics, hormones, and artificial additives. Additionally, this segment benefits from high purchase frequency and routine household consumption, which supports consistent volume turnover and repeat purchases. The growing awareness of health and environmental benefits associated with organic fresh products further strengthens their appeal, making them a staple in many households.
Frozen organic products are growing at a compound annual growth rate (CAGR) of 7.65% through 2031, positioning them as one of the fastest-growing segments in the global organic food and beverages market. This growth is fueled by the intersection of health-conscious eating habits and convenience-driven lifestyles. Frozen formats provide consumers with access to organic foods that offer extended shelf life while maintaining nutritional value, taste, and food safety. Advances in freezing technologies, such as individually quick frozen (IQF) methods, have significantly enhanced the texture, color, and nutrient preservation of frozen organic products. These improvements have bolstered consumer confidence in frozen organic fruits, vegetables, ready meals, and snacks. Additionally, the increasing availability of diverse frozen organic options and the rising adoption of sustainable packaging solutions are further driving the segment's growth.
By Distribution Channel: E-Commerce Erodes Retail Pricing Power
Supermarkets and hypermarkets accounted for 57.09% of total sales in 2025, maintaining their position as the leading distribution channel in the global organic food and beverages market. Their dominance is attributed to their ability to provide a wide product assortment, consistent availability, and the convenience of one-stop shopping. These factors are particularly significant for organic foods, which are often purchased as part of routine grocery trips. Large-format retailers allocate substantial shelf space for organic fresh produce, dairy, packaged staples, and beverages. This is complemented by clear in-store segmentation, private-label organic product lines, and transparent labeling, which enhance consumer trust. Additionally, their advanced supply chain capabilities, particularly in cold-chain management, ensure the reliable handling of fresh, chilled, and frozen organic products, further strengthening consumer confidence in product quality and safety.
Online retail stores are growing at a compound annual growth rate (CAGR) of 8.49% through 2031, making them the fastest-growing distribution channel in the global organic food and beverages market. This growth is driven by increasing consumer demand for convenience, product transparency, and a broader selection, especially for niche and premium organic products that may have limited availability in physical stores. E-commerce platforms provide detailed product descriptions, certification visibility, ingredient disclosures, and origin information, all of which are critical factors influencing organic purchase decisions. Furthermore, online platforms enable brands to engage directly with consumers through targeted marketing, personalized recommendations, and educational content highlighting the benefits of organic products and their sustainability credentials.

Geography Analysis
In 2025, North America accounted for 43.39% of global organic food and beverage revenue, reflecting the region's maturity and strong consumer trust in certified organic products. The United States and Canada dominate the regional market, supported by well-established organic certification systems and extensive retail penetration. Organic consumption in North America is deeply integrated into daily diets, particularly in categories such as fresh produce, dairy, packaged staples, and baby food. These categories benefit from consumer associations of organic attributes with food safety, clean-label preferences, and sustainability. Continuous product innovation, robust traceability systems, and high consumer awareness have enabled North America to maintain its leadership position and serve as a benchmark for global organic food and beverage market development.
The Asia-Pacific region is experiencing a compound annual growth rate (CAGR) of 7.56% through 2031, making it the fastest-growing regional market for organic food and beverages. This growth is driven by increasing health awareness, food safety concerns, and the rapid expansion of certified organic production and distribution networks. In China, there is a strong demand for organic staples, baby food, and functional foods as consumers prioritize quality, traceability, and chemical-free production. In India, market growth is supported by government-led certification and export initiatives, particularly the National Programme for Organic Production (NPOP). This program has significantly increased the number of certified producers and enhanced global acceptance of Indian organic products.
Europe represents a steadily growing market for organic food and beverages, with countries such as Germany, France, and the United Kingdom driving regional growth. The market is characterized by strong regulatory oversight, high consumer awareness of sustainability, and widespread trust in organic certification systems. European consumers increasingly associate organic products with environmental stewardship, animal welfare, and long-term health benefits, sustaining demand across fresh, chilled, and packaged categories. The strength of the certification ecosystem is evident in the United Kingdom, where, according to the Government of the United Kingdom, 5,133 producers and processors were registered with organic certification bodies in 2024 [3]Source: Government of the United Kingdom, "Organic farming statistics 2024", gov.uk. This highlights the scale and institutionalization of organic production. Continued policy support and retailer commitments further bolster the market's growth.

Regulatory Landscape
Organic food and beverages are shaped by certification, labeling, and traceability requirements that influence farm conversion, processing inputs, and cross-border trade. In the United States, the USDA Agricultural Marketing Service administers the National Organic Program (7 CFR Part 205), and the Strengthening Organic Enforcement (SOE) final rule reached its two-year implementation milestone on March 19, 2026, strengthening supply-chain accountability for certified operators and importers.
In the European Union, organic production, labeling, and controls are framed under Regulation (EU) 2018/848. Policy activity in 2026 focuses on targeted revisions covering production, labeling, and trade rules. In May 2026, the Council of the European Union agreed a negotiation mandate on organic rules, and in July 2026 the European Parliament AGRI committee adopted a position that includes raising the small-operator exemption turnover threshold from EUR 20,000 to EUR 25,000 per year. Separately, the EU import framework is under time pressure because existing equivalence arrangements with 11 third countries expire on December 31, 2026, which increases compliance and documentation requirements for global suppliers selling into Europe.
Competitive Landscape
The global organic food and beverage market is moderately fragmented, with a mix of large multinational corporations and numerous regional and niche organic specialists. Key multinational companies such as Danone S.A., Nestlé S.A., General Mills Inc., and CROPP Cooperative significantly influence the market structure through strong brand equity, global sourcing networks, and extensive distribution channels. These companies have incorporated organic products into their broader portfolios, including dairy, baby food, cereals, snacks, beverages, and plant-based products, enabling the scaling of organic consumption through mainstream retail outlets. Simultaneously, the market remains highly competitive due to the presence of certified organic brands that emphasize local sourcing, artisanal positioning, and specialization in categories such as fresh produce, dairy alternatives, and packaged staples.
Opportunities are expanding in segments like organic infant nutrition and organic pet food, driven by heightened safety concerns, ingredient scrutiny, and long-term health considerations. Parents and pet owners demonstrate lower price sensitivity and higher trust requirements, making organic certification a key differentiator in these categories. Consequently, both multinational corporations and smaller innovators are focusing on clean-label formulations, allergen-free recipes, and traceable sourcing models to capture these high-margin segments. Additionally, premium sub-segments such as functional organic foods, fortified beverages, and regenerative-organic products are emerging as strategic growth areas. These segments enable brands to move beyond commodity-style organic offerings and establish differentiated value propositions.
Technology adoption within the organic food and beverage market varies significantly, creating a diverse competitive landscape. Leading players have introduced blockchain-based traceability systems and advanced digital labeling solutions to enhance transparency and supply chain credibility. However, many mid-sized and smaller organic producers continue to rely on traditional certification and documentation methods. This disparity hinders industry-wide standardization of real-time traceability but also provides an opportunity for technologically advanced brands to stand out. These brands can leverage enhanced provenance storytelling, farm-level data access, and consumer-facing verification tools to differentiate themselves in the market.
Organic Food And Beverages Industry Leaders
-
Danone S.A.
-
Nestlé S.A.
-
General Mills Inc.
-
The Hain Celestial Group
-
CROPP Cooperative
- *Disclaimer: Major Players sorted in no particular order

Market Opportunities and Future Outlook
Processing investments are creating room for higher-throughput, shelf-stable and snackable organic formats, enabling companies to extend distribution beyond local fresh supply. In June 2026, SunOpta opened a newly expanded organic fruit snacks production line at its Omak, Washington facility, a USD 25 million investment that increased capacity by 25%, highlighting continued industrialization of organic ingredient and finished-goods processing. Similar manufacturing-side scaling appears in June 2026 announcements by Top Seedz, which plans to add a second production line and additional ovens. In July 2026, Edible Garden engaged E2 Building Group to lead construction execution for a planned 400,000-square-foot manufacturing hub in Webster City, Iowa, designed for organic-compliant nutritional beverages.
Public programs are also reducing some cost and capability barriers for certified supply, supporting expansion by farms and processors. USDA programs for 2025 and 2026 cover up to 75% of eligible organic certification costs through the Organic Certification Cost Share Program (application deadline: December 31, 2026). The Organic Agriculture Research and Extension Initiative made approximately USD 66 million available in FY 2026 for research and extension that supports producers and processors working under organic standards. In Europe, revisions to organic rules and the transition away from equivalence-based import arrangements, with a key deadline at the end of 2026, create scope for operators with stronger documentation, traceability, and multi-market certification readiness to differentiate in cross-border trade and retail acceptance.
Recent Industry Developments
- July 2026: Edible Garden AG Incorporated engaged E2 Building Group to lead construction execution for its planned 400,000-square-foot Webster City, Iowa manufacturing hub focused on shelf-stable, organic-compliant nutritional beverages. The project signals continued investment in scaled, compliant processing infrastructure that can support broader geographic distribution and private-label or co-manufacturing opportunities.
- September 2025: Nespresso (Nestle) announced it will be the first coffee brand to source Rainforest Alliance Certified Regenerative coffee, with products appearing on the market starting in 2026. The sourcing arrangement ties premium coffee to regenerative standards, tightening upstream requirements while giving branded players a route to differentiate sustainability credentials in organic-adjacent beverage segments.
- July 2025: Danone completed the acquisition of a majority stake in Kate Farms, a US-based maker of plant-based, organic nutrition products for medical and everyday use. This expanded Danone's specialized and organic-positioned nutrition portfolio and strengthened its ability to scale distribution through established healthcare and retail channels.


Research Methodology Framework and Report Scope
Market Definition and Coverage
This market covers the value of certified organic food and beverage products sold through retail and similar channels, where certification follows recognized organic standards. It includes packaged and fresh formats, and counts revenues at the point where products are sold to end buyers.
Scope exclusions: Items marketed as natural or clean label without organic certification, dietary supplements, and conventional products with only minor organic ingredients are excluded.
Segmentation Overview
-
By Product Type
-
Organic Foods
- Fruit and Vegetables
- Meat, Fish and Poultry
- Dairy Products
- Frozen and Processed Foods
- Other Foods
-
Organic Beverages
- Fruit and Vegetable Juices
- Dairy-based
- Coffee
- Tea
- Other Beverages
-
Organic Foods
-
By Form
- Fresh/Chilled
- Canned
- Frozen
-
By Distribution Channel
- Supermarkets/Hypermarkets
- Convenience Stores
- Specialty Stores
- Online Stores
- Other Channels
-
By Geography
-
North America
- United States
- Canada
- Mexico
- Rest of North America
-
Europe
- Germany
- United Kingdom
- Italy
- France
- Spain
- Netherlands
- Poland
- Belgium
- Sweden
- Rest of Europe
-
Asia-Pacific
- China
- India
- Japan
- Australia
- Indonesia
- South Korea
- Thailand
- Singapore
- Rest of Asia-Pacific
-
South America
- Brazil
- Argentina
- Colombia
- Chile
- Peru
- Rest of South America
-
Middle East and Africa
- South Africa
- Saudi Arabia
- United Arab Emirates
- Nigeria
- Egypt
- Morocco
- Turkey
- Rest of Middle East and Africa
-
North America
Data Sources, Market Sizing, and Validation
Desk Research
For desk research, we built a clean view of supply, demand, and certification rules that shape what can be counted as organic in each country. Public sources, such as USDA Organic (NOP) resources, the European Commission organic regulation pages, FAOSTAT food production series, and UN Comtrade trade statistics, were used to anchor category definitions and cross-border flows.
To keep the inputs practical, we also reviewed investor presentations and annual reports from listed food and beverage companies, alongside updates from organic trade associations and reputable business press. Patent database screening was used as a light check on innovation activity in organic processing and packaging claims, and an import/export shipment-level database was referenced selectively to sanity-check major product movements where customs codes were informative. These desk sources are not exhaustive, and additional public references were also used for data collection, validation, and clarification.
Primary Interviews and Surveys
Primary work focused on confirming how organic claims translate to real shelf availability, pricing, and channel mix, which are hard to infer from public datasets alone. We spoke with industry participants across branded food and beverage suppliers, ingredient handlers, certification-adjacent service providers, and retail and distribution stakeholders, covering APAC, EMEA, and the Americas to reflect differences in standards implementation and organic adoption.
Distribution of primary research fieldwork respondents
| Company type | Respondent position | Region |
|---|---|---|
| Top tier: 33% | CXOs: 12% | APAC: 50% |
| Mid tier: 47% | Functional/Unit leaders: 28% | EMEA: 30% |
| Smaller Players: 20% | Managers: 60% | Americas: 20% |
Market-Sizing & Forecasting
Sizing starts with a top-down build where category demand pools are reconstructed using food and beverage consumption signals, trade balances, and expected organic penetration within each major geography. After regional totals are formed, they are mapped into organic foods and organic beverages, then adjusted for the typical channel mix across supermarkets, specialty stores, convenience retail, and online.
To keep assumptions grounded, we relied on a short set of fingerprints that tend to move this market in a visible way, including certified organic farmland and production availability, import reliance for selected categories, organic price premiums by format (fresh versus frozen or canned), private label expansion in modern retail, and online share shifts for repeat-purchase items. Where public data is thin at the sub-category level, gaps were handled through bounded ranges and then narrowed using interview feedback on mix and pricing. Forecasting used scenario analysis supported by simple trend fitting on the key drivers, and the final trajectory was checked against how certification capacity and retail shelf space can realistically expand year by year.
Data Validation & Update Cycle
Validation used triangulation across independent signals, so model outputs were compared against certification and production cues, trade direction, and channel-level growth patterns before final sign-off. When a number appeared too high or too low, we rechecked the drivers first, then used follow-up calls to confirm whether the change was real or caused by a scope mismatch.
Before release, the work goes through multi-step analyst reviews where assumptions, currency conversions, and year alignment are checked consistently across regions and product groups. Reports are refreshed annually, and interim updates are made when material events occur, such as regulation changes, sharp inflation swings that shift organic premiums, or major retail channel resets. Right before delivery, we do a fresh pass so the final output reflects the latest available public and primary inputs.
Mordor Intelligence's Organic Food and Beverages Market Size Versus Other Published Estimates
Published market sizes for organic food and beverages do not always line up because each publisher draws the market boundary in its own way, then applies different price and volume assumptions. Differences also show up when base years are not aligned, when inflation and currency timing are treated differently, or when certification definitions are applied loosely.
By tracking certification-based inclusion rules and refreshing category price-premium assumptions, Mordor Intelligence keeps the model tied to what is actually sold as certified organic across foods and beverages, instead of counting adjacent natural or wellness categories. Some estimates also apply aggressive growth rates from short time windows and then extend them forward, which can lift the starting point and the curve. Another common gap is channel coverage, where foodservice and retail are combined without a clear handoff point, which can lead to double counting or uneven geography weighting.
Benchmark comparison
| Source | Market Size | Gaps in Research Methodology |
|---|---|---|
| Mordor Intelligence | USD 185.05 B (2026) | |
| Industry Analytics Group A | USD 231.52 B (2023) | Uses an earlier base year and a different growth window, and the scope description is less explicit on certification-only counting, which can pull in broader organic-adjacent sales. |
| Global Consultancy B | USD 320.43 B (2025) | Applies a higher-growth outlook over a long forecast horizon and appears to include wider process and channel groupings, which can inflate totals when price premiums and conversion timing are not rechecked by category. |
The spread in the table is mostly explained by year alignment, how strictly certification boundaries are enforced, and how price premiums are projected across formats and channels. Our approach stays repeatable because each step is anchored to observable drivers, then reviewed with interview feedback so the final total does not drift away from real category constraints.


Key Questions Answered in the Report
How large is the organic food and beverage market in 2026 and what growth is expected?
The market stands at USD 185.05 billion in 2026 and is forecast to reach USD 248.57 billion by 2031, reflecting a 6.08% CAGR.
Which product category is expanding the fastest?
Organic beverages are projected to grow at a 7.29% CAGR through 2031, led by functional coffee, kombucha, and plant-based dairy drinks.
Which region offers the highest growth opportunity?
Asia-Pacific is poised for a 7.56% CAGR through 2031, driven by expanding middle-class demand and supportive certification policies in China and India.
Why are frozen organic foods gaining traction?
Expanded cold-chain infrastructure preserves nutrients and extends shelf life, enabling national distribution and fueling a forecasted 7.65% CAGR for frozen offerings.
Page last updated on:


