Endpoint Security Market Size and Share
Market Overview
| Study Period | 2020 - 2031 |
|---|---|
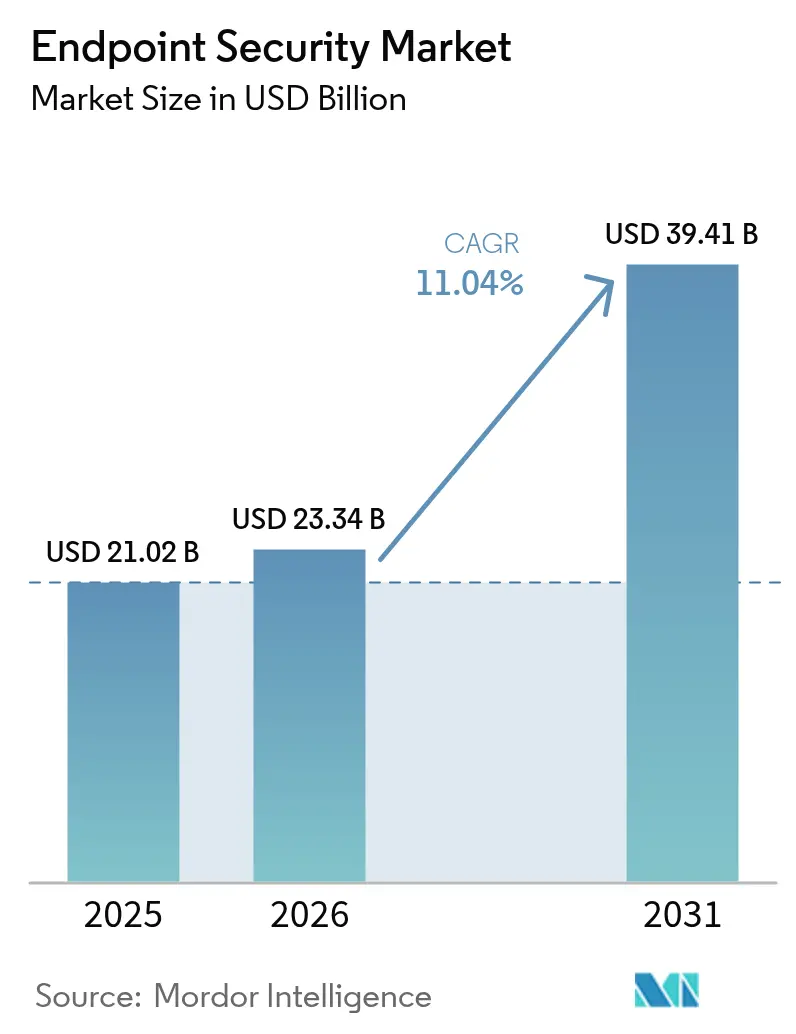
| Market Size (2026) | USD 23.34 Billion |
| Market Size (2031) | USD 39.41 Billion |
| Growth Rate (2026 - 2031) | 11.04% CAGR |
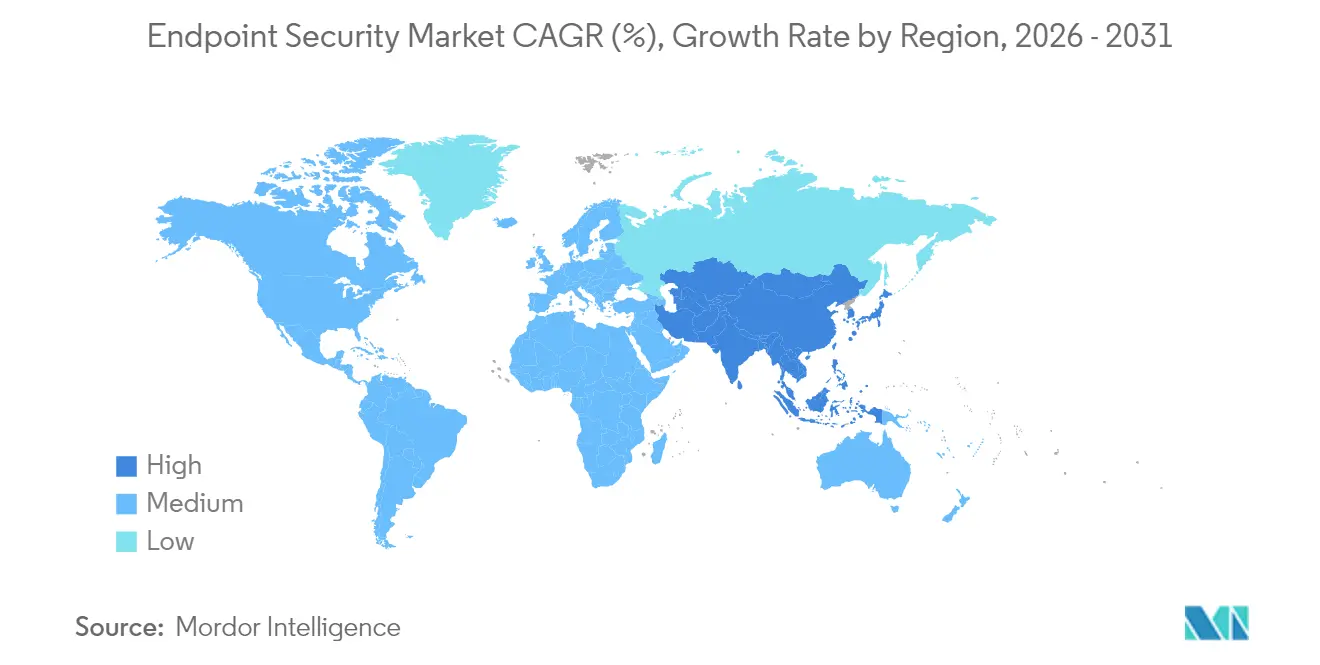
| Fastest Growing Market | Asia Pacific |
| Largest Market | North America |
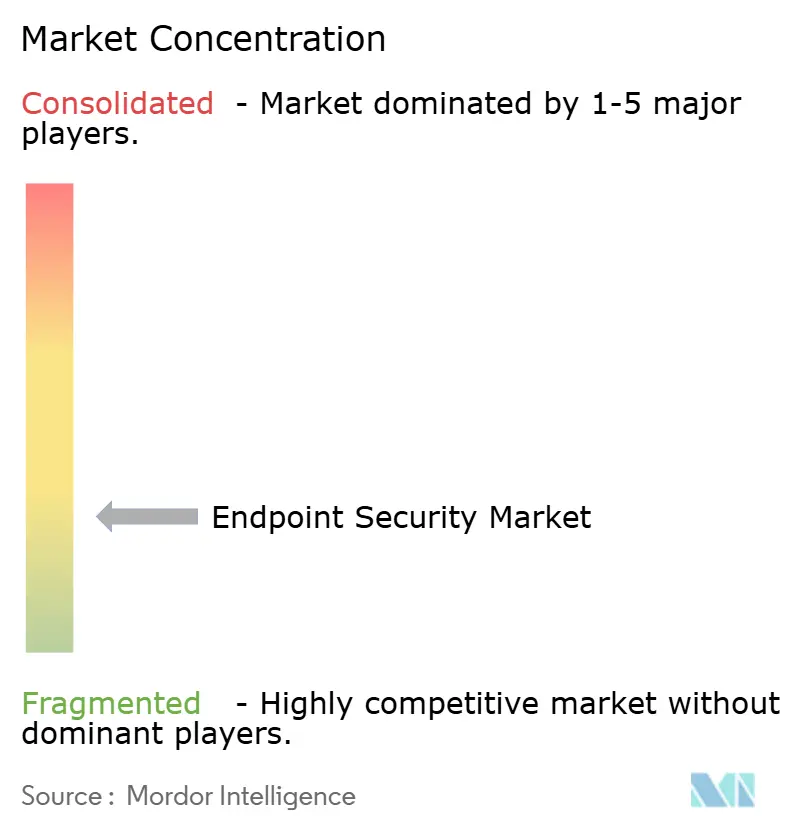
| Market Concentration | Low |
Major Players *Disclaimer: Major Players sorted in no particular order Image © Mordor Intelligence. Reuse requires attribution under CC BY 4.0. | |
Endpoint Security Market Analysis by Mordor Intelligence
Endpoint Security Market size in 2026 is estimated at USD 23.34 billion, growing from 2025 value of USD 21.02 billion with 2031 projections showing USD 39.41 billion, growing at 11.04% CAGR over 2026-2031.
Strong demand in the endpoint security market stems from the steady shift toward remote and hybrid work, the expansion of bring-your-own-device (BYOD) policies, and the growing sophistication of ransomware-as-a-service toolkits. Enterprises also face an expanding Internet-of-Things (IoT) footprint that blurs the line between information-technology and operational-technology networks, exposing critical industrial assets to the same threats historically aimed at office devices. Cloud-delivered controls, zero-trust access policies, and AI-driven behavioural analytics are therefore becoming default components of modern endpoint protection strategies. Platform providers are responding by embedding chip-level security features and bundling endpoint protection platform (EPP) and endpoint detection and response (EDR) capabilities into secure-access-service-edge (SASE) offerings to simplify policy enforcement across distributed users.
Key Report Takeaways
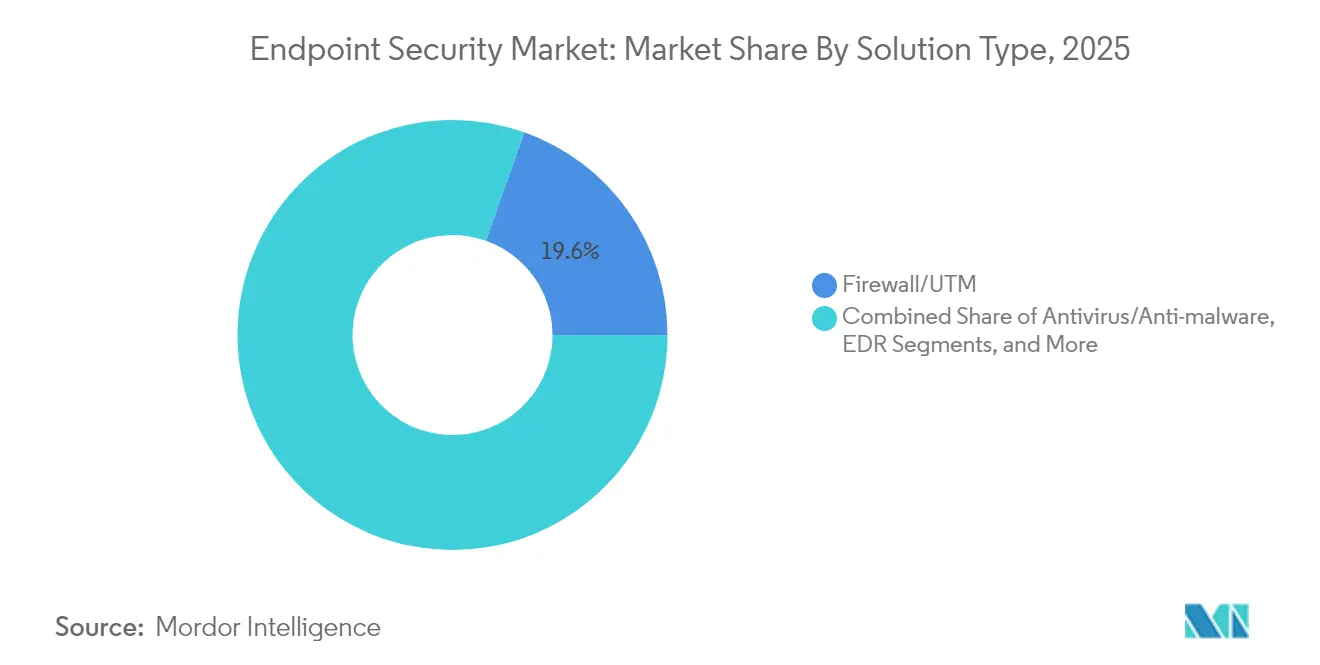
- By solution type, Firewall/UTM led with 19.58% of endpoint security market share in 2025, while EDR is on course to expand at 15.52% CAGR through 2031.
- By deployment mode, cloud-based offerings accounted for 57.88% of the endpoint security market size in 2025 and are set to grow 15.01% annually to 2031.
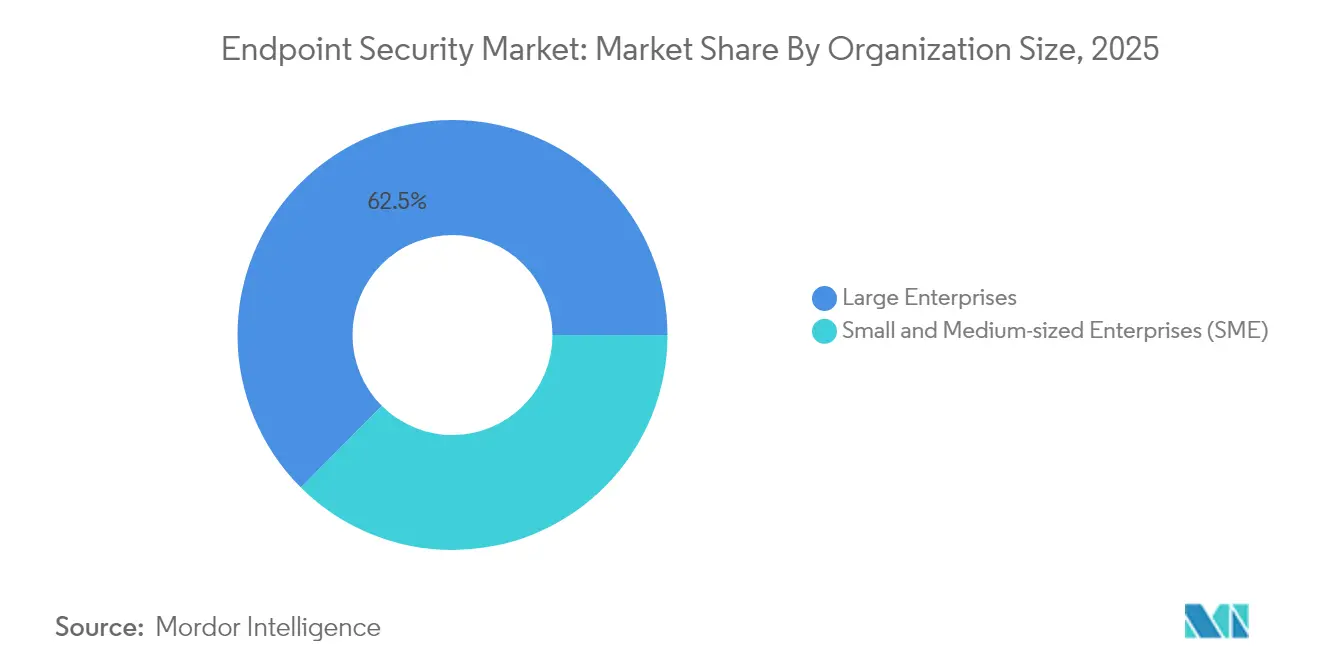
- By organization size, small and medium-sized enterprises (SMEs) are projected to grow 13.56% annually, whereas large enterprises retain 62.54% revenue share in the endpoint security market in 2025.
- By end-user industry, banking, financial services, and insurance (BFSI) held 20.42% revenue share in 2025, while healthcare and life sciences are expected to post the fastest 12.98% CAGR to 2031.
- By geography, North America captured 33.12% of 2025 revenue in the endpoint security market; Asia-Pacific is forecast to rise at a 12.22% CAGR to 2031.
Note: Market size and forecast figures in this report are generated using Mordor Intelligence’s proprietary estimation framework, updated with the latest available data and insights as of 2026.
Global Endpoint Security Market Trends and Insights
Drivers Impact Analysis*
| Driver | (~) % Impact on CAGR Forecast | Geographic Relevance | Impact Timeline |
|---|---|---|---|
| Surge in BYOD and mobile workforce | +2.8% | Global, with concentration in North America and Europe | Medium term (2-4 years) |
| Escalating sophistication of ransomware-as-a-service | +2.1% | Global, particularly affecting APAC and emerging markets | Short term (≤ 2 years) |
| Proliferation of IoT endpoints across OT networks | +1.9% | APAC core, spill-over to MEA and Latin America | Long term (≥ 4 years) |
| Wider adoption of SASE bundling EPP/EDR at edge | +1.7% | North America and EU, expanding to APAC | Medium term (2-4 years) |
| Chip-level security IP integrated by OEMs | +1.4% | Global, led by semiconductor hubs in Asia | Long term (≥ 4 years) |
| Cyber-insurance premium discounts for certified EDR | +1.1% | North America and EU regulatory markets | Short term (≤ 2 years) |
| Source: Mordor Intelligence | |||


Surge in BYOD and Mobile Workforce
The endpoint security market is witnessing strong momentum as BYOD policies have exposed roughly 4.7 billion mobile endpoints that sit outside traditional firewalls, prompting rapid deployment of mobile-device-management tools that partition corporate data from personal apps.[1] IBM, “Bring Your Own Device (BYOD) Solutions – MaaS360,” ibm.com Identity compromise now appears in 70% of attacks, so firms lean on zero-trust frameworks that verify device posture before allowing network access. Executives increasingly view cybersecurity as a board-level priority, with 91% describing it as a strategic asset rather than a compliance exercise. AI features embedded in modern endpoint suites perform real-time behavioural analysis to flag risky actions across a diverse device ecosystem.
Escalating Sophistication of Ransomware-as-a-Service
Service-based ransomware lowered the barrier to entry, triggering a 50% spike in infections during early 2024. Healthcare breaches now cost USD 10.1 million on average, forcing hospitals to adopt extended-detection-and-response platforms that correlate endpoint and network telemetry. Double- and triple-extortion tactics also target backups, compelling enterprises to redesign data-recovery plans. Analysts expect ransomware damage to surpass USD 265 billion annually by 2031, funnelling more spend into proactive endpoint defences.
Proliferation of IoT Endpoints Across OT Networks
Industrial firms are connecting sensors, PLCs, and human-machine interfaces that traditionally ran unpatched for decades. Compromises of supervisory-control-and-data-acquisition nodes in energy and manufacturing illustrate the risk. Specialist vendors now ship lightweight agents that deliver deep-packet-inspection visibility without disrupting production. Supplier contracts increasingly require proof of endpoint security certification, embedding cyber controls into procurement processes.
Wider Adoption of SASE Bundling EPP/EDR at Edge
Secure-access-service-edge designs fold networking, zero-trust access, and endpoint security into one cloud platform, a market predicted to exceed USD 25 billion by 2027. EPP and EDR modules delivered via SASE ensure that policies follow users regardless of location, while integrated threat intelligence shrinks response times. Vendors compete on AI enrichment that speeds detection and automates playbook execution.
Restraints Impact Analysis*
| Restraint | (~) % Impact on CAGR Forecast | Geographic Relevance | Impact Timeline |
|---|---|---|---|
| Skill shortage in SOC and incident-response teams | -1.8% | Global, particularly acute in APAC and emerging markets | Medium term (2-4 years) |
| Budget constraints among SMBs | -1.2% | Global, with higher impact in price-sensitive markets | Short term (≤ 2 years) |
| Rising privacy backlash against continuous endpoint telemetry | -0.9% | EU and North America regulatory markets | Long term (≥ 4 years) |
| Supply-chain risk of third-party security agents | -0.7% | Global, with concentration in regulated industries | Medium term (2-4 years) |
| Source: Mordor Intelligence | |||
Skill Shortage in SOC and Incident-Response Teams
The global deficit of 3 million cyber professionals leaves roughly half of chief information security officers anxious about coverage gaps. Managed-detection-and-response (MDR) uptake is therefore accelerating, with half of organizations expected to outsource 24/7 monitoring by 2025. Automation and AI tools that triage alerts and script containment actions are seen as practical stopgaps until the workforce pipeline improves.
Budget Constraints Among SMBs
Ransomware hits 80% of small firms, yet many cannot fund enterprise-grade defences. Service-based licensing models now let SMBs access the same protection stack as large enterprises on an operating-expense basis. Vendors simplify onboarding with guided wizards and pre-tuned policies that reduce administration overhead. Insurers reinforce uptake by granting policy discounts of up to 12.5% when certified EDR controls are in place.
*Our forecasts treat driver/restraint impacts as directional, not additive. The impact forecasts reflect baseline growth, mix effects, and variable interactions.
Segment Analysis
By Solution Type: EDR Acceleration Outpaces Traditional Defenses
Endpoint detection and response products are expanding at 15.52% CAGR, easily eclipsing legacy antivirus tools. Organizations favour behaviour analytics that spotlight zero-day exploits, while firewall/UTM appliances retain 19.58% revenue share thanks to deep integration with existing network gear. Managed-detection-and-response subscriptions are also gaining ground as firms lease expertise rather than build internal security operations centres.
Regulatory scrutiny is breathing life into encryption and data-loss-prevention modules as rules such as GDPR and NIS2 demand demonstrable data-protection controls. Patch-management utilities attract spend because security updates still average a 97-day rollout window, leaving attack surfaces exposed. Application-control tools that block unauthorized software help limit shadow-IT risks for personal devices on corporate networks.


By Deployment Mode: Cloud Dominance Accelerates Digital Transformation
Cloud platforms already command 57.88% of the endpoint security market size in 2025 and will compound 15.01% annually to 2031. Centralized policy engines accelerate rollout across globally distributed devices and feed AI models with large data volumes in real time. Hybrid architectures remain popular for firms facing data-sovereignty rules or specialist operational-technology constraints.
On-premises deployments persist in defence and critical-infrastructure verticals where local processing is mandated. Even there, many teams adopt SASE overlays that couple software-defined networking with cloud-delivered security to simplify administration. Integrated EDR analytics in the cloud reduce dwell time and enhance mean-time-to-respond statistics.
By Organization Size: SME Growth Driven by Accessible Security-as-a-Service
SMEs represent the fastest-growing buyer block at 13.56% CAGR, lured by subscription licences that remove capital-expense hurdles. Automated remediation and guided setup allow firms with minimal security staff to deploy full-stack defences quickly. The endpoint security market continues to lean toward large enterprises, which commanded 62.54% revenue share in 2025, thanks to dedicated IT teams and bigger budgets.
Vendor roadmaps now start with simplified dashboards and “click-to-contain” workflows that cut complexity for resource-constrained buyers. Channel partners and managed-security-service providers position “SOC-in-a-box” bundles that layer managed detection on top of existing endpoint agents. Insurers’ pre-coverage assessments increasingly push SME clients toward adopting these bundles.
By End-User Industry: Healthcare Transformation Leads Digital Security Evolution
Healthcare and life-sciences customers are forecast to log a 12.98% CAGR to 2031 as hospitals digitize diagnostic equipment and patient records. Internet of Medical Things devices create sprawling attack surfaces, and non-stop operations leave limited maintenance windows for patching. Regulators enforce strict data-protection mandates, placing endpoint controls high on compliance checklists.
BFSI stayed the largest revenue generator with a 20.42% share in 2025, reflecting early technology adoption and heavy compliance spend. Manufacturing, energy, and utilities see rising budgets as supervisory-control-and-data-acquisition nodes merge with IT networks. Retailers add controls to point-of-sale devices while education boards safeguard student laptops in hybrid-learning environments.
Geography Analysis
North America maintained 33.12% revenue share in 2025. Deep security budgets, an advanced threat landscape, and early AI adoption fuel ongoing upgrades. Government cloud-security programs and a dense network of vendors create a virtuous innovation cycle.
Europe’s momentum is tied to the full enforcement of the NIS2 directive in October 2024, which compels more than 160,000 organizations to deploy certified endpoint controls or face fines up to EUR 10 million. The regulation keeps demand high across critical infrastructure, manufacturing, and digital services providers.
Asia-Pacific is the fastest-growing territory at 12.22% CAGR. Nations across the region pour investment into cyber-resilience frameworks, and high-profile attacks on telecoms and financial institutions have sharpened executive focus. Chinese security teams rank API exposure as their top concern, with 27% putting it ahead of malware. Government funding and local vendor ecosystems accelerate adoption across Japan, South Korea, Australia, and the ASEAN bloc.
The Middle East and Africa notice rising cyber-insurance premiums and tougher privacy laws, nudging banks and energy operators to upgrade endpoint controls. Latin America expands cloud deployments that leapfrog legacy on-premises estates, particularly in retail and digital-banking firms.

Competitive Landscape
The endpoint security market shows moderate concentration. CrowdStrike, SentinelOne, and Microsoft combine vast telemetry networks with machine-learning pipelines that spot malicious behaviour in under a second, with CrowdStrike demonstrating 100% detection in an independent 2024 enterprise EDR test.[4]CrowdStrike, “CrowdStrike Achieves 100% Detection,” crowdstrike.com IBM, Trend Micro, and Palo Alto Networks round out the top tier, fusing gateway and endpoint analytics into unified consoles.
Strategic alliances tighten hardware–software integration. Lenovo installs SentinelOne agents as a factory default within its ThinkShield business laptops to assure silicon-to-cloud protection. Start-ups pursue niche gaps such as operational-technology visibility or post-quantum encryption; Spectral Capital filed patents for quantum-resistant key exchange in January 2025. Private-equity investors, meanwhile, eye consolidation plays, with managed-security specialists and XDR vendors becoming acquisition targets to build vertically integrated platforms.
Regulatory pressure and publicized breaches intensify vendor roadmaps for automated response, cyber-insurance reporting feeds, and zero-trust network-access hooks. Channel partners now package MDR seats alongside cyber-insurance policies, creating “secure-by-default” bundles for SMEs and remote-first businesses.
Endpoint Security Industry Leaders
Trend Micro Inc.
CrowdStrike Holdings Inc.
SentinelOne Inc.
Sophos Ltd.
Bitdefender LLC
- *Disclaimer: Major Players sorted in no particular order

Recent Industry Developments
- June 2025: NinjaOne acquired Dropsuite for USD 270 million, adding cloud-backup and data-protection functions to its unified endpoint-management stack.
- May 2025: IGEL bought Stratodesk to expand secure thin-client OS offerings and strengthen endpoint-management capabilities.
- March 2025: SentinelOne posted USD 821.5 million FY 2025 revenue, up 32% year-over-year, with its first full year of positive net income and free cash flow.
- March 2025: Japan’s Ministry of Economy, Trade, and Industry released a national cybersecurity promotion strategy prioritizing endpoint protections across critical infrastructure.
- February 2025: OpenText increased Asia-Pacific investment, launching regional cyber-summits that spotlight AI-driven endpoint protection.
- January 2025: Secureworks led Japan’s managed XDR services with a 25.7% market share, reflecting surging demand for managed endpoint security.


Research Methodology Framework and Report Scope
Market Definitions and Key Coverage
Our study defines the global endpoint security market as software and managed-service revenues that protect enterprise-grade endpoint devices such as desktops, laptops, smartphones, servers, and connected IoT nodes from malware, data theft, and post-exploit lateral movement. The scope spans legacy antivirus, Endpoint Detection and Response, Managed Detection and Response, encryption, patch and configuration management, and unified policy orchestration.
Scope Exclusion: Consumer-only antivirus bundles and stand-alone hardware firewalls positioned outside the endpoint layer are not counted.
Segmentation Overview
- By Solution Type
- Antivirus / Anti-malware
- Firewall / UTM
- Endpoint Detection and Response (EDR)
- Managed Detection and Response (MDR)
- Encryption and Data Loss Prevention
- Patch and Configuration Management
- Application and Device Control
- Others
- By Deployment Mode
- On-premises
- Cloud
- Hybrid
- By Organization Size
- Large Enterprises
- Small and Medium-sized Enterprises (SME)
- By End-user Industry
- BFSI
- Government and Defense
- Healthcare and Life Sciences
- Manufacturing
- Energy and Utilities
- Retail and e-Commerce
- IT and Telecom
- Education
- Other End-User Industries
- By Geography
- North America
- United States
- Canada
- Mexico
- South America
- Brazil
- Argentina
- Chile
- Rest of South America
- Europe
- Germany
- United Kingdom
- France
- Italy
- Spain
- Russia
- Rest of Europe
- Asia-Pacific
- China
- India
- Japan
- South Korea
- Australia
- Singapore
- Malaysia
- Rest of Asia-Pacific
- Middle East and Africa
- Middle East
- United Arab Emirates
- Saudi Arabia
- Turkey
- Rest of Middle East
- Africa
- South Africa
- Nigeria
- Rest of Africa
- Middle East
- North America
Detailed Research Methodology and Data Validation
Primary Research
During a twelve-week window, Mordor analysts interviewed CISOs, managed-service architects, and procurement heads across North America, Europe, Asia-Pacific, and the Gulf. Conversations and a structured SME survey validated average selling prices, seat penetration, and upgrade triggers that desk work alone could not surface.
Desk Research
We mapped threat and spend baselines through open data sets from NIST breach logs, ENISA threat landscape notes, U.S. Bureau of Labor ICT spend tables, and device inventories released by Ofcom and TRAI. Company 10-Ks, investor decks, patent clusters via Questel, Volza shipment traces, and news archived in Dow Jones Factiva and D&B Hoovers filled pricing, pipeline, and channel gaps. The sources named illustrate our range, while many other public documents supported evidence gathering.
Market-Sizing & Forecasting
By tying national cybersecurity outlays to installed endpoint stocks, we first rebuilt global spend from the top down. We then cross-checked totals with sampled license volumes and price corridors shared by distributors. Key model variables include average endpoints per employee, ransomware incidence, cloud workload share, BYOD uptake, and compliance deadlines such as NIS2. Multivariate regression, stress-tested through scenario analysis, projects values to 2030, and regional proxies bridge gaps where direct figures are thin.
Data Validation & Update Cycle
Outputs pass automated anomaly flags, peer review, and senior sign-off before publication. Figures refresh each year, with interim updates issued when material events reshape spend.
Why Our Endpoint Security Baseline Commands Reliability
Published estimates often diverge because providers select different device pools, price curves, refresh cadences, and currency locks. According to Mordor Intelligence, disciplined scope choices and dual-path validation keep our baseline balanced and reproducible.
Benchmark comparison
| Market Size | Anonymized source | Primary gap driver |
|---|---|---|
| USD 21.02 B (2025) | Mordor Intelligence | - |
| USD 27.46 B (2025) | Global Consultancy A | Counts device-management revenue and POS terminals |
| USD 18.36 B (2024) | Trade Journal B | Omits MDR service revenue, older base year |
| USD 17.43 B (2023) | Industry Forecast C | Limited geography and dated FX rates |
These contrasts show how Mordor's annually refreshed, variable-driven model offers decision-makers a dependable starting point.


Key Questions Answered in the Report
What is driving the double-digit growth of the endpoint security market?
Remote work, BYOD expansion, and ransomware-as-a-service are widening attack surfaces, prompting enterprises to adopt AI-powered EDR, zero-trust access and cloud-delivered controls that push the market to an 11.04% CAGR.
Why are cloud deployments overtaking on-premises endpoint security solutions?
Cloud platforms centralize policy enforcement, feed ML models with real-time telemetry and remove hardware refresh cycles, helping them reach 57.88% market share in 2025 and grow 15.01% annually to 2031.
How does the NIS2 directive affect European endpoint security spend?
NIS2 obliges more than 160,000 entities to install certified controls or face multimillion-euro fines, ensuring steady demand across 15 critical-infrastructure sectors.
Which industry vertical is projected to record the fastest endpoint security growth?
Healthcare and life sciences should post a 12.98% CAGR as connected medical devices, strict privacy laws and high breach costs accelerate investment.
Are SMEs adopting enterprise-grade endpoint protection?
Yes. Subscription MDR bundles and simplified dashboards let SMEs close capability gaps, driving their segment’s 13.56% CAGR through 2031.
What strategic moves are market leaders making to stay ahead?
Top vendors integrate hardware-level security, automate response workflows with AI and acquire complementary technologies—such as NinjaOne’s purchase of Dropsuite—to broaden platform reach.
Page last updated on:


