Metamaterials Market Size and Share
Market Overview
| Study Period | 2020 - 2031 |
|---|---|
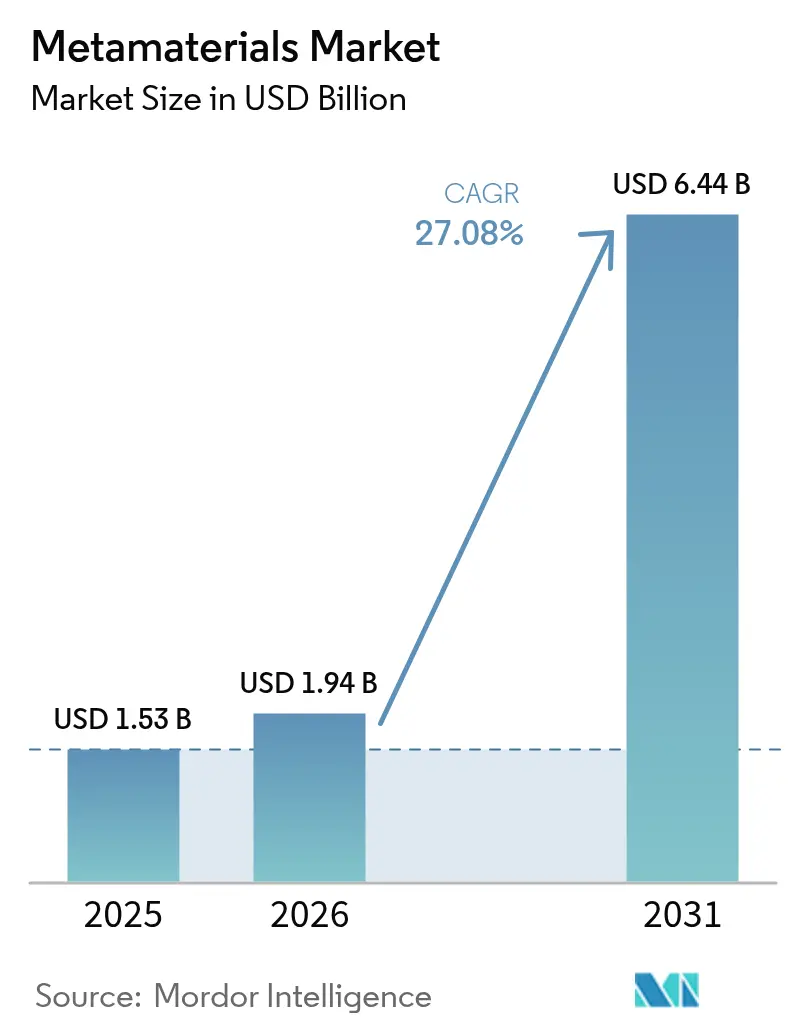
| Market Size (2026) | USD 1.94 Billion |
| Market Size (2031) | USD 6.44 Billion |
| Growth Rate (2026 - 2031) | 27.08% CAGR |
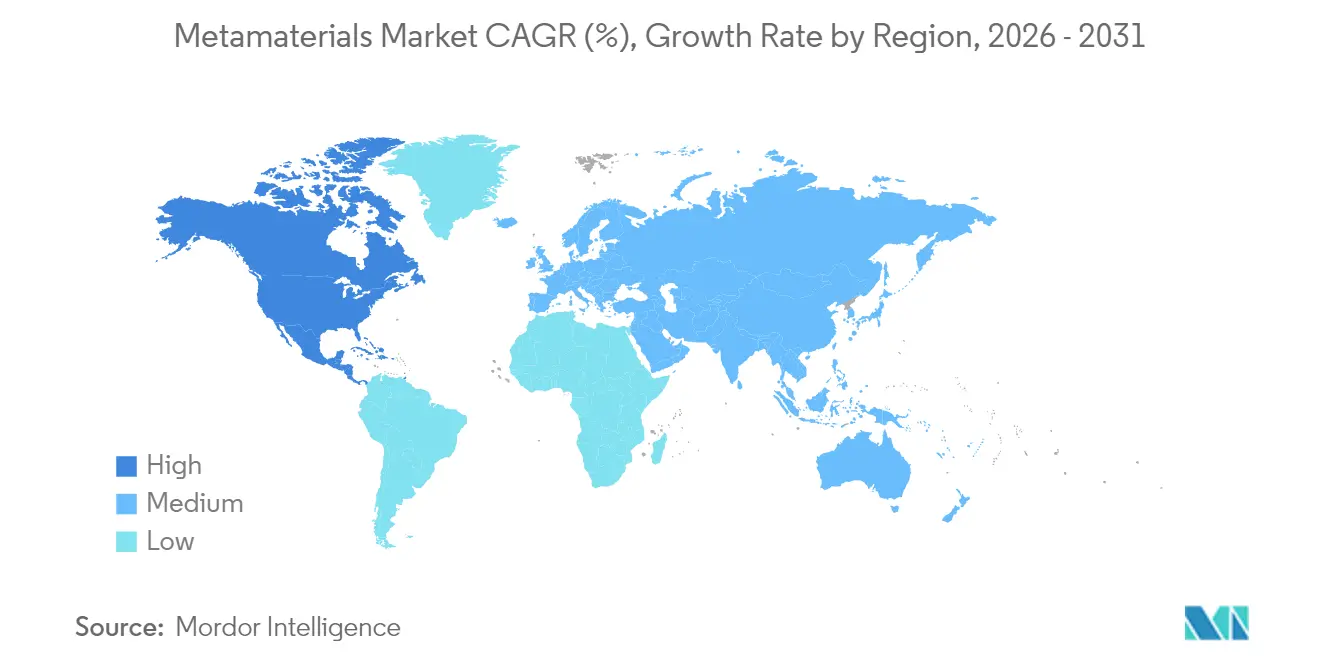
| Fastest Growing Market | North America |
| Largest Market | North America |
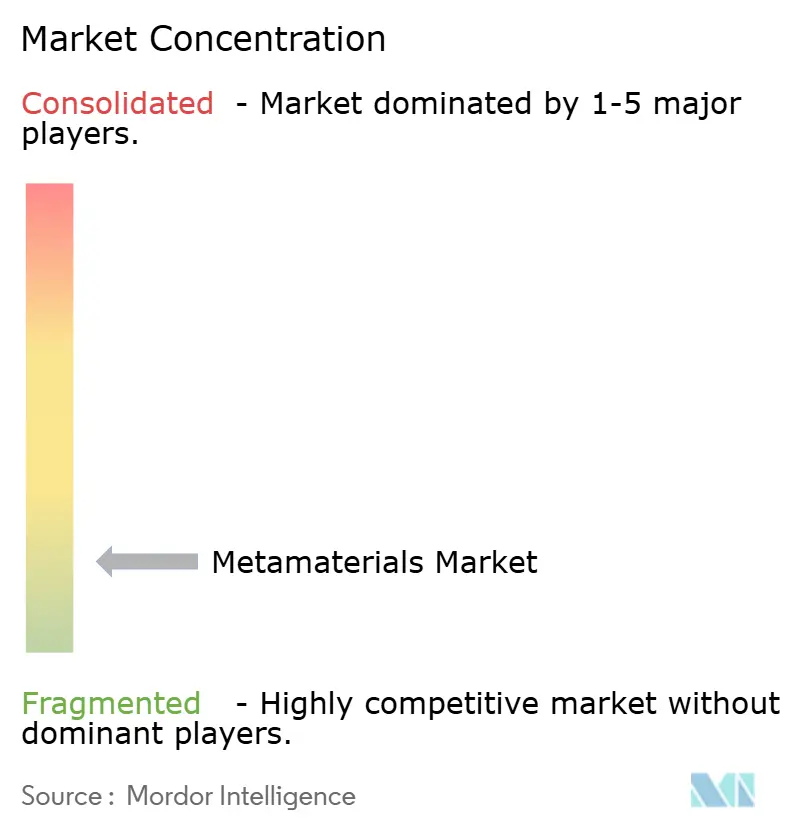
| Market Concentration | Low |
Major Players *Disclaimer: Major Players sorted in no particular order Image © Mordor Intelligence. Reuse requires attribution under CC BY 4.0. | |
Metamaterials Market Analysis by Mordor Intelligence
Metamaterials market size in 2026 is estimated at USD 1.94 billion, growing from 2025 value of USD 1.53 billion with 2031 projections showing USD 6.44 billion, growing at 27.08% CAGR over 2026-2031. North America holds the leading 35.88% regional slice and is also the fastest-growing territory, propelled by a 28.92% CAGR through 2030. Demand pivots on 5G/6G roll-outs, defense stealth requirements, and energy-efficient devices. Electromagnetic metamaterials account for 44.19% of revenue thanks to their versatile role in antennas and frequency-selective surfaces. Antenna and radar systems already command 62.94% of spending, and aerospace and defense buyers contribute 54.19% of end-user demand. The competitive field remains fragmented as niche specialists commercialize proprietary designs. High fabrication costs and limited standardization still curb wider uptake, but rapid advances in additive manufacturing and nanofabrication are narrowing these constraints.
Key Report Takeaways
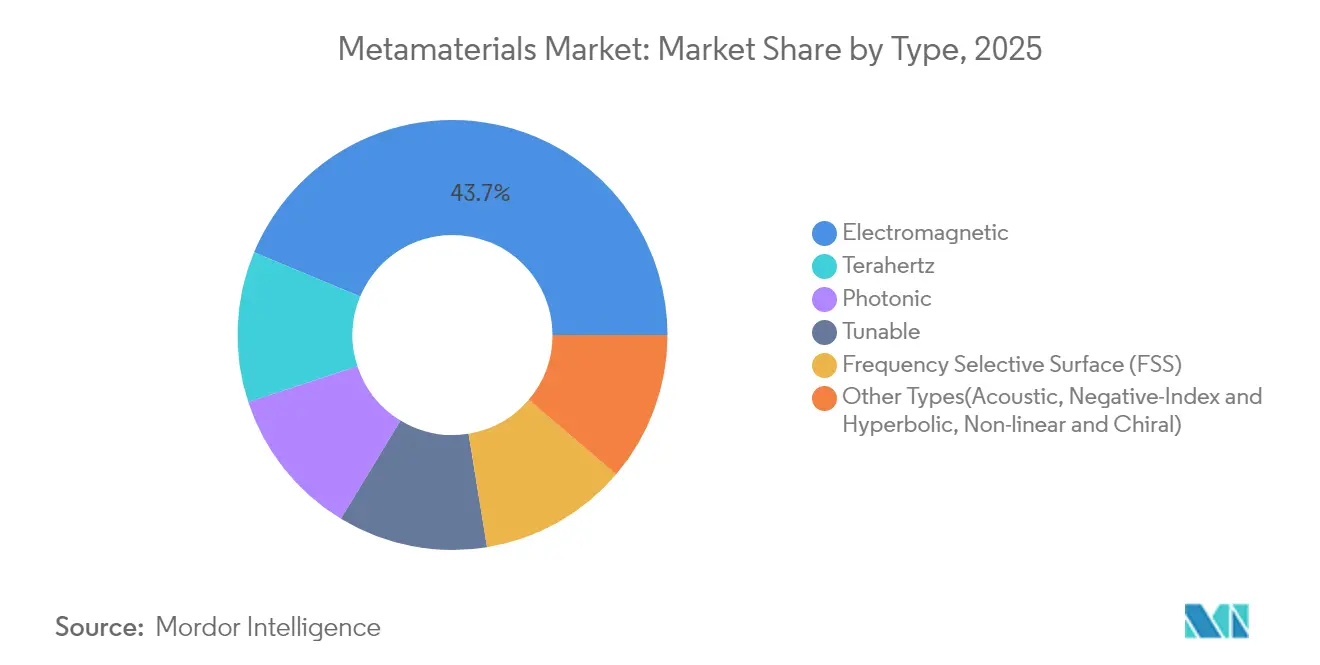
- By type, electromagnetic metamaterials market led with 43.72% revenue share in 2025 and are projected to grow at a 28.85% CAGR through 2031.
- By application, antenna and radar systems captured 62.47% of the metamaterials market share in 2025 and are expanding at a 28.94% CAGR to 2031.
- By end-user industry, aerospace and defense held 53.40% of the metamaterials market size in 2025 and is set to post a 30.05% CAGR through 2031.
- By region, North America controlled 35.45% of 2025 revenues in metamaterials market while Asia-Pacific records the second-fastest CAGR through 2031 at 27.72%.
Note: Market size and forecast figures in this report are generated using Mordor Intelligence’s proprietary estimation framework, updated with the latest available data and insights as of 2026.
Global Metamaterials Market Trends and Insights
Driver Impact Analysis*
| Driver | (~) % Impact on CAGR Forecast | Geographic Relevance | Impact Timeline |
|---|---|---|---|
| 5G and 6G network expansion | +1.5% | North America, Europe, East Asia | Medium term (2-4 years) |
| Nanotechnology and material-science advances | +1.2% | Global; R&D hubs in North America and Europe | Medium term (2-4 years) |
| Quantum computing and photonics convergence | +0.9% | North America, Europe, East Asia | Long term (≥ 4 years) |
| Aerospace and defense demand | +1.3% | North America, Europe | Short term (≤ 2 years) |
| Energy-efficiency and sustainability focus | +0.8% | Global | Long term (≥ 4 years) |
| Source: Mordor Intelligence | |||


Expansion of 5G and 6G Network Plan: Metamaterials Enabling Next-Generation Connectivity
Metamaterial-based antennas are redefining millimeter-wave transmission by compressing beam-steering hardware into ultra-thin layers while sustaining multi-gigabit throughput. A digitally coded metasurface demonstrated at 60 GHz produced multiple simultaneous beams, a capability that mitigates urban signal blockage and underpins 6G reliability. Satellite links profit as well; 2D metasurfaces boost link budgets for non-terrestrial 5G/6G coverage. Commercial vendors have moved beyond lab prototypes, with hybrid satellite terminals integrating reconfigurable intelligent surfaces to secure uninterrupted connectivity for mobile platforms. This marriage of low-profile hardware and software-defined control positions the metamaterials market for sustained telecom spending as carriers densify high-band networks worldwide.
Advancements in Nanotechnology and Material Science: Precision Engineering at Atomic Scale
Federal programs request USD 2.2 billion for 2025 under the National Nanotechnology Initiative, lifting cumulative outlays above USD 45 billion and furnishing shared infrastructure for atomic-scale fabrication [1]National Nanotechnology Initiative, “NNI FY25 Budget Supplement,” nano.gov. Layer-by-layer additive methods now build graded index profiles that vary continuously across a surface, giving engineers a toolbox for tailoring phase, amplitude, and polarization locally. Such precision accelerates the insertion of metamaterials into structural health monitors, biomedical implants, and automotive radar housings. Early production trials using 3D-printed interlocking blocks to create frequency-selective absorbers reached 99.5% absorptivity while reducing tooling steps. These breakthroughs lower entry barriers and make volume output feasible for mainstream device makers over the medium term.
Growing Advancements in Quantum Computing and Photonics: Convergence Creating New Possibilities
Photonic metamaterials furnish the precise dispersion control required for low-loss qubit interconnects and sub-diffraction imaging within quantum processors. Research funding of USD 43.7 million at Boston University Photonics Center underscores the surge of interest in nanophotonics platforms that merge metamaterials with on-chip photonics. CERN scientists employ photonic crystals to refine particle detection sensitivity, illustrating how negative-index lattices can concentrate faint quantum signatures into readable signals. Graphene-based terahertz surfaces further extend quantum sensor bandwidths for biochemical analytics . As quantum roadmaps mature, these cross-disciplinary synergies propel the metamaterials market into new high-value niches.
Increasing Demand from the Aerospace and Defense Industry: Strategic Applications Driving Adoption
Stealth coatings, electronically steered antennas, and frequency-agile radomes make metamaterials indispensable to modern defense platforms. Fielded gear such as the Goshawk u8 antenna validates mass-manufacturing at commercial standards while satisfying stringent military reliability thresholds. Performance leaps include antenna gain boosts from 6 dB to 27 dB, translating into longer communication ranges and reduced probability of intercept. Defense prime contractors now embed metasurface suppliers in long-term agreements, ensuring a pipeline for lightweight components that survive extreme vibration and temperature swings. These partnerships cement aerospace and defense as the anchor segment for near-term revenue growth.
Restraint Impact Analysis*
| Restraint | (~) % Impact on CAGR Forecast | Geographic Relevance | Impact Timeline |
|---|---|---|---|
| Awareness gap on metamaterial benefits | –0.7% | Emerging Asia-Pacific, Latin America | Short term (≤ 2 years) |
| High synthesization cost | –1.1% | Global; acute in price-sensitive regions | Medium term (2-4 years) |
| Durability and standardization uncertainty | –0.6% | Global | Medium term (2-4 years) |
| Source: Mordor Intelligence | |||
Lack of Awareness of Benefits of Metamaterials: Knowledge Gap Limiting Market Penetration
Complex wave-physics concepts deter decision-makers in sectors without dedicated R&D budgets. The U.S. National Science Foundation earmarked USD 386.67 million for advanced manufacturing workforce programs to bridge this gap with hands-on training [2]National Science Foundation, “FY 2025 Budget Request to Congress,” nsf.gov. Demonstration projects that visualize gains in antenna miniaturization or noise attenuation are widening adoption, yet smaller firms in Latin America and parts of Southeast Asia still face steep learning curves.
Cost of Synthesization of Metamaterials: Economic Barriers to Commercialization
High-precision lithography, exotic feedstock, and low yield rates inflate unit prices, confining commercial roll-outs to defense and telecom flagships. Modular 3D-printed frequency-selective surfaces cut assembly steps, signaling a path to scalable production at lower capital intensity. Broader diffusion will hinge on further cost compression and licensing frameworks that let OEMs embed metasurfaces without erecting bespoke clean-rooms.
*Our forecasts treat driver/restraint impacts as directional, not additive. The impact forecasts reflect baseline growth, mix effects, and variable interactions.
Segment Analysis
By Type: Electromagnetic Metamaterials Sustain Market Leadership
Electromagnetic variants accounted for 43.72% of 2025 revenue and are forecast to expand at 28.85% CAGR, reinforcing their role as the cornerstone of the metamaterials market. Their integration into frequency-selective panels, phased-array antennas, and negative-index lenses drives pervasive demand across telecom and defense. In value terms, this cohort represented USD 668.92 million of the metamaterials market size and is on track to cross USD 3.06 billion by 2031. The rise of terahertz detection, powered by graphene resonators with heightened biochemical sensitivity, amplifies future opportunities.
Emerging niches such as acoustic, hyperbolic, and negative-index formats broaden the functional palette. Acoustic structures dampen machinery vibration in industrial plants, supported by EU-funded METAVISION trials. Hyperbolic slabs channel sub-diffraction photons for super-resolution imaging, an asset in medical diagnostics. Hybrid stacks that fuse multiple classes unlock multi-modal control over sound, heat, and light within a single laminate. Research interest therefore accelerates diversification while reinforcing electromagnetic dominance at scale, boosting activity in the metamaterials market.


By Application: Antenna and Radar Systems Drive Revenue Expansion
Antenna and radar deployments translated into 62.47% of the metamaterials market share. Gain improvements up to 27 dB and reduced profile height meet stringent 5G, 6G, and satellite link budgets. This application is slated to compound at 28.94% through 2031, taking the lion’s share of incremental revenue. Sensors hold the second-largest slot, buoyed by dual-band absorbers exceeding 99% absorption in the S and C bands.
Cloaking devices, although nascent, capture defense R&D funds for low-observable platforms. Superlenses challenge optical diffraction limits, gaining traction in non-invasive biomedical imaging. Light and sound filters that exploit angular-stable surfaces convert linear to circular polarization in 5G bands, essential for dense urban networks. Solar-energy harvesters and electromagnetic absorbers round out a diversified pipeline, illustrating the broadening footprint of the metamaterials market.
By End-User Industry: Aerospace and Defense Maintains Strategic Dominance
Aerospace and defense accounted for 53.40% of segment revenue in 2025 and will grow at a 30.05% CAGR through 2031. Performance-critical missions adopt metasurface antennas such as the Goshawk u8 to assure encrypted multi-orbit connectivity. Telecommunications follows as operators retrofit existing towers with low-profile panels that mitigate beam squint across mmWave spectra, further supporting expansion of the metamaterials market.
Electronics OEMs employ conductive grids and loops patterned on thin laminates to suppress electromagnetic interference inside laptops and wearables, a trend supported by patents describing tunable frequency-selective responses. Healthcare innovators adapt metamaterial stents that adjust compliance in sync with arterial pulses. Automotive, energy, and consumer electronics segments collectively contribute a growing revenue tail as industry awareness matures, rising opportunities in the metamaterials market.

Geography Analysis
North America translated a 35.45% stake and the highest regional CAGR of 28.31%. Federal investments of USD 386.67 million for advanced manufacturing and workforce programs reinforce a robust innovation ecosystem. Concentrated aerospace, defense, and telecom primes guarantee early-stage demand, enabling local suppliers to refine mass-production methods.
Asia-Pacific follows as industrialization and electronics capacity converge with sizable public funding. China’s strategic technology plans channel resources into 6G and satellite networks, accelerating local adoption of metasurfaces for base-station and handset antennas. India’s electronics output grew from INR 5.54 lakh crore (USD 76 billion) in FY 2020-21 to INR 9.52 lakh crore (USD 115 billion) in FY 2023-24 under the PLI scheme, providing fertile ground for semiconductor-grade metamaterial components. Japan and South Korea refine high-frequency radar absorbers for autonomous vehicles and smart factories.
Europe commands a sizeable share thanks to public-private programs targeting advanced materials under the UK Innovation Strategy and Germany’s Industry 4.0 roadmap. Field trials in low-field MRI and industrial noise abatement testify to a thriving collaboration network. Policy frameworks emphasize open test beds and standardization, steering the metamaterials market toward cross-border scalability.
South America and the Middle East & Africa represent emerging frontiers, leveraging metamaterial-enhanced telecom backbones to leapfrog legacy infrastructure. Energy-harvesting metasurfaces that power remote sensor nodes align with regional off-grid electrification priorities, signaling untapped potential once cost barriers abate.

Competitive Landscape
Competitive Landscape
The metamaterials market is fragmented in nature and is characterized by a mix of boutique inventors, university spin-offs, and established defense and telecom suppliers, leveraging proprietary design algorithms, tunable substrates, and integrated pilot lines for competitive advantage. Kymeta's Goshawk u8 demonstrates scalable metasurface panels for military and civil satellite broadband applications. Strategic partnerships, such as Multiwave Technologies' collaboration with Aix-Marseille University to miniaturize portable MRI scanners using metamaterial coils, highlight academia-industry synergy. Patent filings on conductive grids with dielectric spacers underscore the race for tunable frequency-selective filters critical for 5G beam-forming modules. Large OEMs are pursuing acquisitions to integrate metasurfaces into products like smartphones, phased-array radars, and EV battery thermal managers. As costs decline and standards mature, the market is expected to consolidate, transitioning from fragmented labs to dominant integrated suppliers over the forecast period.
Metamaterials Industry Leaders
Kymeta Corporation
Echodyne Corp.
TeraView Limited
NKT Photonics A/S
Meta Materials Inc.
- *Disclaimer: Major Players sorted in no particular order

Recent Industry Developments
- April 2025: MIT engineers have developed a method to print strong, stretchable synthetic "metamaterials," enabling applications like tear-proof textiles and flexible semiconductors.
- November 2024: Kymeta Corporation launched the Goshawk u8, a hybrid GEO-LEO flat-panel antenna. Featuring proprietary metasurface technology, it ensures seamless communication across geostationary, low-Earth orbit, and cellular networks.


Global Metamaterials Market Report Scope
Metamaterials are engineered composites designed to alter the electromagnetic properties of materials to obtain responses that are not observed naturally.
The Metamaterials Market is segmented by type, application, end-user industry, and geography. By type, the market is segmented into electromagnetic, terahertz, tunable, photonic, FSS, and other types. By application, the market is segmented into antenna and radar, sensors, cloaking devices, superlens, light and sound filtering, and other applications. By end-user industry, the market is segmented into healthcare, telecommunication, aerospace and defense, electronics, and other end-user industries. The report also covers the size and forecasts for the market in 16 countries across major regions. The report offers market size and forecasts for all the above segments in terms of revenue (USD million).
| Electromagnetic |
| Terahertz |
| Photonic |
| Tunable |
| Frequency Selective Surface (FSS) |
| Other Types(Acoustic, Negative-Index and Hyperbolic, Non-linear and Chiral) |
| Antenna and Radar |
| Sensors |
| Cloaking Devices |
| Superlens |
| Light and Sound Filtering |
| Other Applications (Solar, Absorbers, etc.) |
| Aerospace and Defense |
| Telecommunications |
| Electronics |
| Healthcare |
| Other End user Industries (Automotive and Transportation, Energy and Power, etc.) |
| Asia-Pacific | China |
| India | |
| Japan | |
| South Korea | |
| Rest of Asia-Pacific | |
| North America | United States |
| Canada | |
| Mexico | |
| Europe | Germany |
| United Kingdom | |
| France | |
| Italy | |
| Spain | |
| Rest of Europe | |
| South America | Brazil |
| Argentina | |
| Rest of South America | |
| Middle East and Africa | Saudi Arabia |
| South Africa | |
| Rest of Middle East Africa |
| By Type | Electromagnetic | |
| Terahertz | ||
| Photonic | ||
| Tunable | ||
| Frequency Selective Surface (FSS) | ||
| Other Types(Acoustic, Negative-Index and Hyperbolic, Non-linear and Chiral) | ||
| By Application | Antenna and Radar | |
| Sensors | ||
| Cloaking Devices | ||
| Superlens | ||
| Light and Sound Filtering | ||
| Other Applications (Solar, Absorbers, etc.) | ||
| By End-user Industry | Aerospace and Defense | |
| Telecommunications | ||
| Electronics | ||
| Healthcare | ||
| Other End user Industries (Automotive and Transportation, Energy and Power, etc.) | ||
| By Geography | Asia-Pacific | China |
| India | ||
| Japan | ||
| South Korea | ||
| Rest of Asia-Pacific | ||
| North America | United States | |
| Canada | ||
| Mexico | ||
| Europe | Germany | |
| United Kingdom | ||
| France | ||
| Italy | ||
| Spain | ||
| Rest of Europe | ||
| South America | Brazil | |
| Argentina | ||
| Rest of South America | ||
| Middle East and Africa | Saudi Arabia | |
| South Africa | ||
| Rest of Middle East Africa | ||


Key Questions Answered in the Report
What is the current Metamaterials Market size?
The metamaterials market stands at USD 1.94 billion in 2026.
Which region leads the metamaterials market?
North America holds the largest 35.45% share and posts the highest regional CAGR of 28.31% through 2031
Which application area generates the most revenue?
Antenna and radar systems account for 62.47% of 2025 spending and grow at 28.94% CAGR to 2031.
Why are aerospace and defense companies adopting metamaterials?
Metamaterials enable stealth coatings, high-gain low-profile antennas, and frequency-agile radomes that can withstand harsh mission environments.
Page last updated on:


