Market Overview
| Study Period | 2021 - 2031 |
|---|---|
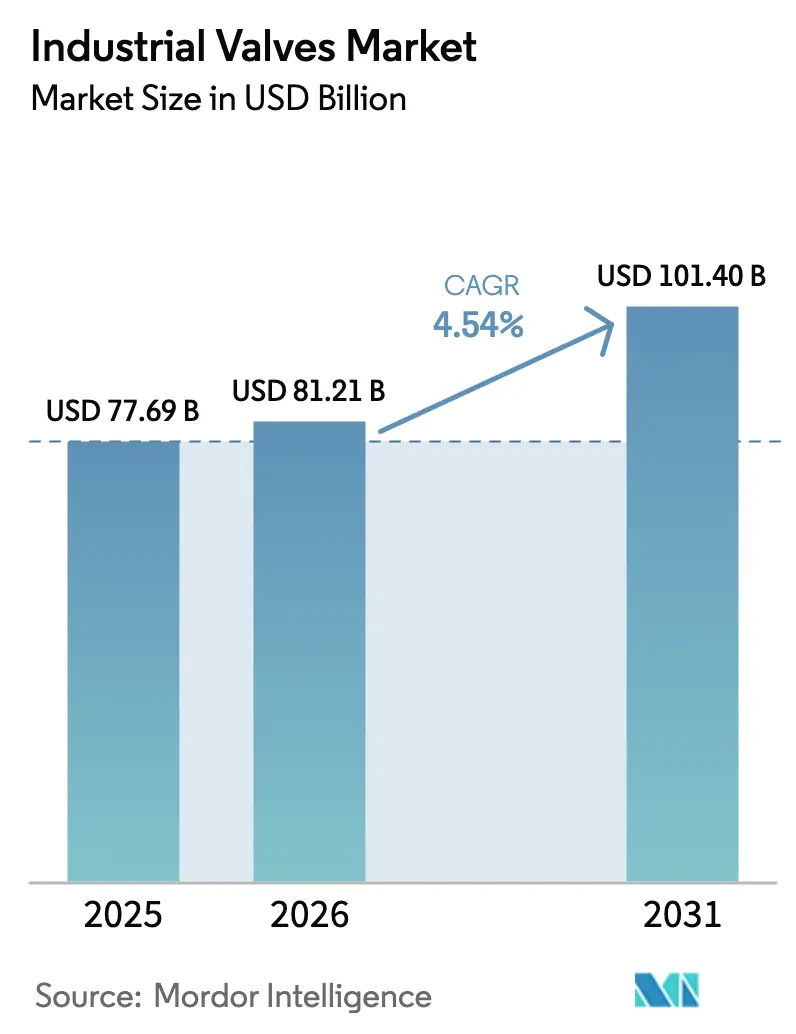
| Market Size (2026) | USD 81.21 Billion |
| Market Size (2031) | USD 101.40 Billion |
| Growth Rate (2026 - 2031) | 4.54% CAGR |
| Fastest Growing Market | Middle East and Africa |
| Largest Market | Asia Pacific |
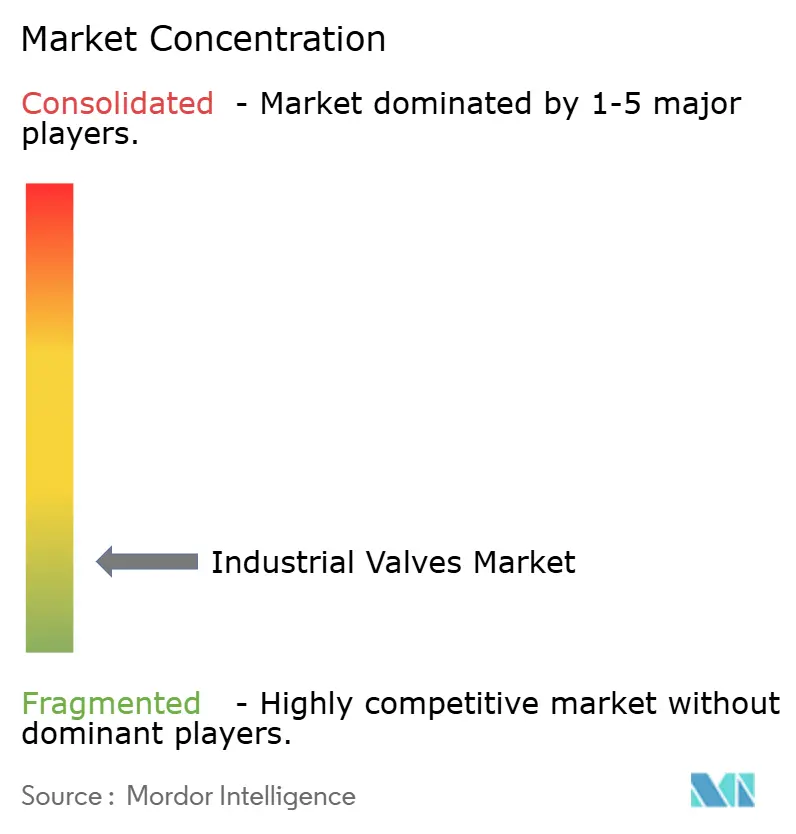
| Market Concentration | Low |
Major Players *Disclaimer: Major Players sorted in no particular order Image © Mordor Intelligence. Reuse requires attribution under CC BY 4.0. | |
Industrial Valves Market Analysis by Mordor Intelligence
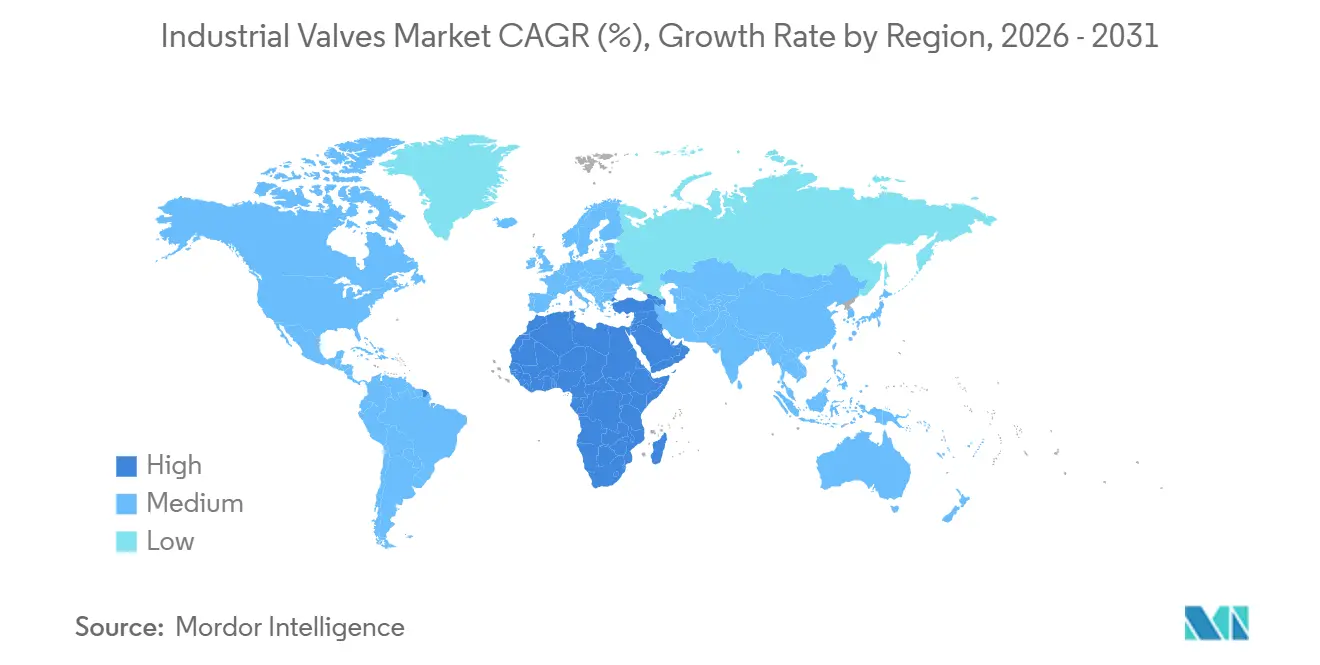
The Industrial Valves Market size is expected to increase from USD 77.69 billion in 2025 to USD 81.21 billion in 2026 and reach USD 101.40 billion by 2031, growing at a CAGR of 4.54% over 2026-2031. LNG build-outs, desalination mega-projects, hydrogen and carbon-capture networks, and the surge in semiconductor fabs are steering capital toward specialized valves that can withstand cryogenic temperatures, ultra-high pressures, and ultrapure media. These greenfield assets command premium pricing and longer lead times, shifting revenue mix away from commodity replacements. Asia-Pacific dominates the industrial valves market with 40.47% revenue share in 2025, anchored by new LNG terminals in Singapore, Thailand, and Indonesia. Meanwhile, the Middle East and Africa is the fastest-growing region at a 6.57% CAGR through 2031, buoyed by the UAE’s USD 920 million Hassyan and Qatar’s USD 2.8 billion Facility E desalination projects. Ball valves hold 40.48% of the type segment, yet check valves are expanding at 7.18% CAGR as operators retrofit for stricter fugitive-emission limits.
Key Report Takeaways
- By type, ball valves led with 40.48% revenue share in 2025; check valves are forecast to expand at a 7.18% CAGR to 2031.
- By product category, quarter-turn valves accounted for 55.18% of the industrial valves market share in 2025, while multi-turn valves are projected to grow at a 5.81% CAGR through 2031.
- By valve function, isolation valves commanded 61.17% of the industrial valves market size in 2025; check and safety valves are advancing at a 6.66% CAGR through 2031.
- By body material, steel held 45.22% of 2025 revenue, whereas alloy-based bodies are progressing at a 7.71% CAGR to 2031.
- By application, oil and gas captured 41.18% of 2025 revenue; the new-energy segment is the fastest-growing at 9.22% CAGR through 2031.
- By geography, Asia-Pacific represented 40.47% of 2025 demand, and the Middle East and Africa region is set to post a 6.57% CAGR to 2031.
Note: Market size and forecast figures in this report are generated using Mordor Intelligence’s proprietary estimation framework, updated with the latest available data and insights as of January 2026.
Global Industrial Valves Market Trends and Insights
Drivers Impact Analysis*
| Driver | (~) % Impact on CAGR Forecast | Geographic Relevance | Impact Timeline |
|---|---|---|---|
| LNG-terminal build-outs across APAC | +1.20% | APAC core, spill-over to Oceania | Medium term (2-4 years) |
| Desalination CAPEX surge in GCC states | +0.90% | Middle East (Saudi Arabia, UAE, Qatar) | Long term (≥ 4 years) |
| Predictive-maintenance-driven replacement cycles in NA chemical sector | +0.70% | North America, Western Europe | Short term (≤ 2 years) |
| Hydrogen & CCS mega-projects demanding ultra-high-pressure valves | +1.10% | Global, with early concentration in EU, North America, Australia | Long term (≥ 4 years) |
| Semiconductor-fab ultrapure-valve boom | +0.60% | APAC (Taiwan, South Korea, Japan), North America (Arizona, Texas) | Medium term (2-4 years) |
| Source: Mordor Intelligence | |||


LNG-Terminal Build-Outs Across APAC
Singapore's Energy Market Authority awarded the country's second LNG terminal contract in 2024, specifying a floating storage and regasification unit with 200,000 cubic meters of storage and 5 million tonnes per annum throughput, operational by the end of the decade. Moreover, Thailand’s 7.5 million tpa Nong Fab facility and Indonesia’s 3.8 million tpa Tangguh Train 3 collectively require thousands of cryogenic ball and butterfly valves rated for −162°C service. Nickel-alloy supply constraints are stretching lead times to 24 weeks, favoring OEMs with captive foundries. Specification drift toward ASME B16.34-qualified nickel-alloy bodies is lifting average selling prices, bolstering margin potential for integrated suppliers in the industrial valves market.
Desalination CAPEX Surge in GCC States
The UAE's Hassyan desalination plant, awarded in early 2025 with a USD 920 million EPC contract, will produce 180 million imperial gallons per day by 2027 and stood 55% complete as of February 2025, employing reverse-osmosis technology that demands corrosion-resistant duplex-steel valves for high-salinity brine handling[1]Zawya, “GCC Desalination Projects Pipeline,” zawya.com. Each plant needs 2,000–3,000 duplex-steel gate and butterfly valves to handle high-salinity brine. Local foundry shortages push utilities to pre-qualify European and North American vendors, reallocating regional spend and creating joint-venture openings that enhance Gulf prospects for the industrial valves market.
Predictive-Maintenance-Driven Replacement Cycles in North American Chemicals
IoT positioners feeding cloud analytics compress replacement intervals from 10–12 years to 7–9 years, accelerating demand for smart globe and control valves[2]United States Environmental Protection Agency, “Final Methane Rule 2024,” epa.gov. The U.S. methane rule imposes quarterly leak surveys and fines, incentivizing early retirement of high-bleed valves. Large petrochemical operators adopt low-emission packings despite a 25% price premium, while smaller players defer, creating a two-speed purchasing pattern within the industrial valves market.
Hydrogen & CCS Mega-Projects Demanding Ultra-High-Pressure Valves
The UK's H2NorthEast project received Section 35 Direction approval in November 2024, paving the way for a hydrogen pipeline network linking Teesside industrial clusters to offshore storage caverns, a system requiring valves rated for 1,000 bar to 1,034 bar to handle compressed hydrogen without embrittlement. Weld-qualified labor shortages delay schedules by 6–9 months, steering EPC contractors toward pre-assembled valve skids. This trend is consolidating project awards among a handful of high-capability suppliers in the industrial valves market.
Restraints Impact Analysis*
| Restraint | (~) % Impact on CAGR Forecast | Geographic Relevance | Impact Timeline |
|---|---|---|---|
| Nickel-alloy casting shortages extending lead-times | -0.80% | Global, acute in North America and Europe | Short term (≤ 2 years) |
| Stricter fugitive-emission testing costs for SMEs | -0.50% | North America, EU, with gradual adoption in APAC | Medium term (2-4 years) |
| Rapid shift to electric actuators cannibalising manual-valve demand | -0.30% | Global, led by North America and Western Europe | Long term (≥ 4 years) |
| Source: Mordor Intelligence | |||
Nickel-Alloy Casting Shortages Extending Lead Times
Indonesia's 2020 nickel-ore export ban, extended through 2024 and 2025, and the Philippines' parallel restrictions have concentrated 70% to 80% of global refined-nickel output in China, creating a chokepoint for duplex and Inconel valve castings that require nickel content above 20%. Smaller fabricators lacking the balance-sheet strength to pre-purchase nickel are exiting specialty-alloy segments, ceding market share to vertically integrated players such as Flowserve and Velan that operate captive foundries or hold multi-year supply agreements. This consolidation dynamic is likely to persist until new nickel-refining capacity in Indonesia and the Philippines comes online in 2027 to 2028.
Stricter Fugitive-Emission Testing Costs for SMEs
The US EPA's December 2024 methane rule introduced a Super-Emitter Response Program requiring facilities to repair leaks detected by third-party satellite or aerial surveys within 5 days for emissions above 100 kilograms per hour, a threshold that captures valve-stem leaks in older gate and globe designs. Consequently, smaller suppliers are consolidating SKU portfolios or exiting regulated markets, while larger OEMs amortize testing costs across higher production volumes. This regulatory asymmetry is accelerating market concentration, with the top 5 valve suppliers projected to capture an additional 3% to 5% share by 2028.
*Our forecasts treat driver/restraint impacts as directional, not additive. The impact forecasts reflect baseline growth, mix effects, and variable interactions.
Segment Analysis
By Type: Ball Valves Dominate, Check Valves Surge on Safety Mandates
Ball valves captured 40.48% of market share in 2025, reflecting their quarter-turn simplicity and tight shut-off in oil, gas, and chemical applications, while check valves are expanding at 7.18% CAGR through 2031, the fastest rate among valve types. This acceleration stems from process-safety regulations mandating backflow prevention in hydrogen pipelines and CCS networks, where reverse flow can trigger catastrophic pressure excursions. Butterfly valves serve large-diameter, low-pressure water and wastewater systems, offering cost advantages over gate valves in municipal projects, yet their share remains stable as operators prioritize ball valves for critical isolation duties.
Steeper fire-safe and low-emission revisions to API 6D now favor ball-valve geometries, while dual-plate check valves protect LNG cryogenic pumps during emergency shutdowns. Butterfly valves retain water-sector relevance, and gate valves persist in high-pressure steam service. Plug valves capture slurry niches, rounding out the industrial valves market landscape for flow-control types.


By Product (Motion): Quarter-Turn Speed Versus Multi-Turn Precision
Quarter-turn valves held 55.18% share in 2025, a dominance rooted in their rapid actuation—90 degrees from open to closed—that reduces cycle time in automated batch processes and emergency shutdown systems. Multi-turn valves are projected to grow at a 5.81% CAGR as hydrogen and CCS projects specify gate and globe designs for sealing under 1,000-bar loads.
The shift toward electric actuators is reshaping product-mix economics. Emerson's Q3 2024 earnings call highlighted a 12% year-over-year increase in electric-actuator attachments for multi-turn valves, driven by petrochemical complexes replacing pneumatic systems to eliminate instrument-air compressors and reduce energy consumption by 15% to 20%. ISO 5211 mounting versatility keeps quarter-turn devices popular in retrofit work, while custom kits add cost complexity to multi-turn upgrades, shaping product-choice dynamics across the industrial valves market.
By Valve Function: Isolation Leads, Check and Safety Accelerate
Isolation valves commanded 61.17% of the functional share in 2025, reflecting their ubiquity in on-off service across every end-use sector, from crude-oil pipelines to municipal water distribution. Regulation valves, including control and throttling variants, serve continuous-process industries—pulp and paper, pharmaceuticals, power generation, where maintaining setpoint within ±2% is critical to product quality and thermal efficiency.
Isolation valves benefit from the broadest application base, yet their commodity nature—many ball and gate valves compete on price rather than performance—limits margin expansion. Regulation valves, by contrast, command 30% to 50% higher unit prices due to precision trim and positioner integration, yet their market share remains constrained by the capital intensity of continuous-process industries. Check valves occupy a middle ground: lower unit prices than regulation valves but higher volumes than safety valves, with dual-plate and tilting-disc designs gaining share in LNG service due to their compact footprint and low-pressure drop.
By Body Material: Alloy-Based Variants Outpace Steel on Corrosion Demands
Steel-bodied valves retained 45.22% share in 2025, split roughly evenly between carbon steel (ASTM A216 WCB) for non-corrosive hydrocarbon and water service, and austenitic stainless steel (316/316L) for mildly corrosive chemical and food-processing applications. Cast and ductile iron valves serve low-pressure municipal water and wastewater systems, where cost per valve is paramount, and corrosion rates are manageable with cement or epoxy linings. However, alloy variants such as duplex 2205, Inconel 625, and 9% nickel steel will climb at a 7.71% CAGR as LNG and green-hydrogen assets demand elevated corrosion resistance.
Duplex stainless steels (2205, 2507) combine the corrosion resistance of austenitic grades with the strength of ferritic grades, allowing thinner-walled, lighter-weight valve bodies that reduce material costs by 15% to 20% relative to solid Inconel, yet their weldability challenges, requiring post-weld heat treatment to restore corrosion resistance, limit adoption in field-fabricated piping. Inconel and Hastelloy remain indispensable for sour-gas and supercritical-CO₂ service. Indonesia’s ore ban places procurement risk squarely on nickel-intensive alloys, influencing sourcing strategies within the industrial valves market.
By Application: New Energy Surges as Oil and Gas Matures
Oil and gas held 41.18% of application share in 2025, a figure that masks divergent trends: upstream offshore production is contracting in mature basins (North Sea, Gulf of Mexico) while expanding in frontier plays (Guyana, Suriname), midstream pipeline infrastructure is growing modestly to accommodate LNG exports, and downstream refining is stagnant in OECD markets yet robust in Asia and the Middle East. New-energy applications are expanding at 9.22% CAGR through 2031, more than double the market average, propelled by wind-turbine hydraulic pitch systems, solar-thermal molten-salt loops, and battery-energy-storage thermal-management circuits that collectively consumed negligible valve volumes a decade ago.
Municipal water projects underpin steady replacement demand, while semiconductor fabs consume ultrapure-media valves that meet SEMI F57 cleanliness limits. These emerging pockets collectively widen the total addressable industrial valves market.

Geography Analysis
Asia-Pacific held 40.47% revenue in 2025, led by LNG terminals and semiconductor fabs that each require thousands of precision valves. China, Taiwan, and South Korea underpin fab demand, whereas Southeast Asia scales gas infrastructure to replace coal.
North America generates high aftermarket revenue from its vast installed base. The CHIPS Act’s USD 39 billion incentives spurred Intel, Micron, and Samsung fabs in Arizona, Texas, and Ohio, incorporating ultrapure-water loops with stringent valve cleanliness specs.
The Middle East and Africa will post a 6.57% CAGR to 2031, fastest worldwide, on the back of GCC desalination CAPEX and Saudi petrochemical expansions. Europe’s offshore wind and CCS hubs partially offset fossil-power retirements, while Latin America’s pre-salt and shale projects sustain regional valve demand, illustrating geographic spread in the industrial valves market.

Competitive Landscape
The Industrial Valves market is highly fragmented. Captive foundries and multi-year nickel contracts shield large OEMs from raw-material price shocks, while horizontal specialists like IMI Critical lock in 40%-plus margins in severe-service niches. White-space opportunities revolve around hydrogen-compatible coatings, modular actuator retrofits, and data-centric predictive-maintenance platforms. Regional challengers such as KITZ and AVK leverage shorter 12- to 16-week lead times to win EPC orders. Certification costs, USD 50k-80k per valve model, favor incumbents with amortized test portfolios, consolidating share inside the industrial valves market.
Industrial Valves Industry Leaders
Emerson Electric Co.
Flowserve Corporation
SLB
Crane Company
IMI
- *Disclaimer: Major Players sorted in no particular order

Recent Industry Developments
- February 2025: Flowserve Corporation launched the Worcester Cryogenic series of reduced-port, quarter-turn floating ball valves for the liquefied natural gas (LNG), hydrogen, and other industrial gas sectors. Available in three-piece (CF44 series) and flanged (CF51/CF52 series) configurations, the valves feature a high-strength stem.
- April 2024: Chemtech Industrial Valves (CIVL) manufactured and supplied a DN 2400 MM goggle valve to a copper plant in India. The valve was designed and manufactured for handling a very toxic and corrosive application, which includes sulfur dioxide & sulfur trioxide fumes.


Research Methodology Framework and Report Scope
Market Definitions and Key Coverage
Our study treats the industrial valves market as all factory-built mechanical devices whose primary purpose is to start, stop, or modulate the flow of liquids, gases, or slurries within industrial piping and process systems, irrespective of actuation type. According to Mordor Intelligence, revenues are captured at the valve manufacturer's point of sale and are reported in USD terms across 27 national markets.
Scope Exclusions: household plumbing faucets, micro-fluidic laboratory valves, and standalone actuators are not counted.
Segmentation Overview
- By Type
- Ball Valve
- Butterfly Valve
- Gate Valve
- Globe Valve
- Plug Valve
- Other Types
- By Product
- Quarter-Turn Valve
- Multi-Turn Valve
- Other Products
- By Valve Function
- Isolation Valves
- Regulation Valves
- Check and Safety Valves
- By Body Material
- Steel (Carbon and Stainless Steel)
- Alloy-Based (Duplex, Inconel, etc.)
- Cast/Ductile Iron
- Cryogenic Nickel Alloys
- Others
- By Application
- Oil and Gas
- Power
- Water and Wastewater Management
- Chemicals
- New Energy
- Other Applications (Includes Food Processing, Mining, and Marine)
- By Geography
- Asia-Pacific
- China
- India
- Japan
- South Korea
- Indonesia
- Vietnam
- Malaysia
- Thailand
- Rest of Asia-Pacific
- North America
- United States
- Canada
- Mexico
- Europe
- Germany
- United Kingdom
- Italy
- France
- NORDIC Countries
- Turkey
- Russia
- Spain
- Rest of Europe
- South America
- Brazil
- Argentina
- Colombia
- Rest of South America
- Middle East and Africa
- Saudi Arabia
- United Arab Emirates
- Qatar
- Egypt
- Nigeria
- South Africa
- Rest of Middle East and Africa
- Asia-Pacific
Detailed Research Methodology and Data Validation
Primary Research
Mordor analysts interviewed procurement leads at midstream oil operators across the United States, EPC contractors in the Middle East, and water-utility maintenance managers in Southeast Asia. These discussions verified average selling prices, service-life replacement cycles, and upcoming shutdown schedules, filling gaps that public statistics cannot bridge.
Desk Research
We began with trade data from sources such as UN Comtrade, US International Trade Commission databases, and Eurostat to size cross-border valve flows. Industry codes from the International Valve Manufacturers Association and China Valve Association clarified production clusters. Energy Information Administration refinery additions, International Desalination Association project lists, and World Steel Association price indices added volume, project pipeline, and cost context. Subscription files from D&B Hoovers and Dow Jones Factiva helped validate leading suppliers' revenue splits. The examples above are illustrative; many further public and paid sources informed our desk review.
Market-Sizing & Forecasting
A top-down model converts production plus net-import data into apparent consumption, which is then checked against sampled ASP × unit estimates gathered from supplier roll-ups. Key variables include: 1) upstream and midstream CAPEX trends, 2) desalination plant capacity additions, 3) refinery turnaround frequencies, 4) regional steel price movements, and 5) smart-valve retrofit rates. A multivariate regression forecasts each driver, while scenario analysis adjusts for cyclical oil prices. Bottom-up approximations reconcile any material divergence greater than three percent.
Data Validation & Update Cycle
Outputs pass two analyst reviews where anomalies against historic demand ratios and peer signals are flagged. We refresh the model annually; material events such as large LNG trains or force-majeure outages trigger interim updates. Before publication, a fresh validation ensures clients receive the newest view.
Why Mordor's Industrial Valves Baseline Stands Firmly Credible
Published figures often differ because firms pick dissimilar product mixes, price anchors, and refresh cadences. We acknowledge those realities upfront before explaining the main gap drivers below.
Key gap drivers include broader component inclusion by some publishers (actuators, instrumentation), reliance on global shipment value without regional ASP variation, and less frequent model refresh cycles that overlook recent hydrogen and desalination projects influencing 2025 demand.
Benchmark comparison
| Market Size | Anonymized source | Primary gap driver |
|---|---|---|
| USD 74.34 B (2025) | Mordor Intelligence | - |
| USD 95.58 B (2024) | Global Consultancy A | Includes actuators and aftermarket services, limited regional ASP differentiation |
| USD 78.10 B (2024) | Industry Analysis Firm B | Uses shipment volumes with flat global ASP, excludes project-specific premium alloys |
The comparison shows that once scope creep and pricing shortcuts are stripped away, Mordor's disciplined variable set and annual refresh cycle provide a balanced, transparent baseline that decision-makers can trace and replicate.


Key Questions Answered in the Report
What is the projected value of the industrial valves market in 2031?
The market is forecast to reach USD 101.40 billion by 2031, growing at a 4.54% CAGR.
Which valve type is expected to grow fastest through 2031?
Which valve type is expected to grow fastest through 2031?
Why are alloy-based valve bodies gaining traction?
Why are alloy-based valve bodies gaining traction?
Which region shows the highest growth potential?
Which region shows the highest growth potential?
How is predictive maintenance influencing valve demand?
How is predictive maintenance influencing valve demand?
Page last updated on:


