Market Overview
| Study Period | 2020 - 2031 |
|---|---|
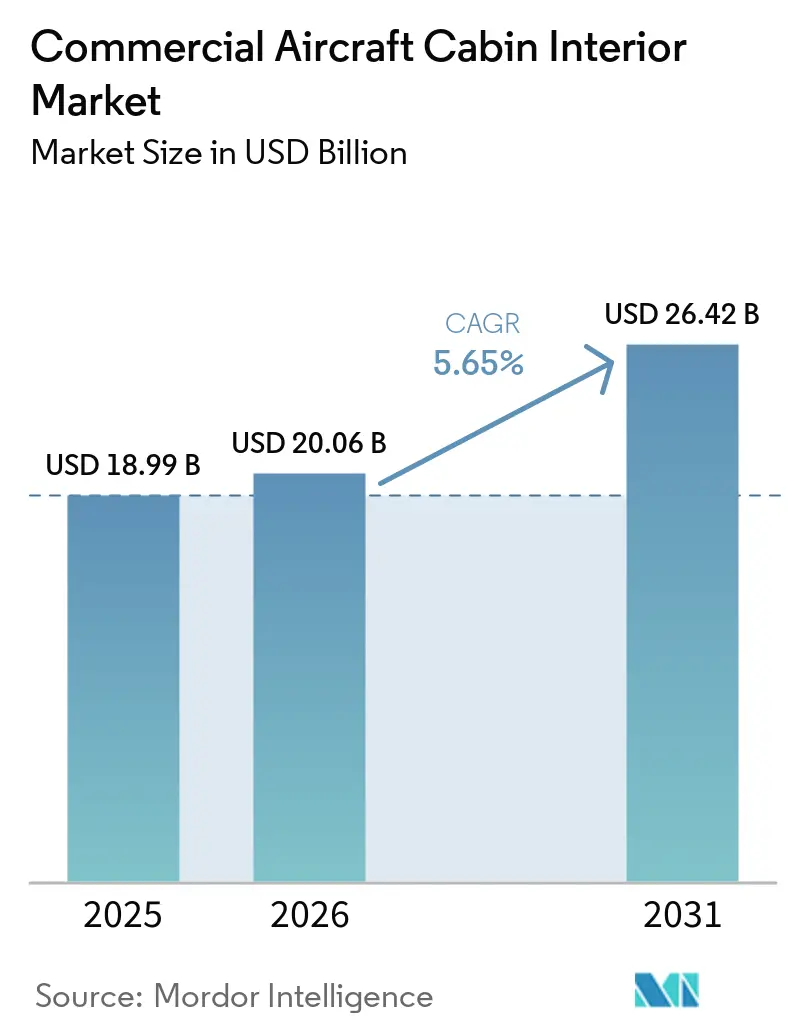
| Market Size (2026) | USD 20.06 Billion |
| Market Size (2031) | USD 26.42 Billion |
| Growth Rate (2026 - 2031) | 5.65% CAGR |
| Fastest Growing Market | Middle East and Africa |
| Largest Market | Asia-Pacific |
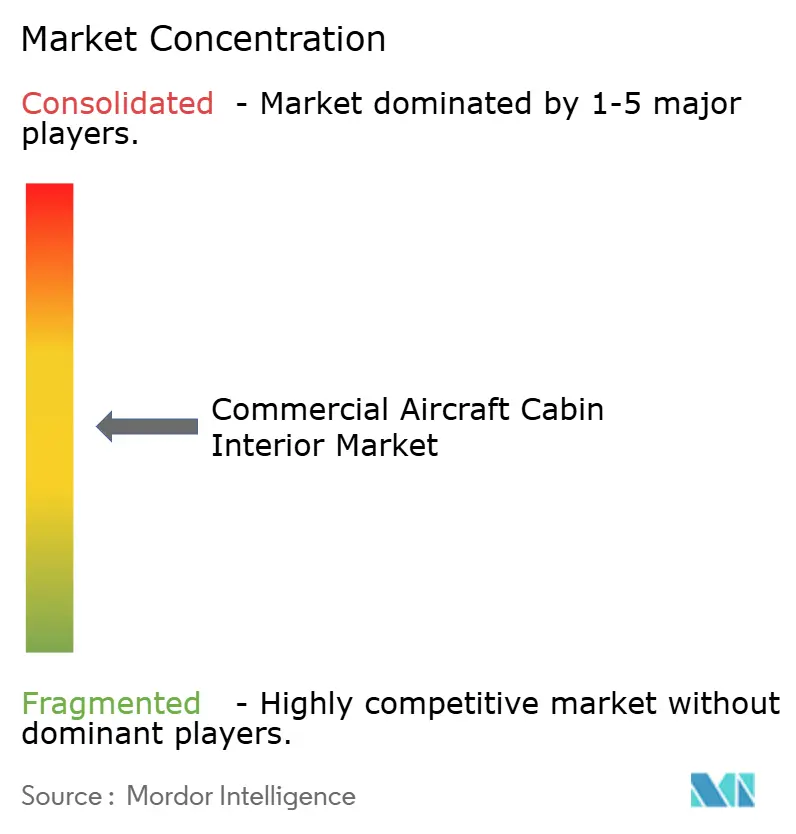
| Market Concentration | Medium |
Major Players *Disclaimer: Major Players sorted in no particular order Image © Mordor Intelligence. Reuse requires attribution under CC BY 4.0. | |
Commercial Aircraft Cabin Interior Market Analysis by Mordor Intelligence
The commercial aircraft cabin interior market size is expected to grow from USD 18.99 billion in 2025 to USD 20.06 billion in 2026 and is forecast to reach USD 26.42 billion by 2031 at 5.65% CAGR over 2026-2031. Airlines are pressing ahead with fleet-wide modernization, monetizing premium cabins, and complying with evolving safety and accessibility mandates, which enlarges addressable demand within the commercial aircraft cabin interior market. Seating upgrades dominate immediate spending, yet the sharpest acceleration comes from data-rich in-flight entertainment and connectivity (IFEC) retrofits that promise ancillary-revenue upside. Lightweight composite panels, mandated 16-g seat certifications, and widening retrofit windows for A350 and B787 fleets sustain a predictable replacement pipeline. Regional variations are equally pronounced: Asia–Pacific airlines command volume leadership, African carriers produce the fastest compound growth, and North American operators set regulatory benchmarks that ripple globally.
Key Report Takeaways
- By product type, seating systems accounted for 29.88% of 2025 revenue, while IFEC solutions are advancing at an 8.26% CAGR to 2031.
- By aircraft type, narrowbody platforms captured 48.62% of 2025 demand; regional jets are expanding at a 6.78% CAGR through 2031.
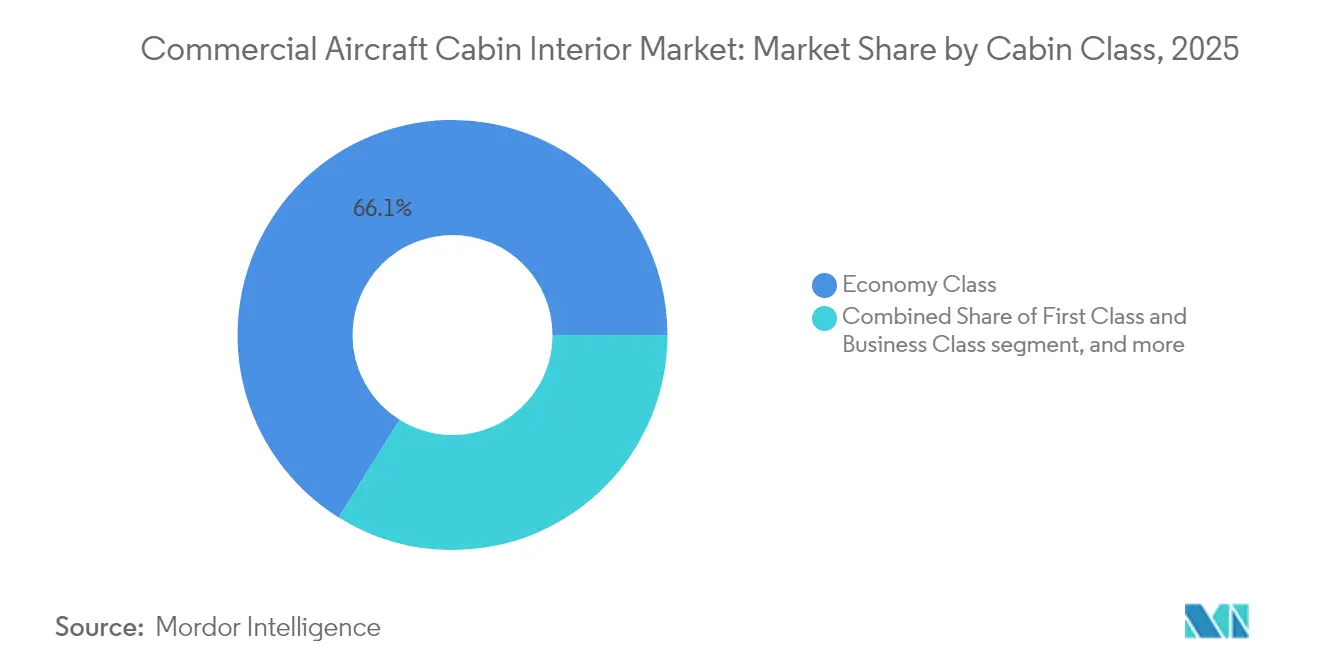
- By cabin class, the economy class retained a 66.12% share in 2025, whereas the premium economy class is rising at a 9.19% CAGR over the forecast horizon.
- By fit type, OEM installations contributed 70.02% of the 2025 value, yet aftermarket installations are growing at a 7.53% CAGR during 2026-2031.
- By material, composites controlled a 47.35% share in 2025; advanced thermoplastics show the fastest 8.82% CAGR through 2031.
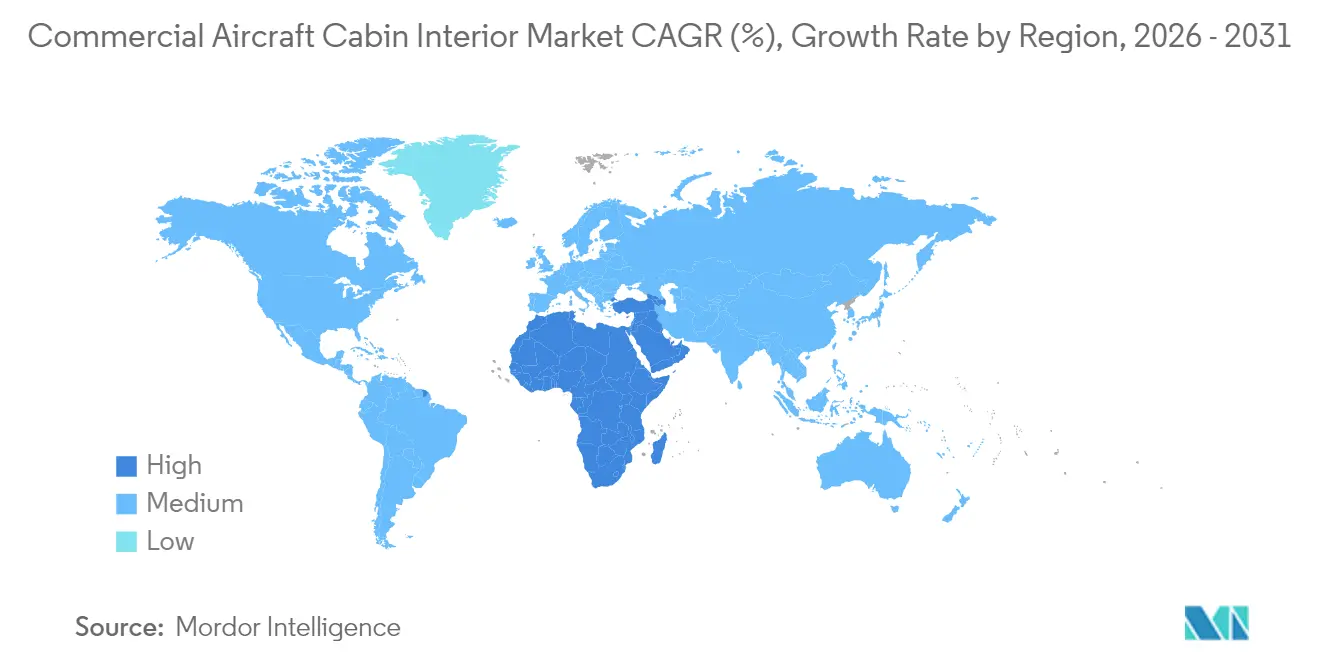
- By geography, Asia-Pacific led with a 37.11% revenue share in 2025; the Middle East and Africa region is progressing at a 7.31% CAGR to 2031.
Note: Market size and forecast figures in this report are generated using Mordor Intelligence’s proprietary estimation framework, updated with the latest available data and insights as of 2026.
Global Commercial Aircraft Cabin Interior Market Trends and Insights
Drivers Impact Analysis*
| Driver | (%) Impact on CAGR Forecast | Geographic Relevance | Impact Timeline |
|---|---|---|---|
| Surge in premium-economy retrofits to monetize cabin real estate | 1.20% | Global; early adoption in North America and Europe | Medium term (2-4 years) |
| Mandatory 16-g seat certification driving seat replacement cycles | 0.90% | Global; spillover to emerging markets | Short term (≤ 2 years) |
| Ultra-lightweight composite panels reducing fuel burn and sustainable aviation fuel (SAF) costs | 1.10% | Global; APAC core adoption | Long term (≥ 4 years) |
| Accessibility mandates creating new spend categories | 0.70% | North America and EU; expanding worldwide | Medium term (2-4 years) |
| Connected-cabin data monetization accelerating IFEC upgrades | 1.30% | Global; premium routes first | Short term (≤ 2 years) |
| A350 and B787 fleets reaching 8-year retrofit window | 0.80% | Global; large flag carriers | Medium term (2-4 years) |
| Source: Mordor Intelligence | |||


Surge in Premium-Economy Retrofits to Monetize Cabin Real Estate
Airlines are intensifying cabin reconfigurations to include premium-economy sections that deliver yield uplifts without adding aircraft capacity. Delta Air Lines registered 15% higher route yields after rolling out premium-economy and forecasts incremental USD 500 million annual revenue once the installation program concludes in 2026.[1]Source: Delta Air Lines, “Investor Update Q4 2024,” delta.com United Airlines already retrofitted more than 200 aircraft by late 2024, pairing seat-pitch increases with upgraded meal service to attract both leisure up-sellers and cost-conscious corporate travelers.[2]Source: United Airlines, “Fleet Modernization Briefing,” united.com Integrated lavatory and aisle modifications undertaken simultaneously for accessibility compliance improve project economics by bundling downtime. Cabin density optimization limits revenue dilution, and high-utilization narrowbody fleets emerge as first adopters. As leading North American carriers demonstrate profit accretion, operators in Europe and Asia-Pacific are fast-tracking similar retrofit programs.
Mandatory 16-g Seat Certification Driving Seat Replacement Cycles
Federal Aviation Administration (FAA) 16-g dynamic testing thresholds enforce the replacement of legacy seats installed before 2009. American Airlines allocated USD 2.1 billion in 2024 to meet the mandate across narrowbody and regional fleets, compressing compliance timelines to avoid grounding penalties. Regional carriers operating aging CRJ and ERJ platforms are similarly compelled despite thinner capital buffers, creating concentrated ordering sprees that stretch supplier capacity. Manufacturers prioritize certification labs over production lines, extending lead times for non-regulated seat programs. The rule’s global reach stems from bilateral airworthiness agreements that allow the FAA to approve the de facto benchmark, pulling emerging-market operators into the same replacement cycle.
Ultra-Lightweight Composite Panels Reducing Fuel Burn and SAF Costs
Advanced interior panels leveraging carbon-fiber reinforced thermoplastics trim cabin weight by 15-20% relative to aluminum assemblies. With SAF premiums running USD 3-4 per gallon above conventional jet fuel, every 100-pound reduction translates to USD 13,000 annual fuel savings per aircraft under Boeing’s published weight-cost model.[3]Source: Boeing, “Weight-Savings Calculator,” boeing.com Airlines now accept 25-30% higher component prices as return-on-investment (ROI) periods compress to three to four years. Austrian supplier FACC AG reported order backlogs stretching to 24 months as carriers and leasing firms lock in allocations for upcoming maintenance checks. The widebody operators in Asia-Pacific are among the earliest adopters, seeing additive gains on fuel-intensive long-haul missions.
Accessibility Mandates Creating New Spend Categories
The US Department of Transportation (DoT) rules require wheelchair-accessible lavatories and reserved aircraft seats with 125+ seats by 2026. Airlines incur USD 150,000–300,000 per widebody for lavatory retrofits and cabin reconfiguration, amassing an estimated USD 800 million in aggregate spend potential. Non-compliance fines can reach USD 27,500 per flight, prompting operators to combine accessibility retrofits with broader cabin refresh programs. International carriers serving US destinations must comply regardless of home-country regulations, effectively globalizing the requirement. European and Middle Eastern airlines are adopting early retrofit templates devised by American majors to streamline certification.
Restraints Impact Analysis*
| Restraint | (%) Impact on CAGR Forecast | Geographic Relevance | Impact Timeline |
|---|---|---|---|
| Supply-chain bottlenecks in seat and foam certifications | -0.8% | Global; acute in North America | Short term (≤ 2 years) |
| High up-front capital needs as airlines recover post-COVID | -0.6% | Global; emerging markets hardest hit | Medium term (2-4 years) |
| Certification complexity for novel eco-materials | -0.4% | Global; EU regulatory leadership | Long term (≥ 4 years) |
| Rising FST compliance costs | -0.5% | Global; developed markets most stringent | Medium term (2-4 years) |
| Source: Mordor Intelligence | |||
Supply-Chain Bottlenecks in Seat and Foam Certifications
Updated flammability protocols require fresh foam formulations to pass FAA testing, which now stretches 12-18 months. RECARO Aircraft Seating cited average delivery slippages of 6-8 months on widebody programs during 2024. Thompson Aero temporarily halted sales of its newest premium-economy seat until alternative foams clear testing pipelines. Airlines operating high-cycle narrowbodies face revenue hits when heavy checks overrun scheduled downtimes due to delayed interiors. These bottlenecks diminish retrofit momentum, shaving 0.8 percentage points off the forecast CAGR.
High Up-Front Capital Needs as Airlines Recover Post-COVID
Debt service ratios remain 15-20% of revenue for most flag carriers, limiting discretionary retrofit budgets as cabin refresh cycles intensify. Air France-KLM deferred USD 400 million of planned upgrades to preserve liquidity, while Lufthansa lengthened refresh intervals to 12 years. Smaller operators lack access to low-cost financing and must self-fund modifications required by lessors. Unless traffic recovery accelerates beyond 2025 levels, capital scarcity is expected to trim 0.6 percentage points from baseline growth.
*Our forecasts treat driver/restraint impacts as directional, not additive. The impact forecasts reflect baseline growth, mix effects, and variable interactions.
Segment Analysis
By Product Type: Seating Systems Retain Scale while IFEC Sets the Pace
Seating contributed 29.88% of the commercial aircraft cabin interior market share in 2025 and remained the prime value driver within the market. Airlines paid USD 15,000–25,000 per premium-business-class unit and USD 2,500–4,000 for economy modules, ensuring that seat programs anchor retrofit budgets. IFEC platforms, however, clock the fastest 8.26% CAGR as connectivity transforms from a perk into a revenue line.
New demand concentrates on seats that combine reduced weight, wireless charging, and integrated crew alerts. Economy layouts grow denser yet emphasize slim-line ergonomics to mitigate passenger discomfort. Meanwhile, IFEC providers pivot to satellite-agnostic architectures to ensure bandwidth redundancy. The commercial aircraft cabin interior market continues to link IFEC adoption with higher net-promoter scores, empowering airlines to up-sell lounge-style experiences even on narrowbody routes. Galley redesigns and LED lighting upgrades complement seat and IFEC spending, but their absolute values remain smaller given lower component prices.


By Aircraft Type: Narrowbody Dominance Mirrors Delivery Backlog
Narrowbody jets captured 48.62% of 2025 demand, embedding the highest absolute footprint within the commercial aircraft cabin interior market size. Flight-hour intensity and 70% dominance in the OEM backlog keep this category crucial for seat and monument suppliers. Regional jets register the strongest 6.78% CAGR, fueled by point-to-point connectivity growth in secondary cities.
Widebodies skew toward premium-class innovation: full-height privacy doors, self-serve lounges, and next-gen IFEC are table stakes on long-haul routes. Conversely, widebodies such as the A380 witness modest interior investment as retirements accelerate. The commercial aircraft cabin interior market observes carriers' focus on right-sizing capacity, indirectly redirecting capital from oversized models toward high-utilization single-aisles and new-generation regional jets.
By Cabin Class: Economy Volume Meets Premium Growth
Economy still represents 66.12% of 2025 revenue, a natural outcome of seat-density math, yet premium-economy advances at a 9.19% CAGR, outpacing every other class inside the commercial aircraft cabin interior market. Yields run 40-60% above economy fares while occupying only 15-20% extra space, validating rapid take-up.
Business and first-class continue to rebound with corporate travel, but installations prioritize privacy shells, larger monitors, and staggered seating layouts that optimize cabin footprints. Airlines are reshaping onboard hierarchies: some narrowbody fleets now feature mini-premium-economy cabins to capture high-yield leisure travelers, showcasing how the commercial aircraft cabin interior market is moving beyond binary class structures.
By Fit Type: OEM Scale Versus Aftermarket Momentum
OEM linefits delivered 70.02% of 2025 turnover, buoyed by Airbus and Boeing ramp-ups and seamless certification paths. Nonetheless, aftermarket retrofits expand at a 7.53% CAGR, carving a steadily larger slice of the commercial aircraft cabin interior market size by enabling airlines to extend aircraft life and introduce revenue-centric layouts without buying new hulls.
Retrofit decisions are increasingly synchronized with heavy maintenance checks, compressing installation timelines to 4–6 weeks. Modular monuments and plug-and-play IFEC racks reduce aircraft-on-ground days, pushing retrofit NPV ahead of greenfield deliveries for several carriers. Airlines also exploit the aftermarket to pilot test new class concepts on limited fleets before embedding them in future OEM orders.
By Material: Composites Lead, Thermoplastics Accelerate
Composites held 47.35% of the 2025 value and anchor technology leadership within the commercial aircraft cabin interior market. Strength-to-weight superiority allows thinner structures without compromising safety margins, while integration of antennas and sensors drives multifunctionality. Advanced thermoplastics log the steepest 8.82% CAGR, aided by recyclability, lower curing times, and compatibility with additive manufacturing.
Aluminum retains relevance for cost-sensitive programs and load-bearing sub-frames where weight trade-offs are minor. Steel and specialty alloys appear in shielding or high-stress hinges. Sustainable resin chemistries and bio-based fibers are entering certification, but will occupy niche volumes until testing costs ease. Nonetheless, material substitution remains a headline differentiator that suppliers use to justify price premiums and win long-term agreements.
Geography Analysis
Asia–Pacific controlled 37.11% of 2025 spending, making it the most influential territory within the commercial aircraft cabin interior market. China alone took delivery of more than 400 new aircraft in 2024 and targets an average of 500 annual arrivals by 2030, generating steady linefit volumes. India’s air-traffic surge and aggressive fleet expansion plans add further ballast, while Japan channels investment toward high-end cabin refinements to protect its premium yield share. Southeast Asian low-cost carriers adopt uniform interiors emphasizing rapid turnarounds and high seat counts to keep fares low.
The Middle East and Africa region witnesses the fastest growth at a 7.31% CAGR through 2031. Ethiopian Airlines leads widebody growth, pairing cabin retrofits with route expansion into Asia and North America. In contrast, South African Airways uses its restructuring period to standardize interiors for better fleet interchangeability. Infrastructure gaps, limited MRO capacity, and foreign-exchange constraints pose hurdles, yet favorable demographics and tourism recovery offset these impediments. Commercial aircraft leasing firms play a pivotal role by importing younger aircraft equipped with contemporary interiors, accelerating modernization without large cap-ex. While smaller in fleet count, Middle East airlines exert outsized influence on premium-class design trends. Flag carriers in the Gulf continue to pioneer ultra-long-haul configurations with showers, social zones, and bespoke lighting that inspire emulation elsewhere. South America sees steady, though slower, activity, primarily centered on narrowbody retrofits as airlines rationalize fleets post-pandemic. These geographical cross-currents keep the commercial aircraft cabin interior market diversified and resilient against localized shocks.
North America and Europe exhibit mature replacement dynamics, where the commercial aircraft cabin interior market skews toward retrofit programs. US carriers focus on meeting DOT accessibility timelines and launching connected-cabin ecosystems that unlock ad revenue streams. European operators combine sustainability imperatives with passenger-comfort upgrades, experimenting with bio-sourced materials despite certification drag. Regulatory leadership in both regions establishes de facto global benchmarks that suppliers must satisfy to remain eligible for broader markets.

Competitive Landscape
The top five suppliers, Safran SA, Collins Aerospace (RTX Corporation), RECARO Aircraft Seating GmbH & Co. KG (RECARO Holding GmbH), Diehl Stiftung & Co. KG, and Panasonic Holdings Corporation, place the commercial aircraft cabin interior market in a moderately concentrated posture. Safran’s 2025 USD 1.2 billion contract with Air India underscores the strategic value of vendor portfolios that span seats, galleys, and lighting. Collins Aerospace leverages avionics integration to stitch cabin and cockpit data streams, bolstering its differentiated appeal during airline digital-strategy overhauls.
Mergers and targeted acquisitions remain the favored route to capability expansion. Diehl Aviation’s 2024 purchase of Thompson Aero’s premium-seating unit injects design depth and North American manufacturing presence. RECARO entered Poland with a USD 200 million plant focused on European demand, diversifying its industrial footprint beyond Germany. Panasonic’s partnership with Starlink positions it at the intersection of cabin hardware and low-latency connectivity, pre-empting new entrants touting direct-to-device streaming.
Smaller specialists attack value-white spaces such as modular monuments and sustainable plastics. Expliseat’s titanium frame demonstrates that aggressive weight reduction still commands airline attention even in niche markets like regional jets. Luminator’s longer-life emergency lighting shows that incremental gains can capture retrofit slots when straightforward certification paths exist. Innovation cadence stays high, but regulatory and engineering barriers sustain moderate competitive intensity.
Commercial Aircraft Cabin Interior Industry Leaders
Diehl Stiftung & Co. KG
Safran SA
Panasonic Corporation
Collins Aerospace (RTX Corporation)
RECARO Aircraft Seating GmbH & Co. KG (RECARO Holding GmbH)
- *Disclaimer: Major Players sorted in no particular order

Recent Industry Developments
- August 2025: With a USD 400 million fleet retrofit program, Air India initiated the widebody retrofit for its legacy B787-8s. In July 2025, Air India sent its first of 26 aircraft (VT-ANT) to Boeing's facility in Victorville, California. A second aircraft is set to make the same journey in October 2025, with both slated to re-enter service by December 2025.
- June 2024: At the 2024 Aircraft Interiors Expo, Collins Aerospace, a subsidiary of RTX Corporation, unveiled its Helix™ main cabin seat tailored for narrowbody aircraft. The Helix seat is designed to be lighter than its predecessors in the economy class segment, all while enhancing ergonomic comfort and maximizing living space, without compromising cabin density.


Global Commercial Aircraft Cabin Interior Market Report Scope
By Product Type
| Seating |
| Cabin Lighting |
| In-flight Entertainment and Connectivity (IFEC) |
| Galley and Monument |
| Lavatory Systems |
| Cabin Windows and Windshields |
| Overhead Stowage Bins |
| Interior Panels and Floorboards |
| Others |
By Aircraft Type
| Narrowbody Aircraft |
| Widebody Aircraft |
| Regional Jets |
By Cabin Class
| First Class and Business Class |
| Premium Economy Class |
| Economy Class |
By Fit Type
| Original Equipment Manufacturer (OEM) |
| Aftermarket |
By Material
| Composites |
| Aluminum Alloys |
| Steel and Other Alloys |
| Advanced Thermoplastics |
By Geography
| North America | United States | |
| Canada | ||
| Mexico | ||
| Europe | United Kingdom | |
| France | ||
| Germany | ||
| Spain | ||
| Italy | ||
| Russia | ||
| Rest of Europe | ||
| Asia-Pacific | China | |
| India | ||
| Japan | ||
| South Korea | ||
| Indonesia | ||
| Singapore | ||
| Rest of Asia-Pacific | ||
| South America | Brazil | |
| Argentina | ||
| Chile | ||
| Rest of South America | ||
| Middle East and Africa | Middle East | United Arab Emirates |
| Saudi Arabia | ||
| Turkey | ||
| Qatar | ||
| Rest of Middle East | ||
| Africa | South Africa | |
| Nigeria | ||
| Kenya | ||
| Rest of Africa | ||
| By Product Type | Seating | ||
| Cabin Lighting | |||
| In-flight Entertainment and Connectivity (IFEC) | |||
| Galley and Monument | |||
| Lavatory Systems | |||
| Cabin Windows and Windshields | |||
| Overhead Stowage Bins | |||
| Interior Panels and Floorboards | |||
| Others | |||
| By Aircraft Type | Narrowbody Aircraft | ||
| Widebody Aircraft | |||
| Regional Jets | |||
| By Cabin Class | First Class and Business Class | ||
| Premium Economy Class | |||
| Economy Class | |||
| By Fit Type | Original Equipment Manufacturer (OEM) | ||
| Aftermarket | |||
| By Material | Composites | ||
| Aluminum Alloys | |||
| Steel and Other Alloys | |||
| Advanced Thermoplastics | |||
| By Geography | North America | United States | |
| Canada | |||
| Mexico | |||
| Europe | United Kingdom | ||
| France | |||
| Germany | |||
| Spain | |||
| Italy | |||
| Russia | |||
| Rest of Europe | |||
| Asia-Pacific | China | ||
| India | |||
| Japan | |||
| South Korea | |||
| Indonesia | |||
| Singapore | |||
| Rest of Asia-Pacific | |||
| South America | Brazil | ||
| Argentina | |||
| Chile | |||
| Rest of South America | |||
| Middle East and Africa | Middle East | United Arab Emirates | |
| Saudi Arabia | |||
| Turkey | |||
| Qatar | |||
| Rest of Middle East | |||
| Africa | South Africa | ||
| Nigeria | |||
| Kenya | |||
| Rest of Africa | |||


Market Definition
- Product Type - Commercial Aircraft cabin interior products such as passenger seats, cabin lighting, inflight entertainment system, cabin windows, lavatories, galley, and stowage bins have been included under the product type in this study.
- Aircraft Type - All the passenger aircraft such as narrowbody and widebody which are single-aisle and twin-aisle are included in this study.
- Cabin Class - Business and First Class, economy and premium economy are classes of air travel provided by the airlines that offer various services to the passengers.
| Keyword | Definition |
|---|---|
| Gross domestic product (GDP) | Gross domestic product (GDP) is a monetary measure of the market value of all the final goods and services produced in a specific time period by countries. |
| Original Equipment Manufacturer (OEM) | An original equipment manufacturer (OEM) traditionally is defined as a company whose goods are used as components in the products of another company, which then sells the finished item to users. |
| High Dynamic Range (HDR) | Dynamic range describes the ratio between the brightest and darkest parts of an image. HDR is used to capture a greater dynamic range than SDR. |
| Federal Aviation Administration (FAA) | The division of the Department of Transportation is concerned with aviation. It operates Air Traffic Control and regulates everything from aircraft manufacturing to pilot training to airport operations in the United States. |
| European Aviation Safety Agency (EASA) | The European Aviation Safety Agency is a European Union agency established in 2002 with the task of overseeing civil aviation safety and regulation. |
| 4K Display | 4K resolution refers to a horizontal display resolution of approximately 4,000 pixels. |
| Organic Light Emitting Diode (OLED) | It is the light-emitting diode (LED) in which the emissive electroluminescent layer is a film of organic compound that emits light in response to an electric current. |
| Mean Time Between Failures (MTBF) | The mean time between failures is the predicted elapsed time between inherent failures of a mechanical or electronic system, during normal system operation. |
| (Low-Cost Carrier (LCCs) | It is an airline that is operated with an especially high emphasis on minimizing operating costs and without some of the traditional services and amenities provided in the fare |
| Electronically Dimmable Windows (EDW) | It is a type of window that blocks up to 99.96% of all visible light and provide full opacity, integrated into the window cassette of the sidewall panel. |


Research Methodology
Mordor Intelligence follows a four-step methodology in all our reports.
- Step 1: Identify Key Variables: In order to build a robust forecasting methodology, the variables and factors identified in Step-1 are tested against available historical market numbers. Through an iterative process, the variables required for market forecast are set and the model is built on the basis of these variables.
- Step 2: Build a Market Model: Market-size estimations for the historical and forecast years have been provided in revenue terms. For sales conversion to volume, the average selling price (ASP) is kept constant throughout the forecast period for each country, and inflation is not a part of the pricing.
- Step 3: Validate and Finalize: In this important step, all market numbers, variables and analyst calls are validated through an extensive network of primary research experts from the market studied. The respondents are selected across levels and functions to generate a holistic picture of the market studied.
- Step 4: Research Outputs: Syndicated Reports, Custom Consulting Assignments, Databases & Subscription Platforms


