Application Outsourcing Market Size and Share
Market Overview
| Study Period | 2020 - 2031 |
|---|---|
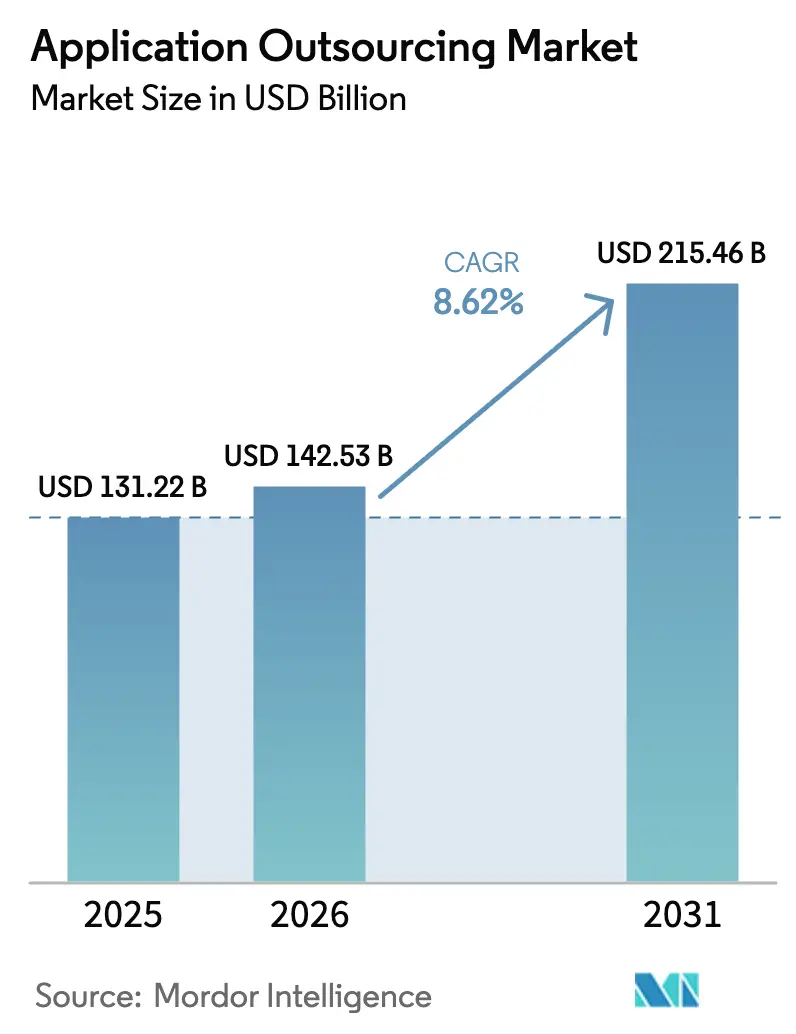
| Market Size (2026) | USD 142.53 Billion |
| Market Size (2031) | USD 215.46 Billion |
| Growth Rate (2026 - 2031) | 8.62% CAGR |
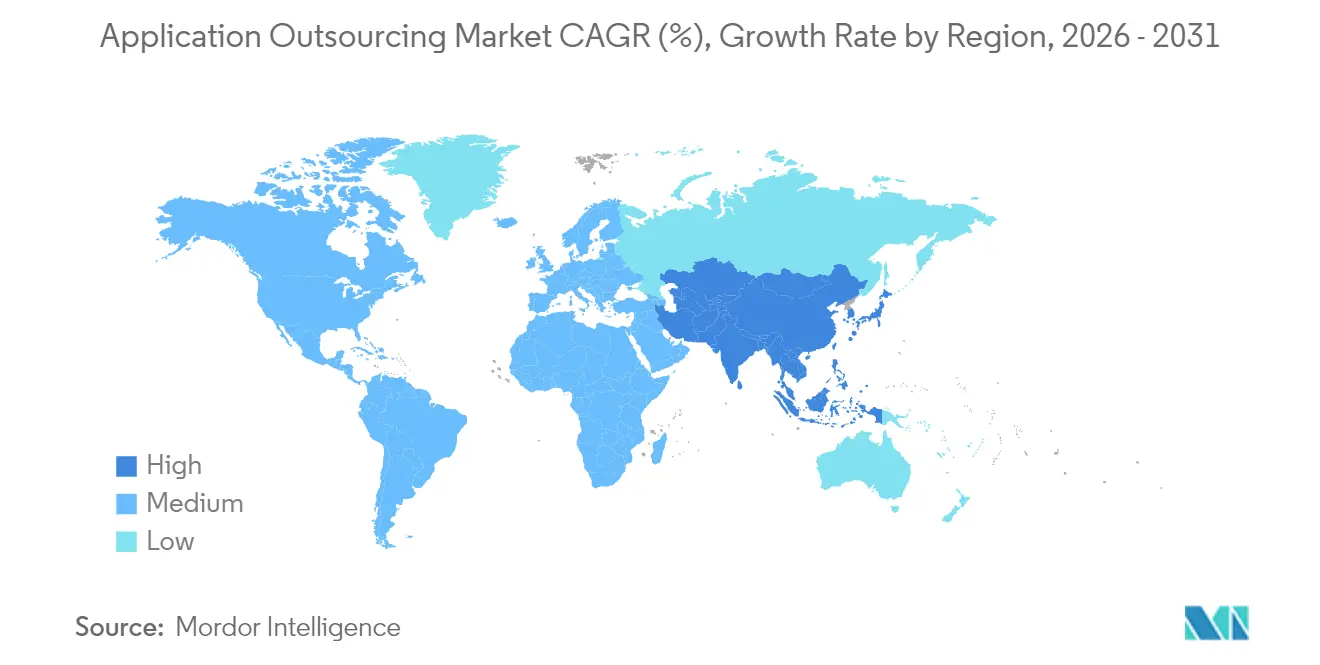
| Fastest Growing Market | Asia Pacific |
| Largest Market | North America |
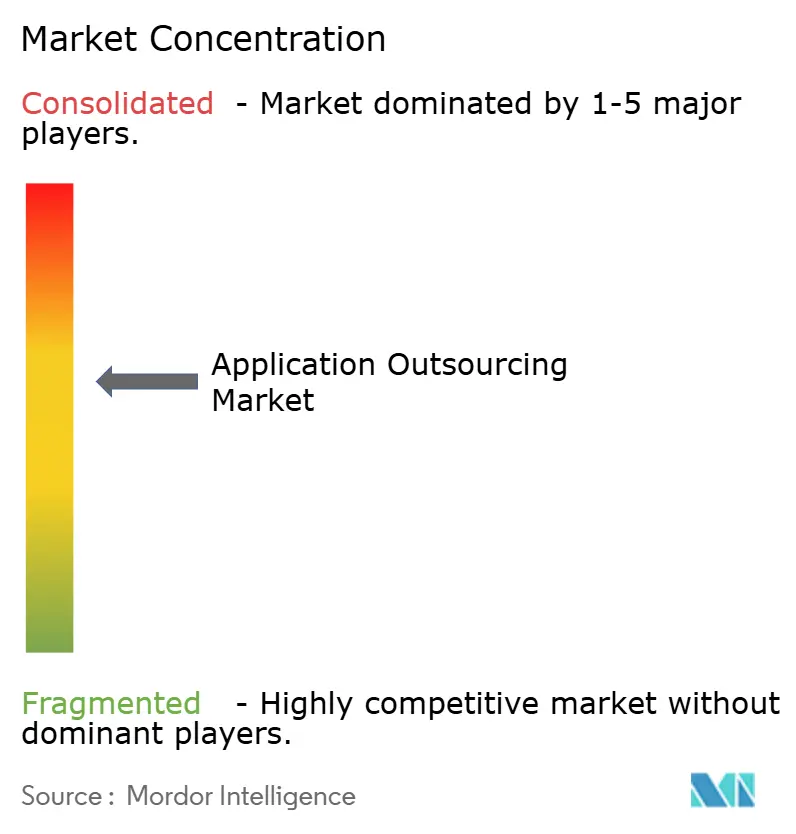
| Market Concentration | Medium |
Major Players *Disclaimer: Major Players sorted in no particular order Image © Mordor Intelligence. Reuse requires attribution under CC BY 4.0. | |
Application Outsourcing Market Analysis by Mordor Intelligence
The Application Outsourcing Market size is expected to grow from USD 131.22 billion in 2025 to USD 142.53 billion in 2026 and is forecast to reach USD 215.46 billion by 2031 at 8.62% CAGR over 2026-2031.
This growth reflects how enterprises now treat external application expertise as a core element of digital strategy rather than a cost exercise. Demand is most visible in maintenance, security, and modernization projects that keep critical workloads resilient. Cloud deployments and outcome-based contracts are expanding the total addressable opportunity, while nearshoring and multisourcing make delivery models more diverse. Service providers are upskilling rapidly in generative AI and cybersecurity to retain relevance. Mid-market firms with USD 1–5 billion in revenue add a fresh layer of volume, giving the application outsourcing market headroom in every major region.
Key Report Takeaways
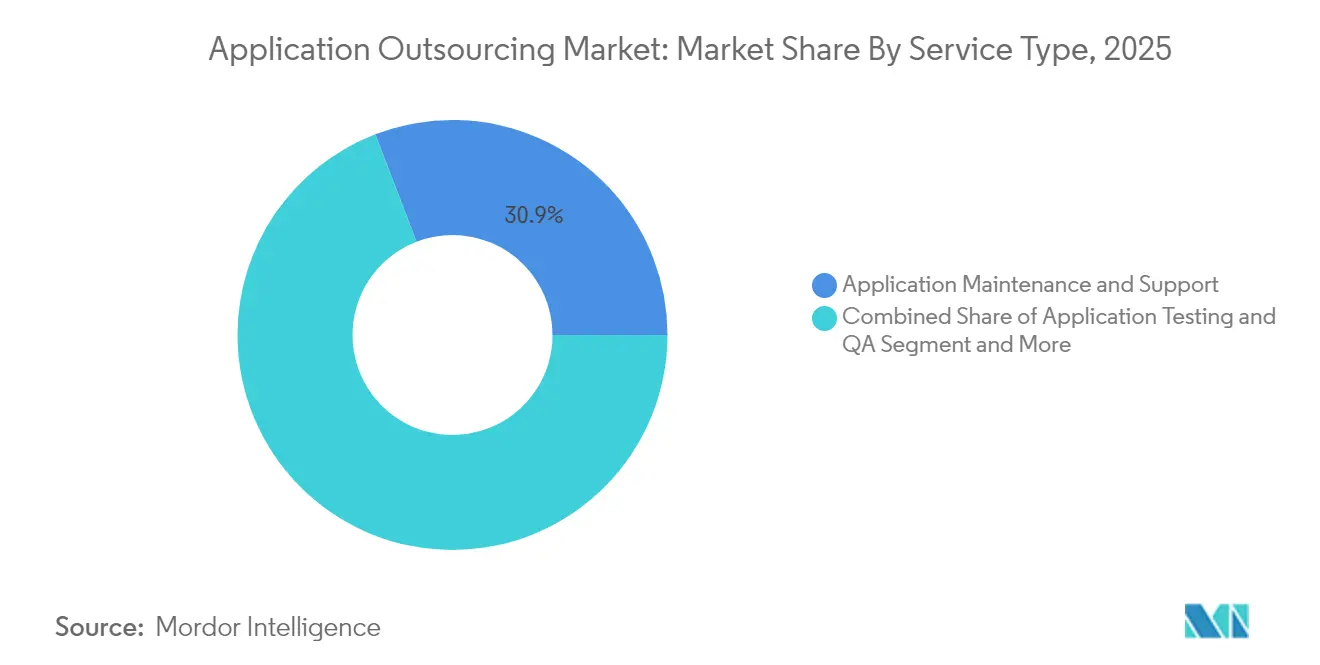
- By service type, Application Maintenance & Support led with 30.85% of the application outsourcing market share in 2025, while Security Services posted the fastest 12.61% CAGR.
- By deployment model, cloud-based solutions captured 56.35% of the application outsourcing market size in 2025; hybrid environments are rising at a 9.81% CAGR through 2031.
- By end-user industry, BFSI accounted for 28.10% of 2025 revenue; Healthcare & Life Sciences is forecast to grow at a 12.55% CAGR to 2031.
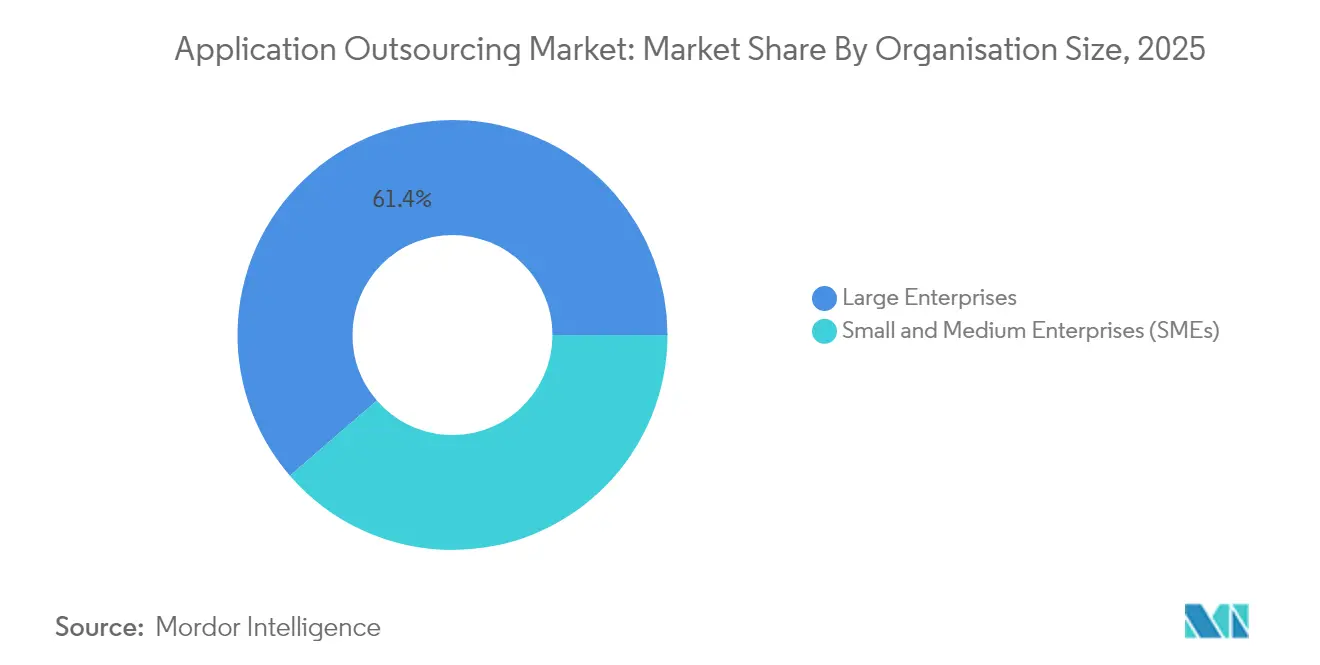
- By organization size, large enterprises controlled 61.35% of 2025 revenue; the SME segment is expanding at 10.62% CAGR.
- By contract model, fixed-price engagements held 47.35% revenue in 2025; outcome-based deals are advancing at a 13.68% CAGR.
- By geography, North America held 41.95% revenue in 2025; Asia-Pacific is poised for a 11.85% CAGR through 2031.
Note: Market size and forecast figures in this report are generated using Mordor Intelligence’s proprietary estimation framework, updated with the latest available data and insights as of 2026.
Global Application Outsourcing Market Trends and Insights
Drivers Impact Analysis*
| Driver | (~) % Impact on CAGR Forecast | Geographic Relevance | Impact Timeline |
|---|---|---|---|
| Surging digital-transformation programmes among SMEs | +5.4% | North America, Europe | Medium term (2-4 years) |
| BFSI pivot to platform banking and open APIs | +5.0% | Global | Medium term (2-4 years) |
| Cloud-native demand for AI/ML workloads | +4.5% | North America, APAC | Short term (≤ 2 years) |
| Cost-optimisation pressure post-2022 tech-margin squeeze | +4.1% | Global | Short term (≤ 2 years) |
| Vendor-consolidation to single-pane service partners | 3.6% | Global, with higher impact in mature markets | Medium term (2-4 years) |
| Near-shore delivery expansion into Latin-America Tier-2 hubs | 3.2% | North America | Medium term (2-4 years) |
| Source: Mordor Intelligence | |||
Surging digital-transformation programmes among SMEs
SMEs now treat outsourcing as the fastest path to modern applications that improve productivity and customer reach. In the United States, 60% of smaller firms plan to outsource software builds in 2025, attracted by flexible consumption models that remove upfront capital barriers. With more than 40,000 companies worldwide generating between USD 500 million and USD 5 billion in revenue, the segment offers a USD 300–400 billion pool for service providers. Providers respond by packaging cloud-first, API-driven offerings that fit limited budgets yet scale easily. As a result, SME revenue is expected to outpace overall application outsourcing market growth through 2030.
BFSI's pivot to platform banking and open-finance APIs
Banks and insurers accelerate application spending to support embedded finance, open-API ecosystems, and cloud-native architectures. JPMorgan Chase reports that moving workloads to the cloud unlocks advanced data capabilities and cements its AI leadership. [2]JPMorgan Chase, “Annual Report 2023,” jpmorganchase.com Nearly 72% of financial institutions already outsource substantial IT functions, and that intensity rises when regulatory deadlines push rapid platform changes. Providers with domain knowledge in risk, compliance, and payments integration gain a competitive edge as BFSI contributes the single largest slice of the application outsourcing market.
Cloud-native application demand for AI/ML workloads
More than half of 2024 digital service contracts included an AI proof of concept, confirming that enterprises want production-grade machine-learning applications. [3]Nasscom, “Digital Enterprise 2025: Advancing to an AI-First Enterprise,” nasscom.in Cloud-native design is mandatory to run scalable AI pipelines and integrate real-time data. Service firms led by TCS have retrained hundreds of thousands of staff in generative AI to keep pace. [1]Tata Consultancy Services, “Integrated Annual Report 2023-2024,” tcs.com The collision of AI urgency and cloud economics enlarges the application outsourcing market well beyond traditional ADM budgets.
Cost-optimisation pressure post-2022 tech-margin squeeze
Margin compression in 2022 left CIOs searching for rapid savings. Outsourcing now targets operational efficiency rather than pure labor cost. Outcome-based contracts tie fees to measurable business metrics and reduce time spent on change orders. Healthcare providers, for example, outsource revenue-cycle applications to lower bad-debt rates while improving patient experience. By attacking both cost and agility, enterprises cement the application outsourcing market as a core line item through 2030.
Restraints Impact Analysis*
| Restraint | (~) % Impact on CAGR Forecast | Geographic Relevance | Impact Timeline |
|---|---|---|---|
| Rising compliance costs for cross-border data transfer | -3.6% | Global, with higher impact in EU, China & Russia | Medium term (2-4 years) |
| Talent attrition and wage inflation in offshore hotspots | -3.2% | India, Philippines, Eastern Europe | Short term (≤ 2 years) |
| Heightened cyber-supply-chain breach incidents | -2.7% | Global | Medium term (2-4 years) |
| AI-driven low-code platforms cannibalising traditional ADM | -2.3% | North America, Europe | Long term (≥ 4 years) |
| Source: Mordor Intelligence | |||
Rising compliance costs for cross-border data transfer
Tighter data-sovereignty rules such as GDPR, CCPA, and sector-specific mandates force enterprises to redesign delivery models and sometimes split workloads by region. Legal counsel warns that non-compliance fines and remediation can offset labor arbitrage gains. [4]Morgan Lewis, “Outsourcing and Technology 2025: Key Takeaways,” morganlewis.com Providers answer with regional cloud zones and nearshore centers, yet extra encryption, audit, and transfer-impact assessments still raise project costs and slow deal cycles.
Talent attrition and wage inflation in offshore hotspots
Intense hiring for cloud, cybersecurity, and AI stems from a limited global talent pool. Indian tier-1 hubs report yearly raises of 8-12% for advanced roles, and attrition tops historical averages. Some customers shift work to Eastern Europe or Latin America to stabilize rates. Others push vendors to invest in automation that offsets higher wages. Continuous pressure on margins may force new pricing structures inside the application outsourcing market.
*Our forecasts treat driver/restraint impacts as directional, not additive. The impact forecasts reflect baseline growth, mix effects, and variable interactions.
Segment Analysis
By Service Type: Security Gains Traction Over Maintenance
Application Maintenance & Support contributed USD 40.49 billion in 2025, translating to 30.85% of the overall application outsourcing market. Long-running ERP, CRM, and supply-chain platforms still require dependable uptime and incremental upgrades, which keeps steady demand for managed services. Yet rising zero-day exploits and regulatory fines move security from an ancillary service into a growth engine.
Application Security Services expand at 12.61% CAGR as boards elevate cyber risk. Enterprises prefer external specialists who combine code-scanning tools with 24×7 SOC talent. As a result, the application outsourcing market size for security projects is forecast to climb sharply, while maintenance’s share slowly contracts. Development, integration, modernization, and testing services round out the portfolio, with 92% of firms planning some level of legacy refactoring before 2030.


By Deployment Model: Hybrid Becomes the Pragmatic Default
Cloud deployments own 56.35% of 2025 revenue, equivalent to USD 73.96 billion, underscoring how subscription infrastructure and automated scaling now define modernization roadmaps. Enterprises moving analytics, digital commerce, and collaboration workloads to the cloud create the largest single contributor to the application outsourcing market.
Hybrid models rise at a 9.81% CAGR because regulated industries cannot abandon on-premises systems overnight. Providers deliver Kubernetes-based toolchains that bridge data centers and hyperscaler regions, keeping latency and compliance in check. As this balance matures, the application outsourcing market share for on-premises environments gradually declines, yet on-premises remains relevant for ultra-low-latency or sovereign data tasks. The segment keeps providers busy governing network, identity, and observability layers across mixed estates.
By End-user Industry: Healthcare Accelerates After BFSI
BFSI generates USD 36.86 billion in 2025 and remains the anchor vertical, propelled by open-API ecosystems and stringent uptime standards. Its sizable budgets give banks leverage to demand outcome-linked contracts that improve fraud detection and customer onboarding speed. With 28.10% of 2025 revenue, BFSI remains the benchmark for large-scale deals inside the application outsourcing market.
Healthcare & Life Sciences grows fastest at 12.55% CAGR as providers digitize patient journeys and secure sensitive records. Rapid telehealth adoption, clinical-trial data platforms, and AI-enabled diagnostics lift demand for HIPAA-compliant cloud architectures. The application outsourcing market size committed by hospitals and pharma firms is projected to exceed USD 16.2 billion by 2031. Retail, manufacturing, telecom, and public sector generate incremental growth, each requiring verticalized accelerators that compress time-to-value.
By Organization Size: SMEs Move from Ad Hoc to Strategic
Large enterprises accounted for USD 80.49 billion in 2025, or 61.35% of revenue, because they manage sprawling portfolios across multiple business units. Their projects often span modernization, AI pilots, and cybersecurity in a single multi-year agreement, feeding scale to tier-1 vendors.
SMEs exhibit 10.62% CAGR, the highest in the application outsourcing market, as cloud platforms lower entry thresholds. Modern billing lets smaller firms switch fixed capital costs to predictable opex. Providers craft templated microservices and DevOps pipelines that fit mid-market budgets yet meet enterprise-grade security. The emphasis on ease of engagement reshapes go-to-market motions and expands total volume.
By Contract Model: Outcomes Trump Inputs
Fixed-price contracts still dominate with 47.35% of 2025 revenue because CFOs value budget accuracy. Even so, outcome-based agreements grow 13.68% CAGR and may represent a quarter of the application outsourcing market size by 2031. These deals tie revenue to performance metrics such as user adoption, release velocity, or cost per claim processed.
Time-and-material arrangements remain useful for exploratory builds, and Build-Operate-Transfer structures attract firms seeking eventual insourcing. A shift toward experience-level agreements focuses on employee satisfaction scores instead of pure uptime. Providers upgrade governance frameworks to monitor KPIs continuously, using observability tooling to prove delivered value.
Geography Analysis
North America generated USD 55.05 billion, equating to 41.95% of 2025 revenue within the application outsourcing market. Enterprises adopt AI, event-driven architectures, and zero-trust security at scale. Nearshore centers across Mexico, Colombia, and Costa Rica grow close to 20% annually, easing time-zone friction for agile teams.
Asia-Pacific posts the fastest 11.85% CAGR, with India, Vietnam, and the Philippines anchoring delivery. India alone targets USD 20.81 billion in software exports by 2029. China’s domestic cloud push opens fresh consulting work, while Australia and Singapore become regional hubs for regulated workloads. Wage inflation and attrition keep vendors investing in automation and second-tier cities.
Europe shows steady demand, shaped by data-sovereignty directives. Germany and the United Kingdom remain top buyers, and Poland, Romania, and Ukraine attract nearshore budgets from Western clients thanks to linguistic alignment. The Netherlands BPO market is tracking a 6.7% CAGR through 2025. Local cloud regions built by hyperscalers remove earlier latency barriers and support edge analytics deals.
Latin America, the Middle East, and Africa represent newer growth theaters. Brazil, Chile, and Argentina offer cost-competitive agile squads for North American firms. Gulf governments fund large digital services programs, creating demand for cloud and cybersecurity know-how, while South Africa and Nigeria develop fintech and telecom coding bases. Regulatory clarity and network capacity improvements will decide how much of the wider application outsourcing market these regions capture by 2030.

Competitive Landscape
The market remains moderately concentrated: the top 10 suppliers account for roughly 45% of 2024 revenue. Accenture leads, drawing USD 64.9 billion from work that blends cloud migration, managed security, and generative AI accelerators. NTT Data and Tata Consultancy Services follow, each near USD 30 billion. Their wide channel relationships and multi-continent delivery give them scale unmatched by pure-play application specialists.
Mid-tier players such as EPAM, LTI, and Luxoft focus on sector depth in automotive, banking, or embedded engineering. They win by supplying niche capabilities that larger providers integrate into end-to-end programs. Strategic alliances with hyperscalers become key: TCS formed its AI.Cloud unit to bundle domain-specific GenAI services with cloud landing zones. IBM’s USD 6.4 billion acquisition of HashiCorp boosts policy-as-code and multi-cloud automation.
Competitive intensity also rises in security, testing, and design. Boutique firms such as Cloudify, Mav3rik, and CloudDev are being absorbed to enrich consulting benches. Nearshore providers market cultural alignment and English fluency to pick up agile sprint overflow from U.S. clients. Price-led rivalry declines as outcome-driven KPIs push differentiation toward intellectual property and reference architectures.
Application Outsourcing Industry Leaders
Accenture Plc
IBM Consulting (IBM Corporation)
Tata Consultancy Services (TCS) Ltd.
Cognizant Technology Solutions Corporation
Wipro Limited
- *Disclaimer: Major Players sorted in no particular order

Recent Industry Developments
- May 2025: Accenture acquired Cloudify for USD 420 million to deepen European cloud-migration skills.
- April 2025: TCS launched its AI.Cloud unit and upskilled 300,000 staff on GenAI.
- March 2025: IBM finalized its USD 6.4 billion HashiCorp buy, adding infrastructure-as-code to its hybrid-cloud stack.
- February 2025: Infosys and Microsoft partnered to build vertical GenAI accelerators.
- February 2025: Virtusa purchased Mav3rik to enhance healthcare domain depth.
- January 2025: HCL Technologies launched Application Security-as-a-Service, combining AI scanning with global SOC teams.
- January 2025: Wipro rolled out an outcome-based application-management framework that links pricing to user experience KPIs.


Research Methodology Framework and Report Scope
Market Definitions and Key Coverage
Our study defines the global application outsourcing market as the value of contracts under which a client transfers the development, maintenance, modernization, or managed operation of business software to an external provider, regardless of whether work is delivered on-premise, near-shore, or offshore. Only fee-based services tied to discrete application scopes are counted; in-house shared services, pure infrastructure hosting, and one-time software licenses remain outside the boundary.
Scope exclusion: pure business-process outsourcing, hardware break-fix, and generic cloud hosting services are not included.
Segmentation Overview
- By Service Type
- Application Development and Integration
- Application Maintenance and Support
- Application Testing and QA
- Application Modernisation and Migration
- Application Security Services
- Others
- By Deployment Model
- On-premise
- Cloud
- Hybrid
- By End-user Industry
- BFSI
- Healthcare and Life Sciences
- Media and Entertainment
- Logistics and Transportation
- Retail and E-commerce
- Manufacturing
- Government and Public Sector
- IT and Telecom
- Other End-User Industries
- By Organisation Size
- Large Enterprises
- Small & Medium Enterprises (SMEs)
- By Contract Model
- Fixed-price
- Time and Material
- Outcome-based / Managed Services
- Build-Operate-Transfer (BOT)
- By Geography
- North America
- United States
- Canada
- Mexico
- South America
- Brazil
- Argentina
- Chile
- Rest of South America
- Europe
- Germany
- United Kingdom
- France
- Russia
- Italy
- Spain
- Rest of Europe
- Asia-Pacific
- China
- India
- Japan
- South Korea
- Australia
- Malaysia
- Singapore
- Rest of Asia-Pacific
- Middle East and Africa
- Middle East
- United Arab Emirates
- Saudi Arabia
- Turkey
- Rest of Middle East
- Africa
- South Africa
- Nigeria
- Rest of Africa
- Middle East
- North America
Detailed Research Methodology and Data Validation
Primary Research
We interviewed sourcing advisors, procurement heads in BFSI, retail, and healthcare, and senior delivery managers from tier-1 vendors across North America, Europe, and APAC. Their inputs clarified deal size thresholds, typical price per full-time equivalent, and the adoption pace of outcome-based contracts, allowing us to close gaps left by public data.
Desk Research
Mordor analysts began with structured reviews of open datasets from bodies such as the US Bureau of Labor Statistics, Eurostat, and India's Reserve Bank, which signal IT wage differentials and skills availability. Trade associations like Nasscom and the Business Services Leadership Council supply contract pipeline snapshots, while WTO customs records reveal cross-border services exports. Company 10-Ks, investor decks, and reputable media archives accessed through Dow Jones Factiva complemented these statistics. The illustration list above is not exhaustive; numerous additional publications were tapped for context, sanity checks, and historical patterning.
Market-Sizing & Forecasting
A top-down reconstruction anchored to national ICT spending and export receipts was built, then corroborated by selective bottom-up supplier roll-ups and sampled average selling price times volume checks. Key variables like enterprise software spend, cloud migration penetration, contract renewal cycles, digital transformation budgets, talent cost inflation, and regional exchange rate trends feed a multivariate regression that drives the 2025-2030 outlook. Where vendor disclosures were partial, ratio imputation against peer sets and deal flow trackers bridged gaps before final reconciliation.
Data Validation & Update Cycle
Outputs pass a two-step analyst peer review, variance sweeps against independent series, and anomaly re-checks with original interviewees. Reports refresh yearly, with interim revisions triggered by material events such as mega deals or regulatory shifts.
Why Mordor's Application Outsourcing Baseline Stands Up to Scrutiny
Published figures often diverge because firms pick different service baskets, currency bases, and refresh cadences.
Key gap drivers include: some publishers blend infrastructure or BPO revenue with application work, others apply aggressive double-digit price erosion, and several freeze exchange rates at contract signature rather than at reporting cut-off, whereas Mordor rolls forward spot averages and excludes non-application streams.
Benchmark comparison
| Market Size | Anonymized source | Primary gap driver |
|---|---|---|
| USD 131.22 B (2025) | Mordor Intelligence | - |
| USD 115.70 B (2023) | Regional Consultancy A | Includes adjacent infrastructure support and uses constant 2022 FX rates |
| USD 59.00 B (2024) | Global Consultancy B | Counts only new-build development deals, omits multiyear maintenance renewals |
| USD 90.00 B (2023) | Trade Journal C | Blends application revenue inside wider IT outsourcing totals, then allocates share by heuristic |
Taken together, the comparison shows that once apples to apples scope, live exchange rates, and both build as well as run services are aligned, Mordor's 2025 baseline offers decision-makers a balanced, transparent reference anchored in clearly traced variables and a repeatable sizing pathway.


Key Questions Answered in the Report
What is the current value of the application outsourcing market?
The market is valued at USD 142.53 billion in 2026 and is forecast to reach USD 215.46 billion by 2031.
Which service segment is growing fastest?
Application Security Services lead growth with a 12.61% CAGR as enterprises prioritize cyber risk mitigation.
Why are hybrid deployment models gaining traction?
Hybrid models balance cloud scalability with on-premise compliance, expanding at a 9.81% CAGR to meet data-sovereignty mandates.
How are outcome-based contracts changing vendor relationships?
They link fees to business results such as release velocity, opening a 13.68% CAGR opportunity for managed services.
Which region shows the highest growth rate?
Asia-Pacific expands at 11.85% CAGR due to rapid digital adoption and its established outsourcing talent base.
What is driving SME adoption of application outsourcing?
Access to specialized skills, cloud-first pricing, and the need for rapid digital transformation push SME outsourcing at an 10.62% CAGR.
Page last updated on:


