United States IT Outsourcing Market Size and Share
Market Overview
| Study Period | 2020 - 2031 |
|---|---|
| Forecast Data Period | 2026 - 2031 |
| Historical Data Period | 2020 - 2024 |
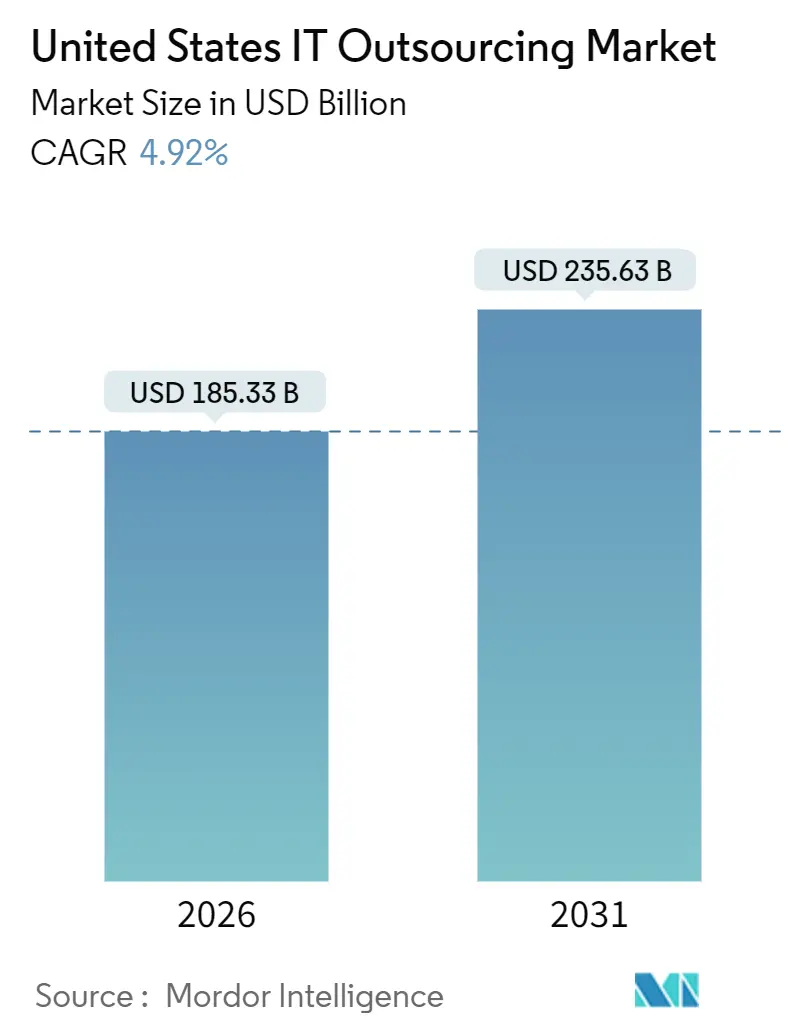
| Market Size (2026) | USD 185.33 Billion |
| Market Size (2031) | USD 235.63 Billion |
| Growth Rate (2026 - 2031) | 4.92% CAGR |
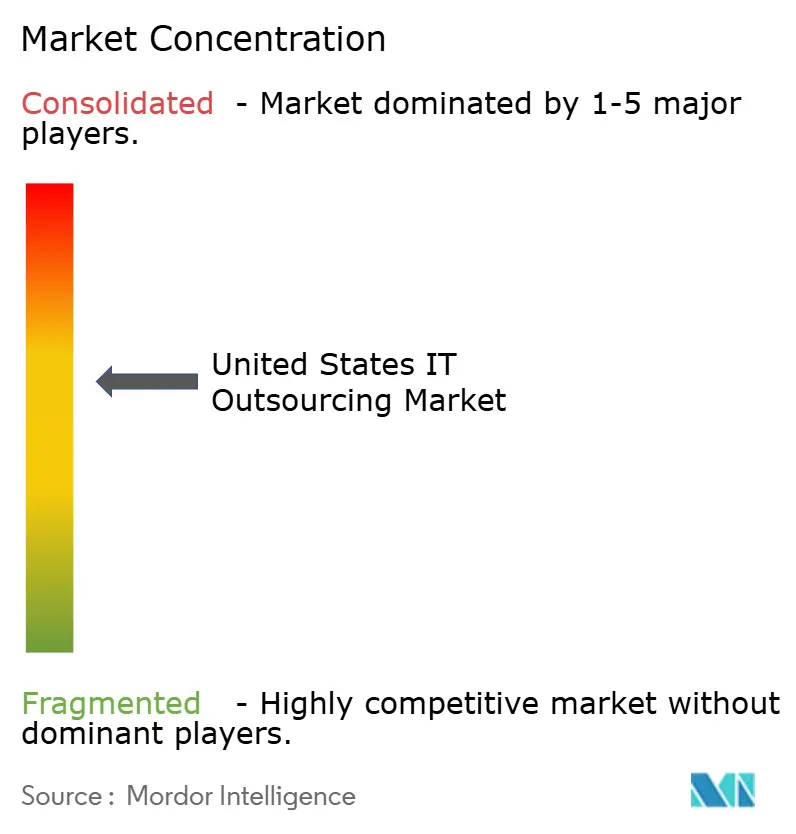
| Market Concentration | Medium |
Major Players *Disclaimer: Major Players sorted in no particular order Image © Mordor Intelligence. Reuse requires attribution under CC BY 4.0. | |
United States IT Outsourcing Market Analysis by Mordor Intelligence
The United States IT Outsourcing Market size is estimated at USD 185.33 billion in 2026, and is expected to reach USD 235.63 billion by 2031, at a CAGR of 4.92% during the forecast period (2026-2031).
Clients are shifting toward hybrid delivery that combines offshore centers with domestic integration hubs, a pattern spurred by CHIPS and Science Act incentives that reward on-shore value creation. State privacy statutes now require granular audit trails, forcing vendors to invest in multi-jurisdictional governance. Generative-AI tooling shortens development cycles, enabling vendors to absorb offshore wage inflation without proportional price hikes. Outcome-based agreements are gaining traction, aligning fees with uptime, defect density, or cost-per-transaction metrics. These trends collectively reshape the United States IT Outsourcing Market as vendors reposition around advisory and compliance-heavy services.
Key Report Takeaways
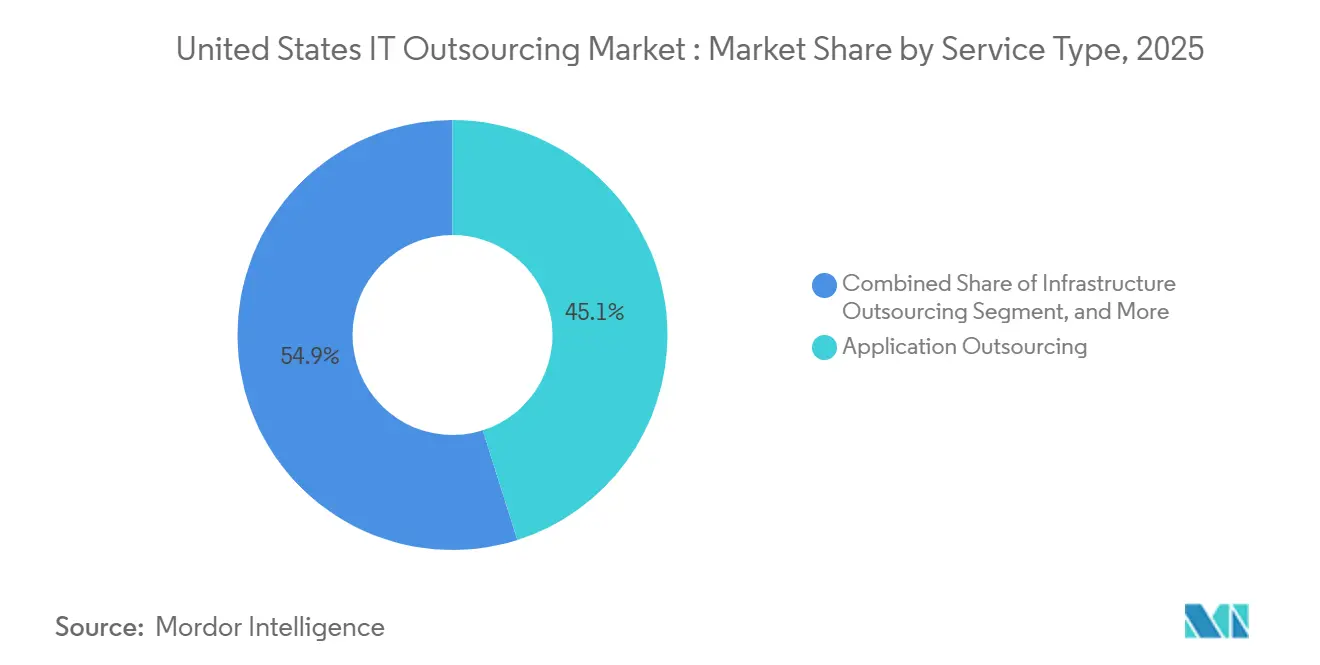
- By service type, application outsourcing led with 45.11% of the United States IT outsourcing market share in 2025. Infrastructure Outsourcing is projected to expand at a 5.08% CAGR through 2031, the fastest service-type growth.
- By enterprise size, large enterprises commanded 58.83% of spending in 2025; small and medium enterprises are advancing at a 5.64% CAGR to 2031.
- By end-user industry, BFSI held 24.26% share in 2025, while media and entertainment is forecast to rise at a 6.01% CAGR.
- By contract type, fixed-price deals represented 43.71% in 2025; outcome-based contracts are the fastest-growing at a 5.21% CAGR through 2031.
Note: Market size and forecast figures in this report are generated using Mordor Intelligence’s proprietary estimation framework, updated with the latest available data and insights as of January 2026.
Worldwide, activity is shaped by contributions from multiple countries and regions, with United states representing one among them. The global report on it outsourcing (ito) market by Mordor Intelligence reflects how these countries and regional layers combine into a single system.
United States IT Outsourcing Market Trends and Insights
Drivers Impact Analysis*
| Driver | (~) % Impact on CAGR Forecast | Geographic Relevance | Impact Timeline |
|---|---|---|---|
| Cost-optimization amid domestic tech-talent shortage | +1.2% | National, concentrated in technology hubs (San Francisco Bay Area, Austin, Boston, Seattle) | Medium term (2-4 years) |
| Digital-first transformation and cloud-migration momentum | +1.5% | National, with early adoption in coastal metros and Fortune 500 headquarters | Short term (≤ 2 years) |
| Enterprises focusing on core competencies via selective sourcing | +0.9% | National, particularly in manufacturing belt (Midwest) and energy corridor (Texas, Louisiana) | Long term (≥ 4 years) |
| Outcome-based pricing pressure under constrained IT budgets | +0.7% | National, accelerated in cost-sensitive sectors (retail, healthcare, state governments) | Medium term (2-4 years) |
| Federal CHIPS Act incentives reshaping on/near-shoring mix | +0.5% | Concentrated in semiconductor clusters (Arizona, Ohio, New York, Texas) | Long term (≥ 4 years) |
| Generative-AI-assisted coding boosting vendor productivity | +0.8% | National, with offshore delivery centers in India, Philippines, and Eastern Europe benefiting | Short term (≤ 2 years) |
| Source: Mordor Intelligence | |||
Cost-Optimization Amid Domestic Tech-Talent Shortage
Median U.S. software-engineer salaries climbed to USD 130,000 in 2025 while unemployment in computer occupations hovered near 2.1%, underscoring a persistent skills gap. Enterprises, therefore, lean on global delivery, pairing U.S. architects with offshore developers to save roughly 40% on blended rates. Second-tier tech hubs such as Austin, Raleigh, and Denver feel this pressure acutely, as startups and incumbents compete for the same talent pools. Vendors position hybrid teams as resilient to localized shortages and capable of 24-hour development cycles. The practice both cuts costs and compresses release timelines, reinforcing the appeal of the United States IT Outsourcing Market to buyers seeking rapid modernization.
Digital-First Transformation and Cloud-Migration Momentum
U.S. enterprise cloud spend exceeded USD 200 billion in 2025, led by infrastructure- and platform-as-a-service workloads that require containerization and observability expertise. Outsourcing vendors absorb migration risk by orchestrating cutovers and post-migration tuning, a capability that accelerates public-sector adoption following the Department of Defense cloud-first mandate.[1]U.S. Department of Defense, “DoD Cloud Strategy,” dod.mil FedRAMP-authorized providers enjoy a captive market, raising entry barriers for offshore-only rivals lacking U.S. data-center footprints. Cloud momentum, therefore, fuels sustained growth in the United States IT Outsourcing Market.
Enterprises Focusing on Core Competencies via Selective Sourcing
CFOs scrutinized technology spend during the 2025 slowdown, accelerating selective sourcing that outsources network monitoring and help-desk functions while keeping customer-facing digital assets in-house. Manufacturing clients, for instance, externalize ERP upkeep to free staff for Industry 4.0 projects such as predictive maintenance. Vendors respond by bundling commodity services into flat-rate agreements and cross-selling high-margin advisory work in data-mesh governance. Winning contracts now requires vertical insight, not mere scale, intensifying competition inside the United States IT Outsourcing Market.
Outcome-Based Pricing Pressure Under Constrained IT Budgets
Outcome-based contracts covered 43% of new U.S. outsourcing deals in 2025, up from 38% a year earlier, as buyers tied fees to measurable metrics such as 99.9% application uptime. Vendors embed AI-driven anomaly detection, predictive capacity planning, and automated remediation to hit these thresholds, shifting performance risk onto themselves. Margins compress initially, favoring large suppliers that can absorb tooling costs. The model nevertheless deepens client stickiness, encouraging multi-year renewals that stabilize revenue in the United States IT Outsourcing Market.
Restraints Impact Analysis*
| Restraint | (~) % Impact on CAGR Forecast | Geographic Relevance | Impact Timeline |
|---|---|---|---|
| Escalating data-security and compliance liabilities | -0.6% | National, intensified in states with stringent privacy laws (California, Virginia, Colorado, Connecticut) | Short term (≤ 2 years) |
| Integration complexity in a fragmented provider ecosystem | -0.4% | National, acute in enterprises managing 5+ outsourcing vendors simultaneously | Medium term (2-4 years) |
| Offshore wage inflation eroding labor-arbitrage advantage | -0.5% | Offshore delivery hubs (India, Philippines, Eastern Europe, Latin America) with spillover to U.S. pricing | Medium term (2-4 years) |
| State-level data-residency statutes raising governance costs | -0.3% | State-specific (California CCPA, Virginia VCDPA, Colorado CPA, Connecticut CTDPA) | Long term (≥ 4 years) |
| Source: Mordor Intelligence | |||
Escalating Data-Security and Compliance Liabilities
Amended Regulation S-P requires financial institutions to notify regulators within 30 days of breaches affecting 500 or more consumers, raising legal exposure for vendors handling BFSI workloads.[2]U.S. Securities and Exchange Commission, “Regulation S-P: Safeguarding Customer Information,” sec.gov Cyber-insurance premiums for service providers jumped 18% in 2025, as underwriters demanded proof of zero-trust architectures. Smaller firms unable to meet these obligations exited highly regulated verticals, concentrating share among Tier-1 players. Across healthcare and state-government accounts, a patchwork of breach-notification laws amplifies compliance overhead, tempering growth in the United States IT Outsourcing Market.
Integration Complexity in a Fragmented Provider Ecosystem
Enterprises that juggle five or more vendors witness total cost of ownership inflate by up to 20% because of overlapping tool chains and unclear ticket ownership. Mixing hyperscaler professional services with traditional systems integrators adds layers of proprietary automation that resist interoperability. Some clients appoint a lead integrator, but this introduces extra fees and potential conflicts of interest. The coordination burden slows incident resolution and blunts expected savings, acting as a drag on expansion within the United States IT Outsourcing Market.
*Our forecasts treat driver/restraint impacts as directional, not additive. The impact forecasts reflect baseline growth, mix effects, and variable interactions.
Segment Analysis
By Service Type: Application Modernization Extends Lead
Application Outsourcing accounted for 45.11% of 2025 spend, as firms rushed to re-platform legacy estates before vendor support sunsets. Generative-AI coding assistants and automated regression testing trimmed ticket volumes, reducing maintenance cost yet boosting modernization demand. Cloud migration incentives, such as AWS .NET Modernization credits of up to USD 500,000, supported this push.[3]Amazon Web Services, “.NET Modernization Program,” aws.amazon.com Infrastructure Outsourcing is forecast to grow at 5.08% through 2031, supported by managed Kubernetes, SD-WAN, and FedRAMP-compliant SASE offerings. High-density GPU colocation for AI training commands premium rates, offsetting price erosion in traditional data-center racks. The United States IT Outsourcing market size for Infrastructure Outsourcing is therefore poised to expand faster than the overall market.
Vendor strategy now pivots to platform-led delivery. Managed Kubernetes clusters, database-as-a-service, and automated observability tools reduce labor intensity. Vendors bundle these with advisory services around zero-trust security, creating integrated propositions that defend margin. Clients value consumption-based models that replace capex with opex, so providers embed flexible SLAs that align fees with resource utilization. As a result, Application Outsourcing retains scale while Infrastructure Outsourcing delivers the strongest incremental lift to the United States IT Outsourcing Market.


By Enterprise Size: SME Cloud Momentum Outpaces Large-Enterprise Volume
Large Enterprises captured 58.83% of 2025 revenue, leveraging master service agreements to lock in discounts and payment terms. They pursue modular contracts that carve out specific towers, preserving optionality to pivot providers. Conversely, Small and Medium Enterprises are projected to post a 5.64% CAGR to 2031 as bundled SaaS packages like Microsoft’s Azure for SMB, priced from USD 2,500 per month, eliminate capital outlays. Google Cloud waives egress fees for the first 10 terabytes, further lowering adoption barriers.
The United States IT Outsourcing market for SMEs is still smaller than that for Large Enterprises, yet growth is rapid. Vertical SaaS, from cloud EHRs in healthcare to turnkey e-commerce suites in retail, effectively functions as outsourcing. These platforms bundle hosting, security, and help-desk support, allowing firms with fewer than 500 employees to access enterprise-grade capabilities. Large Enterprises, meanwhile, increase selective sourcing, retaining customer-experience platforms in-house while offloading infrastructure monitoring. This bifurcated pattern ensures expansion across both segments, reinforcing resilience in the United States IT Outsourcing Market.
By End-User Industry: Media and Entertainment Drives Fastest Growth
BFSI maintained a 24.26% share in 2025, anchored by outsourced core banking and regulatory reporting systems. Regulation S-P compliance requirements further locked in vendors with robust incident-response capabilities. Media and Entertainment is forecast to grow at 6.01% through 2031, as streaming providers migrate transcoding and ad-insertion workloads to edge clouds. Paramount Global consolidated 14 data centers into Google Cloud in 2024, cutting delivery costs 30%. Such high-visibility wins showcase the value of specialized outsourcing for latency-sensitive video workloads.
Retail and E-commerce emphasize unified commerce platforms, while Manufacturing channels spend toward Industry 4.0 predictive maintenance. Government clients adopt sovereign-cloud services compliant with Executive Order 14028 requirements, and Energy firms shift SCADA monitoring to hybrid clouds. This industry mosaic underpins diversified demand, ensuring continued momentum in the United States IT Outsourcing market share across sectors.

By Contract Type: Outcome-Based Models Gain Ground
Fixed-price agreements retained a 43.71% share in 2025, preferred for clearly scoped migrations where clients demand budget predictability. Outcome-based contracts, though smaller, are growing fastest, with a 5.21% CAGR, as buyers link fees to business metrics. Typical thresholds include 99.9% uptime and four-hour mean time to resolution, with penalties approaching 10% of monthly fees for deviations. The United States IT Outsourcing market size tied to time-and-materials remains significant for exploratory or R&D projects.
Outcome-based models compel vendors to embed telemetry and AI-driven anomaly detection, which raises upfront investment but deepens long-term relationships. Providers that master this model differentiate through proactive governance dashboards visible to client CIOs. Smaller specialists retreat toward niche domains such as healthcare compliance, where domain expertise offsets risk. The resulting contract-mix evolution enhances transparency and shifts value toward managed services in the United States IT Outsourcing Market.
Geography Analysis
The United States accounted for the full USD 185.33 billion market size in 2026, yet delivery footprints are global. Offshore centers in India and the Philippines handle roughly 55%-60% of the workload, though wage inflation of 8%-10% in 2024 narrowed historical cost gaps. Vendors offset this by automating coding, testing, and incident triage, allowing smaller on-shore teams to manage larger portfolios. Near-shore hubs in Mexico and Costa Rica gain relevance by offering four-hour time-zone alignment for semiconductor clients clustered in Arizona, Texas, and Ohio after CHIPS Act investments.
Inside the United States, regional demand mirrors industry clusters. The Bay Area and Seattle concentrate cloud migrations and AI model training. New York and Boston drive BFSI outsourcing, while the Midwest fuels Industry 4.0 modernizations. Texas and Louisiana anchor energy-sector deals focused on SCADA modernization. State privacy laws in California, Virginia, Colorado, and Connecticut mandate in-state data residency, prompting vendors to design multi-cloud architectures that comply with heterogeneous regulations.
Geopolitical risk in Eastern Europe spurs clients to diversify into Latin America, though talent pools there remain smaller. Vendors therefore invest in training academies to scale near-shore capacity. Overall, delivery is rebalancing: offshore headcount growth slows, near-shore accelerates, and on-shore stabilizes as AI tools raise productivity. This hybrid footprint sustains momentum in the United States IT Outsourcing Market while meeting evolving compliance demands.
Competitive Landscape
The top five providers, Accenture, IBM, Tata Consultancy Services, Cognizant, and Infosys, collectively account for a considerable share of revenue, leaving significant fragmentation. Competition centers on platform-led delivery, hyperscaler alliances, and outcome-based pricing. Accenture’s myWizard and Infosys Nia automation suites lock in clients by embedding proprietary AI into delivery. IBM partners with AWS for mainframe-to-cloud conversions, while Cognizant teams with Google Cloud on DevOps-heavy migrations. White-space opportunities emerge in outcome-guaranteed modernization for mid-market manufacturers, sovereign-cloud managed services for state agencies, and AI-ops platforms that preempt SLA breaches.
Smaller specialists use domain focus to win share. EPAM Systems leverages fiduciary expertise to modernize wealth-management portals, while Tech Mahindra applies telecom knowledge to private 5G rollouts. Rackspace Technology positions as a vendor-neutral managed-cloud provider for clients wary of hyperscaler lock-in. Generative-AI tooling offers short-term cost advantages, but differentiation is shifting toward deeper advisory in data mesh, AI governance, and zero-trust architecture.
Margin pressure persists, with vendors discounting assessment phases to secure multi-year deals. Yet outcome-based renewals stabilize revenue streams for those that invest in observability and automation. The United States IT Outsourcing Market therefore exhibits moderate concentration and high competitive intensity, as firms race to embed intellectual property and deepen client intimacy.
United States IT Outsourcing Industry Leaders
Accenture Plc
IBM Corporation
Cognizant Technology Solutions Corporation
TCS Limited
Infosys Limited
- *Disclaimer: Major Players sorted in no particular order

Recent Industry Developments
- October 2025: Accenture announced a USD 3 billion, three-year investment to expand AI and data-analytics capabilities, opening delivery centers in Phoenix and Columbus to serve CHIPS Act clients.
- September 2025: IBM and AWS extended their partnership to provide automated mainframe-to-cloud migration services targeting COBOL workloads.
- August 2025: Tata Consultancy Services launched an AWS Generative AI Practice backed by USD 500 million to train 50,000 consultants.
- July 2025: Cognizant acquired Belcorp for USD 1.2 billion, adding 3,000 Kubernetes and Terraform engineers to bolster cloud-native delivery.
- June 2025: Infosys and Microsoft committed USD 2 billion to accelerate Azure and Dynamics 365 adoption, establishing joint innovation centers in Dallas, Atlanta, and Boston.


Research Methodology Framework and Report Scope
Market Definitions and Key Coverage
Our study, in line with Mordor Intelligence's framework, views the United States IT outsourcing market as the revenue generated when domestic organizations entrust external providers with application development and maintenance, infrastructure hosting and monitoring, cloud enablement, and selective business-critical IT services that sustain day-to-day digital operations. The boundary is national spend, regardless of whether delivery is on-shore, near-shore, or off-shore.
Scope Exclusion: Pure-play business process outsourcing, contact-center work, and engineering services are left outside this calculation to keep the focus squarely on technology functions.
Segmentation Overview
- By Service Type
- Application Outsourcing
- Development
- Maintenance and Support
- Testing
- Modernisation
- Infrastructure Outsourcing
- Data-center
- Network
- End-user/Device
- Cloud Infrastructure
- Business Process and Other IT Services
- Application Outsourcing
- By Enterprise Size
- Small and Medium Enterprises
- Large Enterprises
- By End-user Industry
- BFSI
- IT and Telecom
- Government and Public Sector
- Retail and E-commerce
- Manufacturing
- Energy, Utilities and Mining
- Healthcare and Life Sciences
- Media and Entertainment
- By Contract Type
- Fixed-price
- Time-and-materials
- Outcome-based
Detailed Research Methodology and Data Validation
Primary Research
Mordor analysts hold structured discussions with U.S. CIOs, sourcing advisors, and delivery-center heads across banking, healthcare, manufacturing, and digital-native firms. They then run validation calls with pricing specialists in Texas, California, and Virginia. These interviews refine average deal size, off-shore share, and transition timelines that secondary material cannot capture.
Desk Research
We start by mapping publicly available anchors from sources such as the Bureau of Economic Analysis IT services output tables, the U.S. International Trade Commission ICT trade grid, CompTIA's State of the Tech Workforce, and the Federal Procurement Data System contract archive. Company filings, SEC 10-K breakouts, selected IEEE papers on cloud adoption, and paid access to D and B Hoovers and Dow Jones Factiva enrich trend detection and competitive benchmarking. This constellation frames historical spend, provider concentration, and contract patterns. The list is illustrative; many other documents guide our fact finding.
Market-Sizing & Forecasting
A top-down rebuild begins with 2024 enterprise IT spend and isolates the outsourcing slice by applying penetration ratios drawn from interviews, BEA investment series, and cloud-migration benchmarks. Bottom-up spot checks use sampled provider revenues and typical price-per-seat contracts to stress-test totals. Key model inputs include managed-cloud workload growth, federal cybersecurity mandates, unemployment-adjusted wage gaps, average contract duration, and foreign-exchange-adjusted off-shore billing rates. Multivariate regression, blended with three economic scenarios, projects values through 2030.
Data Validation & Update Cycle
Outputs undergo variance scans against quarterly provider disclosures, customs-reported ICT service imports, and BLS wage indices. Senior reviewers sign off only after anomalies are resolved. Reports refresh annually; yet sudden regulatory or macro events trigger interim updates so clients receive the latest baseline.
Why Mordor's United States IT Outsourcing Baseline Stands Up to Scrutiny
Published estimates often diverge because some publishers mix BPO revenue with IT work, adopt different contract cut-off points, or apply global-to-US ratios. Our disciplined scoping, refreshed data cadence, and dual-path modeling keep variance tight.
Differences show that when scope inflates or regional proxies replace local inputs, totals jump sharply. By tracing every assumption back to observable metrics and live executive feedback, Mordor delivers the balanced figure that strategy teams trust.
Benchmark comparison
| Market Size | Anonymized source | Primary gap driver |
|---|---|---|
| USD 191.28 B (2025) | Mordor Intelligence | |
| USD 250.0 B (2025) | Regional Consultancy A | Adds telecom infrastructure and partial BPO revenue, minimal primary validation |
| USD 931.59 B (2024) | Trade Journal B | Bundles all outsourcing services and rolls down from global ratios without US-specific contract datasets |
Differences show that when scope inflates or regional proxies replace local inputs, totals jump sharply. By tracing every assumption back to observable metrics and live executive feedback, Mordor delivers the balanced figure that strategy teams trust.


Key Questions Answered in the Report
How large is the United States IT Outsourcing Market in 2026?
It reached USD 185.33 billion and is projected to climb to USD 235.63 billion by 2031.
Which service type leads spending?
Application Outsourcing led with 45.11% share in 2025, driven by legacy-system modernization before support deadlines.
What segment is growing fastest?
Infrastructure Outsourcing is forecast to expand at a 5.08% CAGR between 2026 and 2031 due to managed Kubernetes and SASE demand.
Why are outcome-based contracts rising?
Buyers want vendor fees tied to metrics like uptime and resolution time, so outcome-based deals grew to 43% of new contracts in 2025.
How does wage inflation abroad affect U.S. outsourcing?
Indian wages rose up to 10% in 2024, narrowing cost differentials, prompting vendors to deploy AI and shift work to near-shore hubs.
Which industry will drive future growth?
Media and Entertainment, expanding at a 6.01% CAGR, will lead as streaming platforms migrate workloads to edge clouds.
Page last updated on:


