
Animal Growth Promoters Market Size and Share
Market Overview
| Study Period | 2021 - 2031 |
|---|---|
| Market Size (2026) | USD 20.58 Billion |
| Market Size (2031) | USD 27.63 Billion |
| Growth Rate (2026 - 2031) | 6.08 % |
| Fastest Growing Market | Asia Pacific |
| Largest Market | Asia-Pacific |
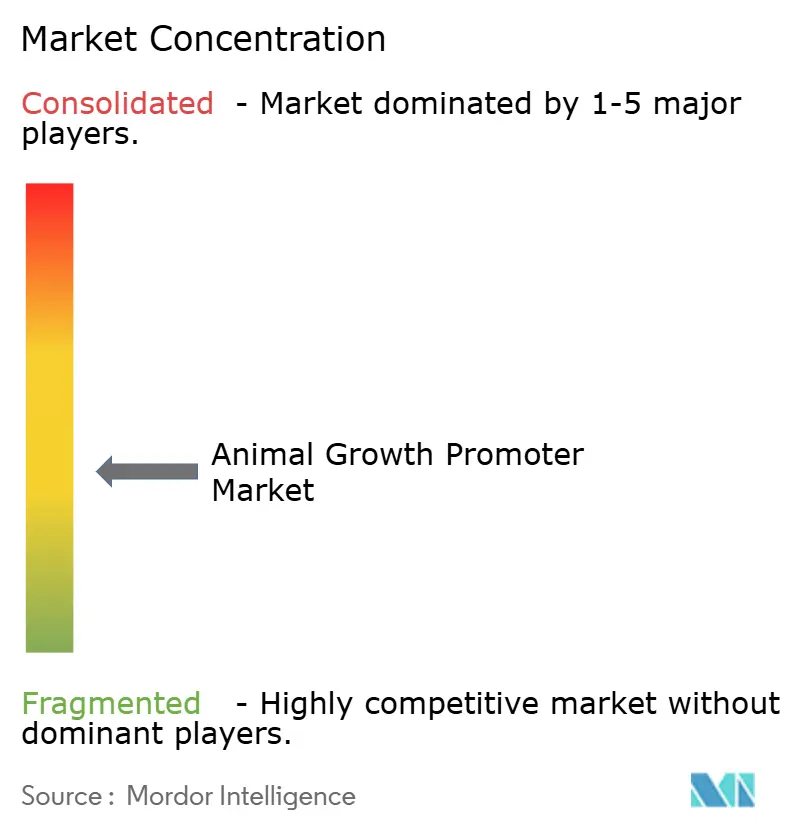
| Market Concentration | Medium |
Major Players *Disclaimer: Major Players sorted in no particular order Image © Mordor Intelligence. Reuse requires attribution under CC BY 4.0. | |
Animal Growth Promoters Market Analysis by Mordor Intelligence
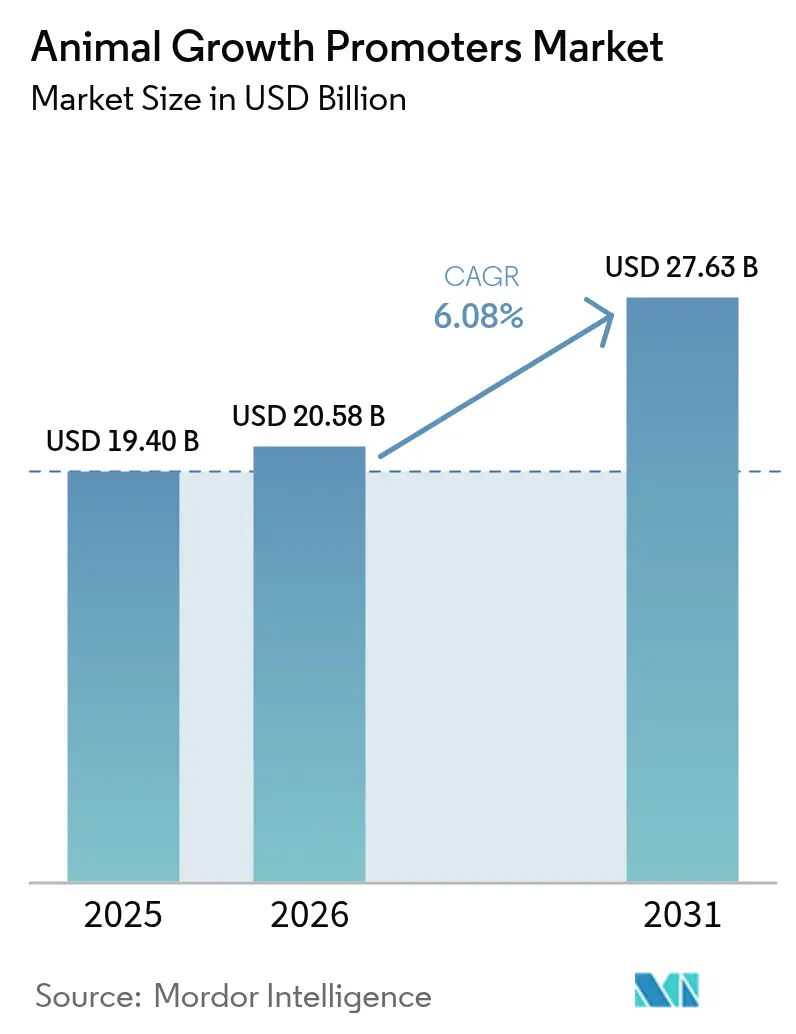
Animal Growth Promoter Market size in 2026 is estimated at USD 20.58 billion, growing from 2025 value of USD 19.40 billion with 2031 projections showing USD 27.63 billion, growing at 6.08% CAGR over 2026-2031. This solid trajectory mirrors the livestock sector’s transition toward functional nutrition that keeps animals healthy while trimming the environmental impact of production. Rising consumer insistence on antibiotic-free meat, stricter regulations across major export hubs, and sustained protein demand in Asia-Pacific collectively widen commercial headroom for manufacturers. Intensifying price pressure on traditional protein meals amplifies interest in enzymes and probiotics that unlock more nutrients from every kilogram of feed. Digitalization inside mills, especially AI-enabled micro-dosing, reduces waste and aligns additive inclusion rates with real-time animal needs, preserving margins even when raw-material costs swing sharply. Momentum toward carbon-neutral farming further elevates biological solutions such as Bacillus-based probiotics that deliver both performance and sustainability benefits.
Key Report Takeaways
- By product type, probiotics led with 34.12% of animal growth promoters' market share in 2025, while phytogenics are forecast to accelerate at a 8.9% CAGR through 2031.
- By animal type, poultry commanded a 37.10% share of the animal growth promoters market size in 2025, and aquaculture is projected to expand at an 8.22% CAGR by 2031.
- By form, dry additives accounted for 61.85% of the animal growth promoters market size in 2025, the liquid formulations are advancing at a 8.95% CAGR through 2031.
- By source, bacteria accounted for 69.45% of the animal growth promoters market size in 2025, and yeast is advancing at a 8.62% CAGR through 2031.
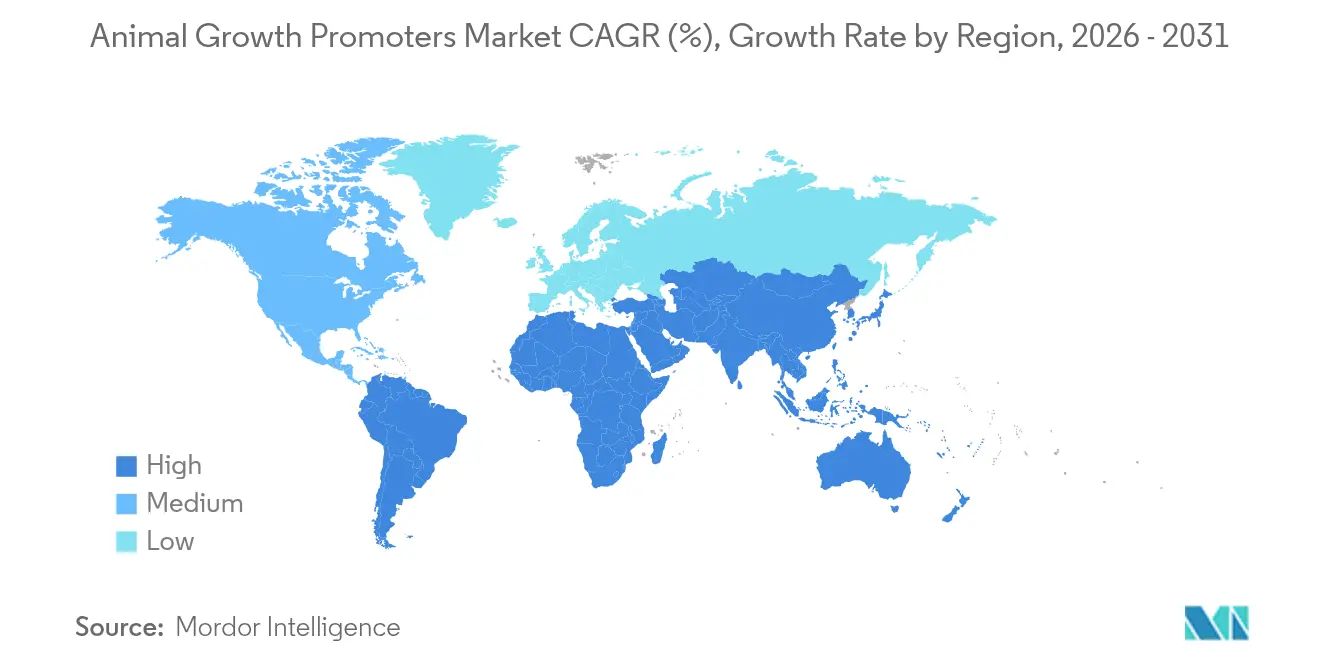
- By geography, Asia-Pacific captured 41.25% of 2025 revenue, and it is also the fastest-growing region at 7.64% CAGR to 2031.
Note: Market size and forecast figures in this report are generated using Mordor Intelligence’s proprietary estimation framework, updated with the latest available data and insights as of 2026.
Market Trends and Insights
Drivers Impact Analysis of Animal Growth Promoters Market*
| Driver | (~)% Impact on CAGR Forecast | Geographic Relevance | Impact Timeline |
|---|---|---|---|
| Global antibiotic-free meat demand boom | +1.8% | Global, strongest in North America and EU | Medium term (2-4 years) |
| Intensifying large-scale livestock production and feed efficiency focus | +1.2% | Asia-pacific core, spill-over to South America | Long term (≥ 4 years) |
| Probiotic manufacturing cost-parity with ionophores | +0.9% | Global, especially emerging markets | Short term (≤ 2 years) |
| Postbiotic gut-microbiome breakthroughs boosting growth performance | +0.7% | North America and EU, expanding to Asia-pacific | Medium term (2-4 years) |
| Carbon-neutral bioreactor technologies slashing Bacillus costs | +0.5% | Global, led by developed markets | Long term (≥ 4 years) |
| AI-driven precision micro-dosing in feed mills | +0.3% | North America and EU, selective Asia-pacific adoption | Medium term (2-4 years) |
| Source: Mordor Intelligence | |||


Global Antibiotic-Free Meat Demand Boom
Retailers and quick-service restaurants now stipulate antibiotic-free supply chains, prompting producers worldwide to invest in natural alternatives that preserve growth performance. This trend is especially strong in the poultry and swine sectors, where antibiotic-free labeling boosts marketability. EU prohibitions on antimicrobial growth promoters have already shown a clear template, and North American grocers offer premiums of 15-25% for certified products. The animal growth promoters market, therefore, gains a steady demand floor from both regulation and consumer willingness to pay.
Intensifying Large-Scale Livestock Production and Feed Efficiency Focus
Mega farms in Asia-Pacific and South America aim for ever-lower feed conversion ratios to offset volatile grain prices. Producers now target sub-2.0 FCR in broilers and sub-2.5 in swine by leveraging enzymes that lift nutrient digestibility by 3-5% and targeted probiotic strains that shave 2-4% off feed needs. With global feed output dipping 0.2% to 1.29 billion metric tons in 2024, efficiency gains, not tonnage, will fuel growth.[1]Alltech, “2024 Global Feed Survey,” alltech.com These imperatives reinforce premium demand for advanced solutions and expand the animal growth promoters market in value terms.
Probiotic Manufacturing Cost-Parity with Ionophores
Solid-state fermentation, automated downstream processing, and spray-dried formats have narrowed probiotic delivered costs to USD 2–3 per metric ton of feed, similar to ionophore benchmarks. Chinese leader Beijing Scitop Bio-tech earned 76.5% of its CNY 302.79 million (USD 42.13 million) 2024 revenue from probiotic sales, illustrating commercial traction. As affordability converges, adoption grows fast in price-sensitive regions, further enlarging the animal growth promoters market.
Postbiotic Gut-Microbiome Breakthroughs Boosting Growth Performance
Researchers demonstrate that postbiotic metabolites can lift intestinal barrier function by 25-30% and curb pathogens more reliably than live cultures. Because they remain stable during pelleting and storage, these compounds sidestep cold-chain challenges. Scaling precision fermentation unlocks consistent supply, pointing to fresh revenue layers inside the broader animal growth promoters market.
Restraints Impact Analysis of Animal Growth Promoters Market*
| Restraint | (~) % Impact on CAGR Forecast | Geographic Relevance | Impact Timeline |
|---|---|---|---|
| Feed-grade organic-acid price volatility | -0.8% | Global, severe in import-dependent regions | Short term (≤ 2 years) |
| Rapidly evolving global AGP regulatory restrictions | -0.6% | Global, varying timelines | Medium term (2-4 years) |
| Fermentation-grade sugar supply bottlenecks for probiotics | -0.4% | Global, concentrated in key hubs | Short term (≤ 2 years) |
| Mycotoxin interactions reducing additive efficacy | -0.3% | Global, seasonal variations | Long term (≥ 4 years) |
| Source: Mordor Intelligence | |||
Feed-Grade Organic-Acid Price Volatility
Formic-acid costs swung 40-60% in 2024, influenced by natural gas price spikes and unplanned shutdowns at a handful of large plants. Propionic-acid benchmarks climbed to multi-year highs, eroding feed-mill margins and prompting ration cuts or cheaper substitutes. For small mills without long-term contracts, this instability dampens the appetite for premium inclusions and temporarily tempers the animal growth promoters' market expansion.
Rapidly Evolving Global AGP Regulatory Restrictions
China’s 2024 tightening of antibiotic rules followed earlier EU measures, creating a mosaic of standards that complicates additive registration and forces producers to juggle multiple labels. Delays between AGP bans and approval of alternatives can open short-term product gaps, slowing near-term growth even as long-term demand remains positive.
*Our forecasts treat driver/restraint impacts as directional, not additive. The impact forecasts reflect baseline growth, mix effects, and variable interactions.
Animal Growth Promoters Market Segment Analysis
By Type:
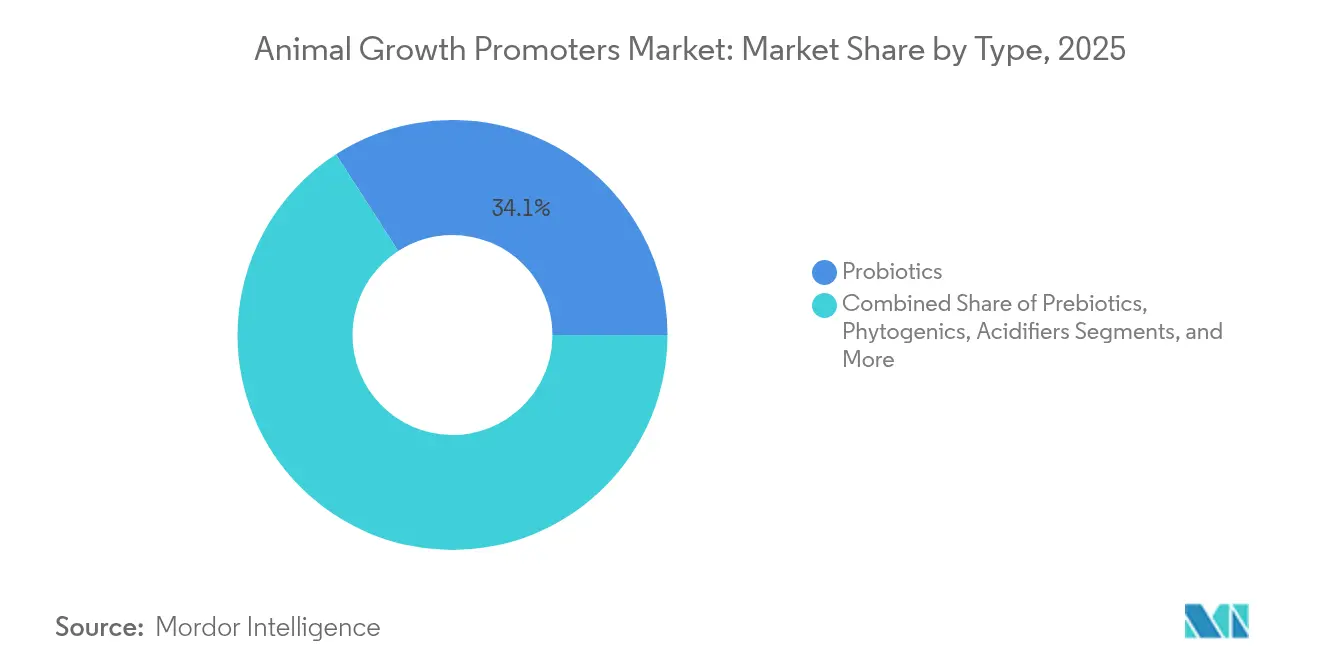
Probiotics Lead While Phytogenics SurgeProbiotics generated 34.12% of global revenue in 2025, supported by robust validation of Bacillus and Lactobacillus strains that consistently enhance feed efficiency and gut health. This leadership bolsters the overall animal growth promoters market, as integrated producers increasingly blend multi-strain consortia into every diet phase to offset AGP withdrawal. The sizable installed base encourages Research and Development into spore-forming variants that can withstand pelleting temperatures, further widening use cases. The phytogenic niche, already a USD 523.7 million category, advances at a forecast 8.9% CAGR, outpacing all other groups thanks to natural coloration, antioxidative, and antimicrobial benefits that dovetail with clean-label demands. Enzymes continue to draw investment because thermostable designs survive high-temperature pelleting, unlocking otherwise lost nutrients in lower-grade grains. Meanwhile, acidifiers hold steady, especially in tropical climates where feed spoilage risk is acute.
Momentum in phytogenics spills into combinatory products that tap the synergistic effects of essential oils plus organic acids, delivering stronger pathogen suppression than either class alone. Adoption is strongest in swine and poultry, where disease pressure and antibiotic curbs converge. Prebiotics gain traction as companion ingredients that nourish resident microbiota and reinforce probiotic colonization. Antibiotics and ionophores retreat but remain present in regions lacking strict rules. The animal growth promoters market continues its pivot toward biological or plant-derived variants. As data accumulate, even conservative ruminant operations adopt phytogenic blends seeking methane mitigation to meet upcoming carbon audits. Commercial players respond by scaling solvent-free extraction methods, ensuring consistent active compound loads while meeting environmental expectations.


By Animal Type:
Poultry Dominance Challenged by Aquaculture GrowthPoultry captured 37.10% of 2025 revenue, reflecting the category’s global popularity and responsiveness to nutritional fine-tuning. Integrators invest in animal growth promoters to maintain growth despite antibiotic limits, and advanced formulations are credited with lowering flock mortality by 4-6% in large commercial setups. Usage intensity is poised to deepen as AI-assisted broiler management platforms prescribe additive inclusion rates based on sensor data. Aquaculture expands fastest at an 8.22% CAGR, driven by escalating fishmeal costs and the push for sustainable aquatic diets. As shrimp farmers in Southeast Asia integrate probiotic and enzyme blends, they report feed conversion improvements of 6-8%, underlining the segment’s commercial payoff.
Swine producers adopt phase-feeding programs where acidifiers curb post-weaning diarrhea, and enzymes unlock energy from high-fiber rations, sustaining a solid share of the animal growth promoters market. Ruminants contribute a stable demand for methane-reducing compounds such as Bovaer, newly cleared for UK use in December 2024. Specialty segments, horses, pets, and niche exotics—consume small volumes yet deliver premium margins because owners seek functional, human-grade ingredients. Across species, integrators demand proof of ROI, spurring suppliers to produce field-data dashboards that link additive regimes to growth and health outcomes.
By Form:
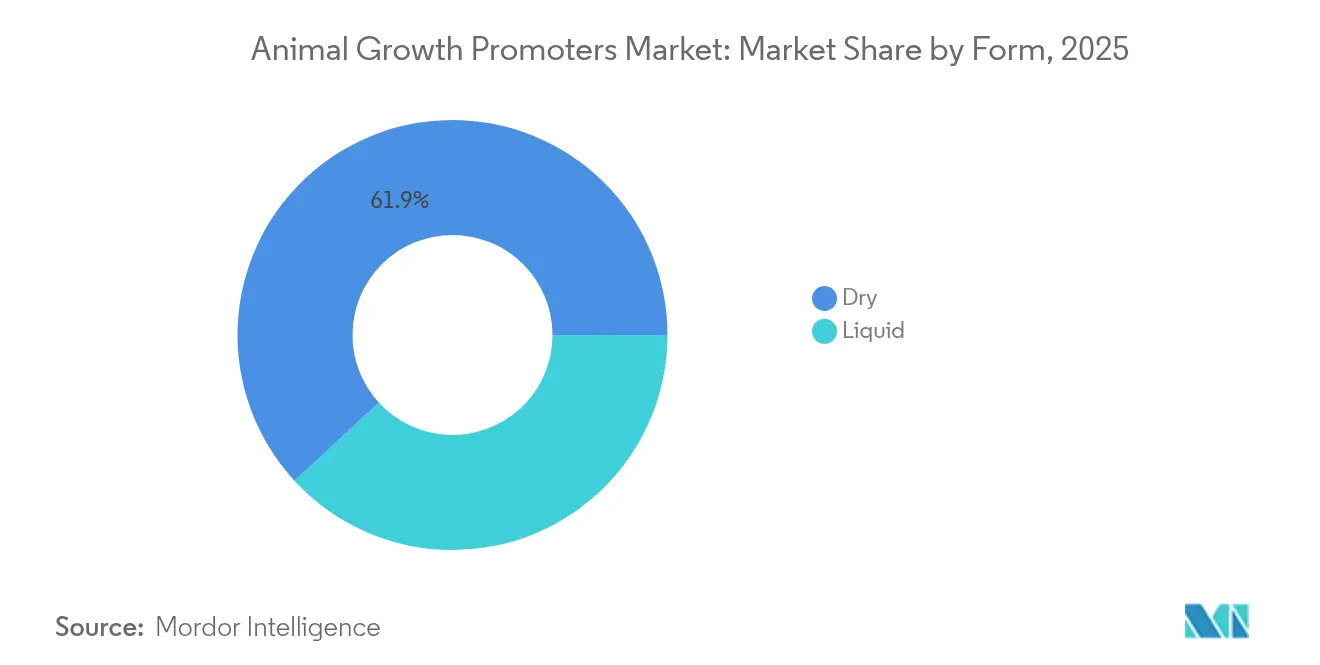
Liquid Gains Despite Dry DominanceDry formats retained 61.85% of sales in 2025, driven by compatibility with standard mixing lines and easy bulk transport. They dominate traditional mills where capital budgets limit retrofits for online dosing, preserving their anchor position in the animal growth promoters market. Enhanced microencapsulation, using lipid or polymer shells, further protects sensitive bio-actives through pelleting stress, ensuring that dry offerings remain technologically relevant. Yet liquid formulations outpace with a 8.95% CAGR, propelled by precision dosing equipment that synchronizes with automated batching. Liquid enzymes achieve quicker dispersion, reducing hot spots and ensuring uniform enzyme exposure, which is valuable as ingredient mash compositions fluctuate.
Early-stage liquid phytogenic concentrates also gain traction, offering higher purity at lower inclusion rates. In high-capacity US plants, centralized pump manifolds now meter up to eight liquid additives simultaneously, cutting labor costs. Spray-dry hybrid formats blur category lines by starting as liquids for fermentation, and then converting to powders that hydrate on contact, giving formulators flexibility. This trend reduces the infrastructure barrier for mills weighing the shift toward liquids while retaining the shelf-life appeal of dries, further enlarging the animal growth promoters market.
By Source:
Bacterial Sources Drive InnovationBy source, bacteria accounted for 69.45% of the animal growth promoters market size in 2025, and yeast is advancing at a 8.62% CAGR through 2031. Bacterial derivations underpin most of today’s momentum, supplying both probiotics and a growing array of enzymes. Rapid genome mining and CRISPR editing streamline the identification of strains with specific bile-salt tolerance or protease secretion, translating to precise functional claims that sway purchasers. Commercial fermentation scales efficiently because Bacillus spores remain viable at higher temperatures, reducing downstream refrigeration demands, a factor that strengthens bacterial leadership inside the animal growth promoters market. Yeast-based solutions hold a unique foothold for immune modulation, particularly mannan-oligosaccharide fractions that bind pathogens in young animals. Their inclusion is nearly standard in starter diets across Europe, reflecting years of documented benefits.
Fungal platforms, led by Trichoderma and Aspergillus, deliver cellulases and xylanases that pull energy from high-fiber diets common in Asia-Pacific swine rations. Recent breakthroughs show that fungal fermentors can be repurposed quickly for new enzyme variants, speeding commercialization cycles. Precision fermentation now allows identical molecules to be expressed in multiple hosts, mitigating supply-chain risks. Collectively, microbial sourcing expands the active catalog available to formulators, renewing product portfolios and sustaining animal growth promoters market vibrancy.
Geography Analysis
APAC Animal Growth Promoters Market
Asia-Pacific controlled 41.25% of global revenue in 2025 and is projected to grow near 7.64% CAGR, securing its role as the epicenter of the animal growth promoters market. China’s large integrators commit to antibiotic-free pledges aligned with export ambitions, driving steep adoption of probiotics and enzymes. Beijing Scitop Bio-tech alone posted CNY 302.79 million (USD 42.13 million) in probiotic revenue during 2024, underscoring domestic capacity. India’s rising middle class promotes chicken and egg demand, while government extension programs teach farmers to curb antibiotic use, creating natural tailwinds for phytogenic and organic-acid categories. Southeast Asian aquaculture unlocks new volumes, with Thailand and Vietnam rapidly installing in-pond sensors that cue adaptive additive dosing, boosting fish survival rates and shading global seafood supplies.
North America Animal Growth Promoters Market
North America remains a technology testbed as stringent customer specifications filter through the meat value chain. AI-linked mills in the United States adjust additive regimens every shift based on incoming corn quality and broiler weight-gain forecasts. Feedlot operators in Canada adopt methane-reduction additives in anticipation of stricter carbon rules, preserving export competitiveness. Although livestock headcounts grow slowly, per-animal additive spending trends upward, reinforcing regional value growth inside the animal growth promoters market.
Europe Animal Growth Promoters Market
Europe, a mature but highly regulated arena, continues to ban antimicrobial growth promoters while incentivizing natural solutions. Germany spearheads on-farm sensor usage that links feed conversion gains directly to enzyme cocktails, providing granular proof that fuels repeat purchases. France and Spain champion organic rearing, pushing demand for standardized phytogenic oils free from chemical solvents. Eastern Europe catches up quickly, modernizing feed infrastructure and integrating EU traceability mandates, which embed additive usage as part of compliance protocols. These converging forces keep Europe a steady contributor to the overall animal growth promoters market expansion despite flat livestock numbers.

Regulatory Landscape
Regulation continues to accelerate the shift away from antibiotic growth promoters and toward formally authorized biological and functional alternatives. The European Union maintains a longstanding prohibition on antibiotics as growth promoters (in place since January 2006 under its feed additive framework), while continuing to update its positive list of permitted feed additives through implementing acts based on European Food Safety Authority (EFSA) opinions, including new authorisations and reauthorisations during January-February 2026.
Major exporting and production hubs are also tightening catalog and compliance requirements, which increases the value of dossier-ready claims, safety data, and labeling alignment across jurisdictions. China (MARA) expanded its approved feed additive catalog in December 2024 (Announcement No. 862), and Canada moved from transition to enforcement when the 12-month transition period tied to Feeds Regulations, 2024 concluded on June 17, 2025, making compliance with updated compositional and safety standards mandatory for regulated livestock feeds. In the United Kingdom, The Feed Additives (Authorisations) and Uses of Feed Intended for Particular Nutritional Purposes (Amendment of Commission Regulation (EU) 2020/354) (England) Regulations 2024 came into force on December 20, 2024, reinforcing the need for region-specific authorization and conditions-of-use management.
Competitive Landscape
The industry is moderately fragmented, the five largest companies controlling over 40% of global revenue, leaving ample headroom for specialized entrants. DSM-Firmenich, Cargill, and Kemin Industries deploy multi-species Research and Development centers and offer bundled portfolios that combine enzymes, probiotics, and digital dosing software, raising switching costs for integrators. In May 2025, Novonesis closed its acquisition of DSM-Firmenich’s animal-enzyme unit, signaling a pivot toward high-margin functional segments and igniting a fresh wave of consolidation.[2]Portal DBO, “Novonesis Acquires DSM Firmernich Animal Enzymes,” portaldb0.com
Traditional chemical firms are intensifying their biological portfolios through licensing deals with synthetic-biology startups, blurring traditional industry lines.
Emerging biotech players court niches. Startup consortia produce postbiotic metabolites that deliver consistent gut benefits without live organisms, and others engineer Bacillus strains that secrete both protease and phytase, halving inclusion rates. Regionally, Asian contenders outscale rivals on cost, exporting bulk Bacillus spores to South America and Africa. The competitive advantage thus shifts from pure manufacturing muscle toward data-rich service models, suppliers now embed on-farm sensors and analytics crews that verify ROI in real-time. As carbon reporting norms tighten, firms with verified low-emission production processes win preferred-supplier status among global meat majors, anchoring strategic differentiation in sustainability credentials.
Looking forward, white-space prospects include aquaculture-specific blends tailored to brackish environments, rumen-stable methane inhibitors, and AI-driven formulation engines that suggest additive cocktails based on raw-ingredient variability. Vendors that master these adjacencies will grab a disproportionate share of the market growth, especially as integrators consolidate and demand global supply continuity.
Animal Growth Promoters Industry Leaders
Alltech
Cargill, Inc.
Novonesis
Kemin Industries
DSM-Firmenich
- *Disclaimer: Major Players sorted in no particular order
Animal Growth Promoters Market Companies Covered in this Report
- DSM-Firmenich
- Cargill, Inc.
- Vetoquinol
- Alltech
- Kemin Industries
- Huvepharma
- Novonesis
- BASF SE
- ADM
- Evonik Industries
- Adisseo
- Phibro Animal Health
- Virbac
- Nutreco

Market Opportunities and Future Outlook
The most durable whitespace remains in non-antibiotic performance solutions that can be deployed at scale under tightening antimicrobial stewardship norms. International guidance has become more measurable: in the latest WOAH data collection, 71% of responding WOAH members reported not using antimicrobial agents for growth promotion. That data supports broader adoption of functional alternatives such as probiotics, enzymes, organic acids, synbiotics, and phytogenic blends that protect gut integrity while sustaining feed efficiency.
Regulatory throughput in the EU also creates nearer-term commercialization pathways for microbial preparations that sit within feed additive classifications, including silage additives that feed into ruminant and dairy production systems. The European Commission authorized Pediococcus pentosaceus NCIMB 12674/DSM 35357 as a technological silage additive for all animal species in May 2026 (Regulation (EU) 2026/1020), and previously authorized Bacillus subtilis DSM 33862 with Lentilactobacillus buchneri DSM 12856 in July 2025 (Regulation (EU) 2025/1468). Alongside this, the AVANT EU Innovation Action on alternatives to veterinary antimicrobials highlights an active pipeline of post-weaning pig solutions (gut microbiota modulators and immunostimulants) and the remaining regulatory classification work, which favors suppliers that can generate robust field data and navigate additive versus veterinary-medicine boundaries.
Recent Industry Developments in Animal Growth Promoters Market
- June 2026: Alltech launched Olerix, a phytogenic blend positioned for modern pork production to support gut health, feed efficiency, and growth performance. The launch expands the commercial toolkit for producers replacing antibiotic growth promoters with plant-based functional additives in swine systems.
- November 2025: Cargill completed an expansion of its micronutrition facility in Engerwitzdorf, Austria, increasing production capacity by 50%. The added output supports higher-throughput production of science-based micronutrition solutions, reinforcing scale advantages in performance additives and premix-style delivery.
- December 2024: The UK Food Standards Agency authorized Bovaer, a methane-reducing feed additive, for commercial livestock diets. The decision strengthened the role of performance additives that also address sustainability metrics, widening use cases beyond traditional growth and feed conversion objectives.


Animal Growth Promoters Market Report Scope and Research Methodology
Market Definition and Coverage
For this study, the market covers animal growth promoters sold for use in commercial livestock and aquaculture rations to improve growth rate, feed conversion, and overall production efficiency.
Scope exclusions: Items prepared only as disease-treatment medicated premixes and not intended for growth or performance improvement are excluded.
Segments Covered in This Report
- By Type (Value)
- Probiotics
- Prebiotics
- Phytogenics
- Acidifiers
- Enzymes
- Antibiotics
- Other Types (Ionophores, Hormones)
- By Animal Type (Value)
- Poultry
- Swine
- Ruminants
- Aquaculture
- Other Animals (Equine, Pets)
- By Form (Value)
- Dry
- Liquid
- By Source (Value)
- Bacterial
- Yeast
- Fungal
- By Geography (Value)
- North America
- United States
- Canada
- Mexico
- Rest of North America
- South America
- Brazil
- Argentina
- Rest of South America
- Europe
- Germany
- United Kingdom
- France
- Spain
- Russia
- Rest of Europe
- Asia-Pacific
- China
- Japan
- India
- Australia
- Rest of Asia-Pacific
- Middle East
- Turkey
- Saudi Arabia
- United Arab Emirates
- Rest of Middle East
- Africa
- South Africa
- Egypt
- Rest of Africa
- North America
Data Sources, Market Sizing, and Validation
Desk Research
Desk research was used to build the first structure of the model and to keep assumptions realistic by region and species. We reviewed public sources such as FAOSTAT livestock production series, USDA livestock and feed outlooks, the European Commission and EFSA publications on feed additives, and Codex Alimentarius guidance where it helps clarify feed additive categories. When trade flows were needed to sanity check supply availability, we also referred to UN Comtrade summaries and similar customs-linked statistics.
Beyond these, we used company annual reports, investor presentations, and press releases to understand product mix shifts and pricing direction, which is then translated into market-level inputs. Select paid subscriptions were used only for company financials, patent activity signals, and shipment level import-export checks where available. The desk sources listed here are not exhaustive, and many other public documents were also used to collect data, validate it, and clarify open questions.
Primary Interviews and Surveys
Primary work focused on interviews and structured surveys with feed additive suppliers, premix players, animal nutritionists, large integrators, and distributors across major consuming regions. Inputs were used to confirm inclusion rules, typical dosage and adoption patterns by species, and practical price movement expectations, and then the desk assumptions were adjusted where gaps showed up.
Distribution of primary research fieldwork respondents
| Company type | Respondent position | Region |
|---|---|---|
| Top tier: 30% | CXOs: 13% | APAC: 38% |
| Mid tier: 55% | Functional/Unit leaders: 27% | EMEA: 36% |
| Smaller Players: 15% | Managers: 60% | Americas: 26% |
Market-Sizing & Forecasting
Sizing starts with a top-down build where livestock output and feed demand signals are translated into an addressable feed additive demand pool, and then split into growth promoter usage based on observed adoption patterns. Once the demand pool is formed, species mix and regional feeding systems are applied so the model reflects differences between poultry, swine, ruminants, and aquaculture.
To keep the totals realistic, results are corroborated with selective bottom-up approximations, like sampled supplier revenue splits, distributor channel checks, and ASP multiplied by estimated volumes for key additive groups where interviews confirmed the ranges. A few inputs that meaningfully move the market number include compound feed production trends, growth promoter penetration by species, inclusion rates (dosage ranges), shifts toward non-antibiotic solutions, and regional price progression linked to raw material costs and formulation changes. When bottom-up views were incomplete for smaller markets, the gap was handled by using peer-region ratios and then rechecked with local expert feedback.
For forecasting, scenario analysis was used because regulation changes and substitution between additive types can swing growth. Base, conservative, and faster-adoption cases were set around expected policy direction, productivity pressure in protein supply chains, and the pace of movement from antibiotic to non-antibiotic programs, and then the final forecast path was chosen after expert consistency checks.
Data Validation & Update Cycle
Validation is done in layers so that one single assumption does not decide the full market value. We compare outputs against independent signals such as regional animal production trends, feed production direction, and import-export movements for key additive ingredients, and then investigate any outliers before final sign-off.
Where variance is large by region or by species, follow-up calls are triggered to recheck adoption rates, dosage assumptions, and the pricing logic used in that part of the model. Each report is refreshed annually, and interim updates are made when material events occur, such as major regulatory actions or step changes in livestock economics. Before delivery, a final review pass is completed so clients receive the latest updated view tied to the same repeatable steps.
Mordor Intelligence's Global Animal Growth Promoters Market Market Size Measured Against Other Published Estimates
Published numbers for animal growth promoters can look far apart because the category gets defined differently across sources, and the split between growth and treatment use is not always handled the same way. Differences also come from the year chosen for the current estimate, the currency conversion timing, and whether the model follows real livestock and feed indicators or uses smoother trend lines.
The main gap comes from whether treatment-only medicated premixes and broader performance enhancer items are counted inside the total, where Mordor Intelligence includes only products used in commercial rations for growth and efficiency improvement and leaves out premixes intended solely for disease treatment.
Benchmark comparison
| Source | Market Size | Gaps in Research Methodology |
|---|---|---|
| Mordor Intelligence | USD 20.58 B (2026) | |
| Global Consultancy A | USD 16.30 B (2024) | Uses an earlier base year and a broader performance enhancer framing, and it can also undercount value when regulation-led shifts move demand into non-antibiotic additives faster than the assumed trend. |
| Industry Publisher B | USD 17.07 B (2025) | Focuses on a different base year and may apply averaged pricing and adoption assumptions across species, which can miss higher inclusion intensity in poultry and aquaculture feed programs in high-growth regions. |
The comparison shows that most of the spread is explained by scope choices, base year selection, and how pricing and adoption are carried forward by species and region. By tying the model to observable livestock and feed indicators and then checking assumptions through interviews, the final number stays traceable and repeatable even when the mix between additive types is changing.


Key Questions Answered in the Report
What is the current value of the animal growth promoters market?
The market is worth USD 20.58 billion in 2026 and is forecast to reach USD 27.63 billion by 2031.
Which product segment holds the largest share?
Probiotics lead with 34.12% of global revenue in 2025, reflecting their broad acceptance as antibiotic alternatives.
How fast is the aquaculture segment growing?
Aquaculture growth promoter demand is advancing at an 8.22% CAGR through 2031, driven by rising fishmeal costs and sustainability mandates.
What regulatory trends most affect future animal growth promoters demand?
Expanding bans on antibiotic growth promoters and new methane-reduction targets are steering producers toward functional biological ingredients and low-emission solutions.
Page last updated on:


 Your data is secure and never sold or shared.


