3D Printing Construction Market Size and Share
Market Overview
| Study Period | 2020 - 2031 |
|---|---|
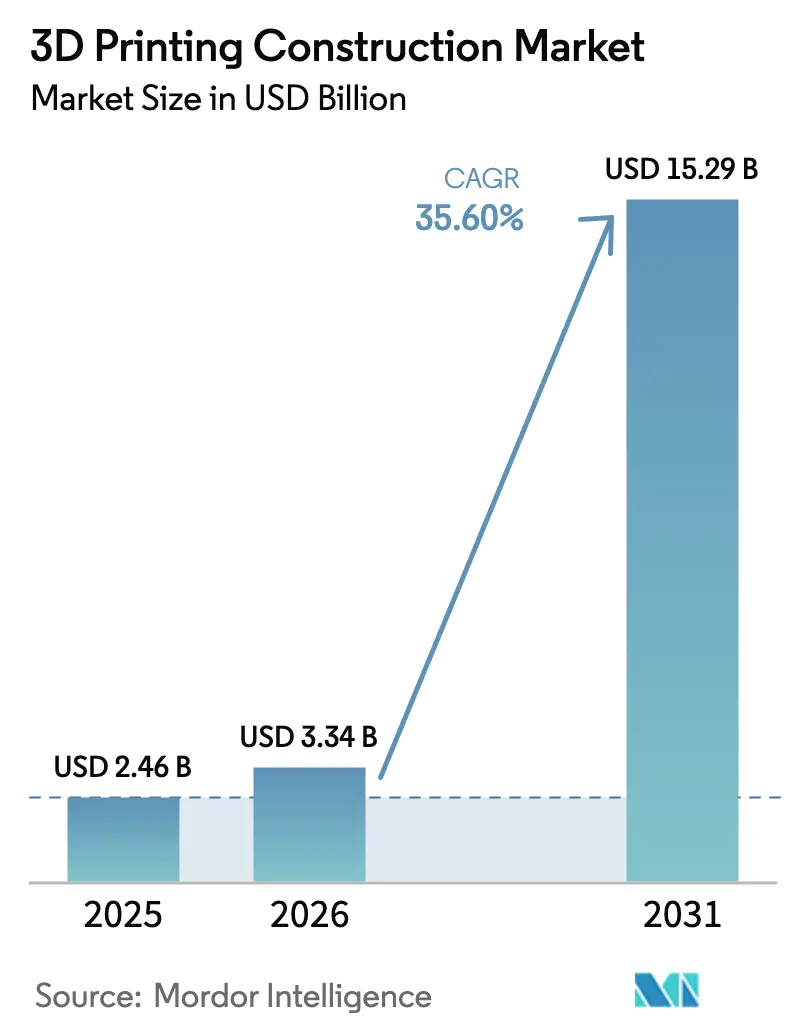
| Market Size (2026) | USD 3.34 Billion |
| Market Size (2031) | USD 15.29 Billion |
| Growth Rate (2026 - 2031) | 35.60% CAGR |
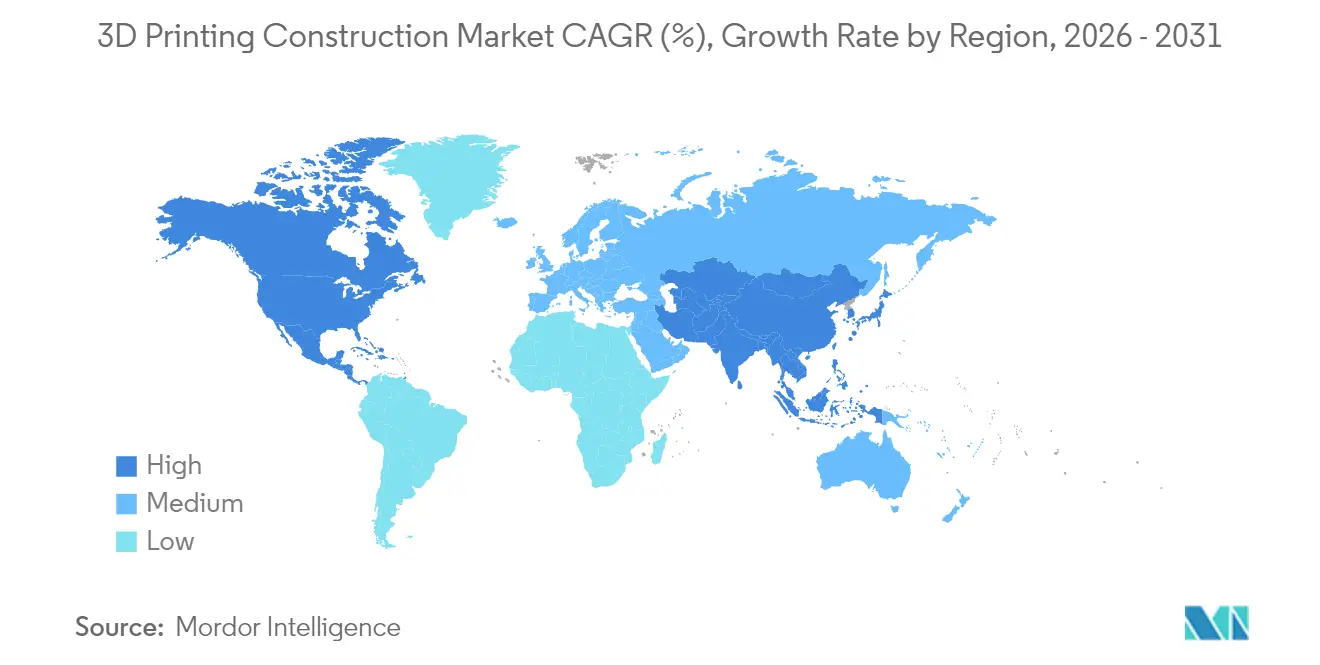
| Fastest Growing Market | Asia Pacific |
| Largest Market | North America |
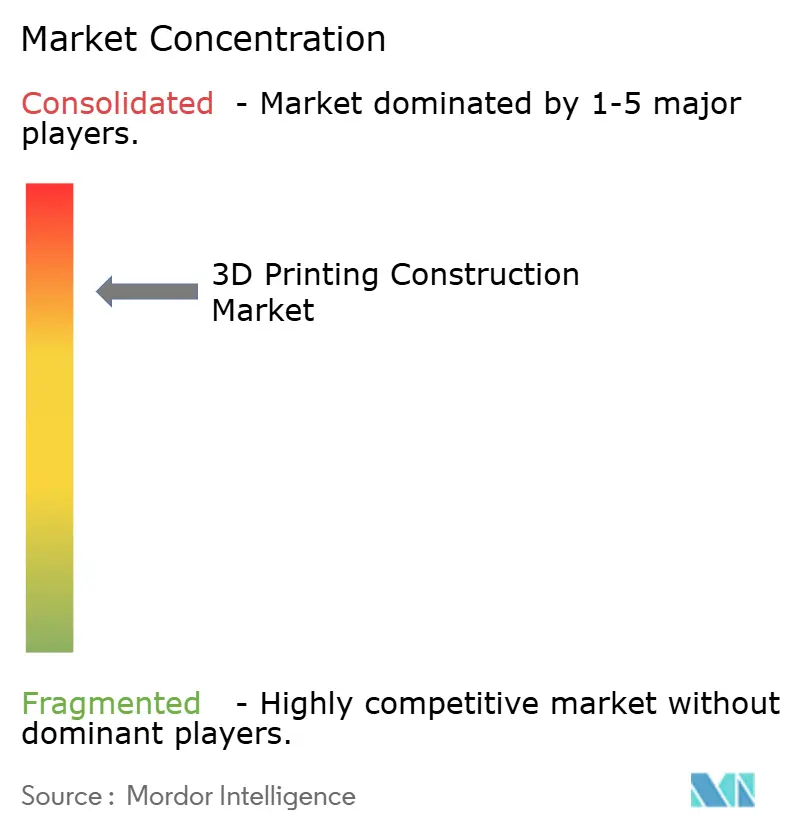
| Market Concentration | High |
Major Players
*Disclaimer: Major Players sorted in no particular order Image © Mordor Intelligence. Reuse requires attribution under CC BY 4.0. |
|
3D Printing Construction Market Analysis by Mordor Intelligence
The 3D printing construction market size was valued at USD 2.46 billion in 2025 and estimated to grow from USD 3.34 billion in 2026 to reach USD 15.29 billion by 2031, at a CAGR of 35.60% during the forecast period (2026-2031). Rapid automation is narrowing skilled-labor gaps, lowering residential build costs by up to 45% and trimming commercial structural outlays by as much as 80%. Military pilot projects, notably the U.S. Army’s 3D-printed barracks at Fort Bliss, have proven full-scale viability while meeting updated Unified Facilities Criteria, signaling a broad transition from prototyping to routine delivery. Government funding across the United States, Canada and the European Union is de-risking private investment, and harmonized codes from bodies such as NFPA and ASTM are standardizing compliance pathways. Technology advances now emphasize print-head speed, closed-loop quality assurance and low-carbon binders, creating opportunities for integrated digital-twin workflows and geopolymer materials that reduce embedded CO₂ by more than 70%. Concurrently, supply-chain volatility, including 25% cement tariffs on Canadian and Mexican imports, poses cost headwinds that innovators are countering through material-light designs and local binder sourcing.[1]Sysdyne Technologies. "2025 Concrete Tariffs.
Key Report Takeaways
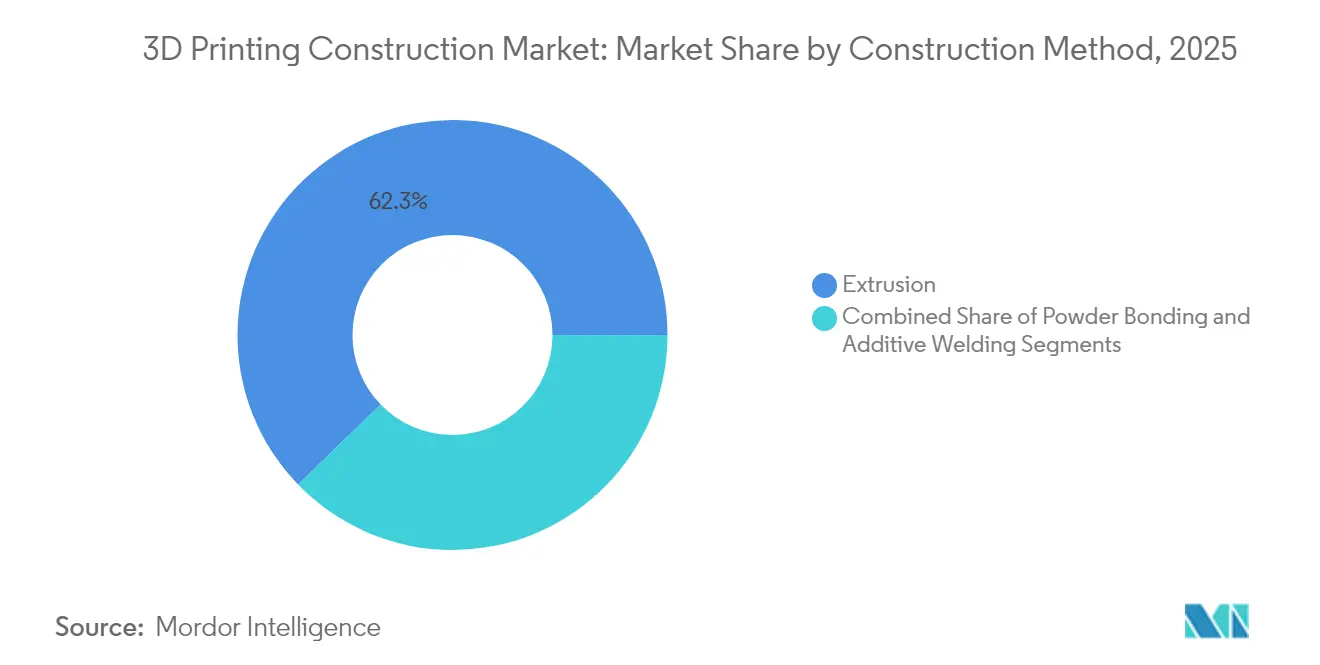
- By construction method, extrusion led with 62.25% revenue share in 2025, while powder bonding is projected to surge at a 46.20% CAGR through 2031.
- By material type, concrete accounted for 54.80% of the 3D printing construction market share in 2025; metal printing is expected to grow at a 55.10% CAGR to 2031.
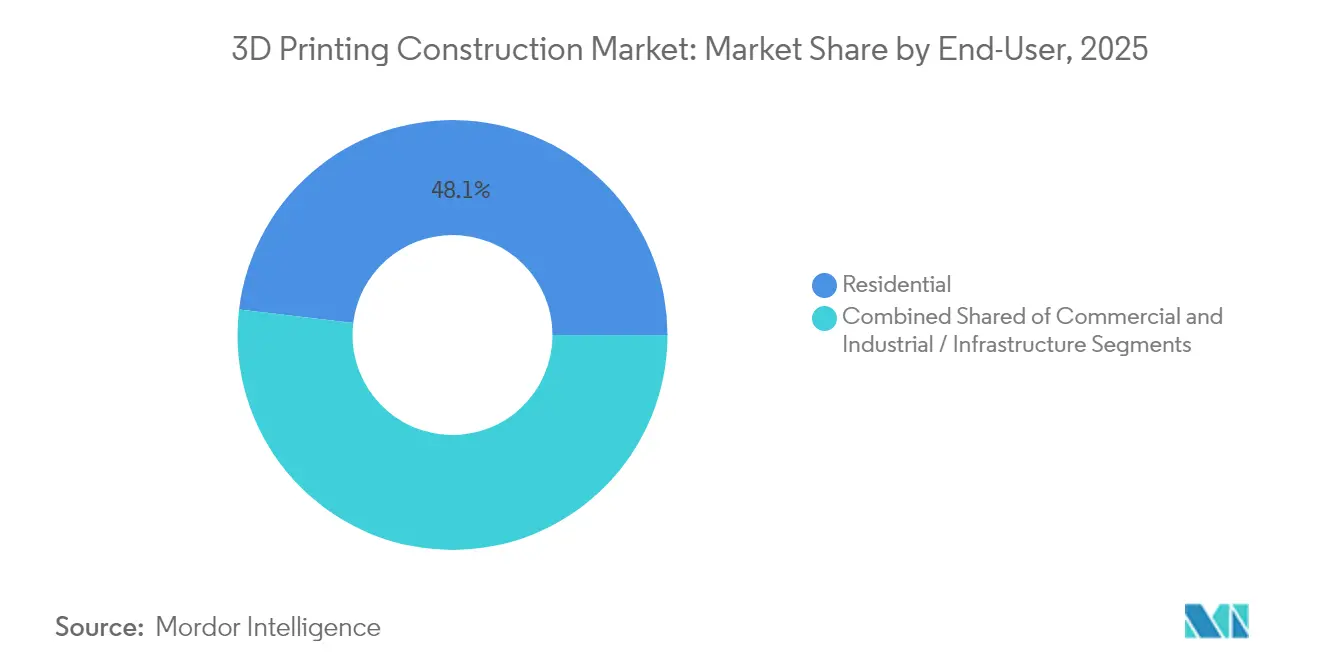
- By end-user, the residential segment held 48.10% of the 3D printing construction market size in 2025, whereas industrial and infrastructure applications post the fastest expansion at 42.70% CAGR.
- By construction setting, on-site printing commanded 67.10% share in 2025; off-site prefabrication is forecast to rise at a 40.90% CAGR through 2031.
- By geography, North America captured 32.40% revenue share in 2025, while Asia-Pacific is anticipated to achieve the highest regional CAGR of 37.60% through 2031.
Note: Market size and forecast figures in this report are generated using Mordor Intelligence’s proprietary estimation framework, updated with the latest available data and insights as of 2026.
Global 3D Printing Construction Market Trends and Insights
Drivers Impact Analysis*
| Driver | (~) % Impact on CAGR Forecast | Geographic Relevance | Impact Timeline |
|---|---|---|---|
| Government funding programs for printed affordable housing | +8.5% | North America, EU, selective Asia-Pacific pilots | Medium term (2-4 years) |
| Rapid on-site build time reducing labor costs | +12.2% | Global | Short term (≤ 2 years) |
| Concrete mix innovations improving structural integrity | +6.8% | Global | Medium term (2-4 years) |
| Military adoption for forward-deployed structures | +4.3% | North America, EU, Asia-Pacific | Long term (≥ 4 years) |
| Carbon-negative geo-polymer binders at scale | +7.1% | EU, North America expanding to Asia-Pacific | Long term (≥ 4 years) |
| Digital-twin QA platforms lowering re-work rates | +5.4% | Developed markets worldwide | Medium term (2-4 years) |
| Source: Mordor Intelligence | |||
Government Funding Programs for Printed Affordable Housing
Public agencies are channeling sizable grants into additive housing to tackle affordability gaps. HUD’s Innovative Housing Showcase highlighted full-scale printed homes and released USD 600,000 for cold-region prototypes in Alaska. Canada earmarked USD 50 million through its Regional Homebuilding Innovation Initiative to bring unit costs down by over half and boost labour productivity by 60%.[2]Government of Canada, “Regional Homebuilding Innovation Initiative (RHII),” cannor.gc.ca Similar co-investment mechanisms from NGen and state housing corporations provide credible demand pipelines, allowing contractors to scale printer fleets with lower finance risk. Demonstration builds funded by Virginia Housing and the California Energy Commission offer regulators empirical data, accelerating permitting cycles. As capital commitments widen, printed-home benchmarks established in 2024–2025 will serve as reference pricing for mainstream developers.
Rapid On-Site Build Time Reducing Labor Costs
Printer gantries complete walls six to ten times faster than form-and-pour crews, compressing project cycles and directly offsetting skilled-labor shortages. ICON’s Wolf Ranch subdivision in Texas is nearing completion of 95 printed houses, with starting prices positioned competitively at USD 430,000 and cycle times markedly shorter than masonry equivalents. The U.S. Army’s 5,700-square-foot barracks confirm similar time savings on institutional projects.[3]U.S. Army. "Additive manufacturing advances support Army ground vehicle readiness, extend fight. Portugal’s first printed dwelling, built with COBOD hardware, illustrates European cost-time parity achievements. Japan’s seven-day replacement of a train station further validates throughput gains for infrastructure builds. Combined labour savings approaching 80% are now integral to contractor bids, reinforcing the 3D printing construction market’s cost leadership narrative.
Concrete Mix Innovations Improving Structural Integrity
Material scientists have tailored rheology and fiber content to meet strength codes without sacrificing print flow. Bendable concrete from University of New Mexico embeds polymer fibers to raise tensile capacity while limiting crack propagation, enhancing resilience in seismic zones. Hybrid mixes that blend steel fibers with carbon nanotubes increase compressive and flexural performance, with MDPI studies documenting optimal synergy effects. Lightweight foamed concretes achieve strength bonuses through coal-slag additives while maintaining a printable viscosity window. Topology-optimized geometries then reduce material use by up to 70% without compromising load paths. These advances collectively lift market confidence in long-term durability, a prerequisite for insurer acceptance.
Military Adoption for Forward-Deployed Structures
Defense buyers validate ruggedness under extreme conditions. Additive repair cells now fabricate over 600 vehicle parts for U.S. land forces, cutting lead-times and depot backlog. The USD 4.5 billion modernization push that delivered Fort Bliss barracks sets a baseline for rapid, code-compliant troop housing. European forces are piloting mobile micro-factories to print FPV drones, demonstrating additive’s versatile expeditionary footprint.[4]Army Recognition. "French Army Boosts Tactical Autonomy with Mobile Micro Factory Producing FPV Drones on Front Line." FLEETWERX initiatives couple stainless-steel deposition with autonomous logistics, underscoring the strategic value of localized production. Military endorsement shortens civilian adoption curves by proving reliability in harsh terrains.
Restraints Impact Analysis*
| Restraint | (~) % Impact on CAGR Forecast | Geographic Relevance | Impact Timeline |
|---|---|---|---|
| High capex of large-format printers | -6.8% | Global, small- and mid-size contractors | Short term (≤ 2 years) |
| Lack of harmonised building codes & standards | -4.2% | Global | Medium term (2-4 years) |
| Insurance underwriters’ reluctance to cover assets | -3.1% | Developed markets | Medium term (2-4 years) |
| Scarcity of high-purity cementitious additives | -2.9% | Global | Short term (≤ 2 years) |
| Source: Mordor Intelligence | |||
High Capex of Large-Format Printers
Ticket prices for gantry systems such as COBOD’s BOD2 stretch budgets beyond many regional contractors. Even with modular add-ons and two-day setup efficiencies, purchase outlays remain formidable. Rental pools and lease-to-own packages now emerging through PERI and other OEMs lower financial thresholds, but balance-sheet constraints still temper diffusion among small and mid-size enterprises. Incremental design improvements that raise print-speed per dollar are essential to counteract this restraint.
Lack of Harmonised Building Codes & Standards
Fragmented rules slow approval cycles and add engineering overheads. The International Code Council will only release unified additive-construction provisions in its 2027 edition, leaving interim projects to navigate bespoke waivers. ASTM’s guidance on cement qualification and strength validation is a step toward global alignment ASTM, yet national fire codes and seismic prescriptions still diverge. Collaborative work between Apis Cor and Thornton Tomasetti on wall standards shows industry commitment, but regulatory convergence remains a medium-term hurdle.
*Our forecasts treat driver/restraint impacts as directional, not additive. The impact forecasts reflect baseline growth, mix effects, and variable interactions.
Segment Analysis
By Construction Method: Diversifying Beyond Extrusion
Extrusion accounted for 62.25% of the 3D printing construction market in 2025, benefitting from proven concrete deposition, high-viscosity tolerance and minimal support needs. Early deployments such as ICON’s 100-unit subdivision in Texas show scalable field performance. Powder bonding is advancing at a 46.20% CAGR, leveraging binder-jetting heads that print at room temperature while recycling unused feedstock for near-net-shape parts. Additive welding remains niche yet pivotal for metal superstructures; Arup’s wire-and-arc prototypes point to bridges and complex nodes printed directly onto steel girders.
The competitiveness of extrusion hinges on continuous nozzle throughput improvements, while powder bonding is exploiting its ability to handle metals, ceramics and recycled aggregates with 1,200 dpi resolution. Hybrid machines capable of switching between deposition modes underpin the next innovation wave, aligning material choice with load cases and environmental stresses. These dynamics expand addressable applications and enlarge the 3D printing construction market size at the method level.


By Material Type: Metals Accelerate While Concrete Consolidates
Concrete retained 54.80% of 3D printing construction market share in 2025, propped by widespread supply chains and maturing geopolymer mixes. Mechanical enhancements such as steel-fiber reinforcement or carbon-nanotube dispersion lift flexural strength without compromising print flow. Metal printing’s 55.10% forecast CAGR is catalyzed by projects like MX3D’s Amsterdam bridge that eliminate formwork and welding passes. Programmes such as the U.S. Army’s Jointless Hull machine, the largest metal‐additive cell worldwide, demonstrate oversized component feasibility.
Composite avenues include lightweight foamed concretes and plant-based biocomposites with thermal gains up to 60%. As metal powders diversify to duplex steels and corrosion-resistant alloys, structural engineers are pairing topology-optimized skeletons with concrete infills, widening the functional palette.
By End-User: Infrastructure Momentum Outpaces Housing
Residential projects still comprise 48.10% of 2025 revenue, driven by repeatable designs and developer partnerships with printer OEMs. Lennar’s and ICON’s Georgetown community pre-sold three-quarters of its inventory, validating buyer acceptance. Yet industrial and public-works schemes are gaining velocity at a 42.70% CAGR, evidenced by the U.S. Army Corps of Engineers printing the largest civil-works component on record. Data centers such as Heidelberg’s Wave House harness off-site printing to finish envelopes within 140 hours, offering facility operators rapid asset monetization.
Commercial footprints are following suit, highlighted by Starbucks’ printed drive-thru that meets branding specifications while slashing construction days. Infrastructure growth signals that project complexity is no longer a barrier as material portfolios broaden and multi-material printers become field-ready.
By Construction Setting: Prefabrication Gains Credibility
On-site systems delivered 67.10% of 2025 output by eliminating transport of oversized elements and enabling in-situ adjustments. Outdoor projects such as the MX3D bridge managed micro-climate variability through adaptive slicing paths. Waste reductions between 30% and 60% further reinforce on-site economics. Off-site prefabrication, expanding at 40.90% CAGR, leverages controlled environments for tighter tolerances and multi-story ambition. DAUB’s block-assembly method allows printers to exceed current three-story on-site limits, targeting mid-rise residential needs.
Hybrid models such as Switzerland’s 98-foot Tor Alva tower print components off-site before crane assembly, combining factory-grade quality with reduced site disruption. The gradual shift toward parallel off-site and on-site workflows raises throughput and underpins broader ecosystem participation.
Geography Analysis
North America represented 32.40% of global revenue in 2025, anchored by consistent Department of Defense funding, HUD research grants and Canada’s CAD 50 million initiative to scale additive housing. Federal stimulus budgets covering resilient infrastructure have translated into printer procurement pipelines across municipal projects. However, cement import tariffs lifting average concrete costs from USD 130 to USD 162 per ton risk margin compression for price-sensitive segments. Lenders now scrutinize supply-chain hedges when underwriting printed developments, nudging contractors toward local geopolymer and waste-steel mixes that sidestep tariff exposure.
Asia-Pacific is poised to deliver the strongest CAGR at 37.60% through 2031 as policy makers tie low-carbon targets to additive uptake. Japan’s week-long replacement of a regional rail station proved that printed infrastructure can meet tight outage windows. Chinese provincial authorities have issued guidance on life-cycle carbon budgeting that implicitly favors material-light printing solutions. Coupled with rapid urban renewal, this policy mix accelerates public-sector procurement of modular printed segments for viaducts, public housing and flood defenses.
Europe maintains a robust innovation profile, balancing climate regulation and historic-fabric preservation. Germany’s Heidelberg data-center shell and Denmark’s multi-story experiments demonstrate regional appetite for scale and vertical complexity. EU Emissions Trading System updates that expand embodied-carbon accounting are likely to push adoption further, particularly of geopolymer binders sourced from local slag streams. Eastern European markets, faced with rebuilding needs and labour migration, are exploring lower-cost printer rentals to bridge workforce shortages.
Latin America and the Middle East remain smaller in value but exhibit niche growth pockets. Mexico’s Yucatán projects leverage limestone geopolymers to craft hurricane-resilient shells, while Gulf petromonarchies deploy printers for exhibition pavilions that double as low-carbon showcases. Collectively, these developments portend a gradual narrowing of regional adoption gaps, reinforcing the global breadth of the 3D printing construction market.

Competitive Landscape
The 3D printing construction market is moderately fragmented. First-movers such as COBOD continue to extend engineering lead times with iterative releases like the 2024 advanced BOD2 platform that integrates auto-calibration and higher layer heights. ICON’s USD 207 million capital raise funds multi-story Phoenix printer R&D and the CODEX digital-catalog ecosystem, positioning the firm for vertically integrated delivery at tract-housing scale. PERI’s joint ventures combine printer sales with construction services, enabling it to capture end-to-end margins on Houston’s 30,000-square-foot multi-story demonstration.
Strategic alliances shape differentiation. D.R. Horton’s equity stake in Apis Cor embeds printer technology into the supply chain of America’s largest homebuilder, foreshadowing main-stream builder adoption. Arup collaborates with MX3D on wire-arc steel nodes, linking structural engineering expertise with robotic fabrication. Robotics majors including ABB supply motion control systems, broadening ecosystem participation while raising entry barriers for stand-alone start-ups.
Regulatory frameworks are becoming a competitive filter. Firms active in ASTM working groups secure early visibility into compliance requirements, allowing pre-emptive material and process validation. Insurance acceptance further differentiates players that can document sensor-based performance over time. As volumes scale, OEM consolidation is probable, yet service bureaus and regional printer operators will continue to thrive by offering application-specific expertise and fleet flexibility.
3D Printing Construction Industry Leaders
-
COBOD International A/S
-
Yingchuang Building Technique
-
XtreeE
-
Apis Cor
-
VoxelMatters
- *Disclaimer: Major Players sorted in no particular order

Recent Industry Developments
- June 2025: Switzerland opened the 98-foot Tor Alva tower, the world’s tallest printed structure, highlighting multi-story concrete aesthetic possibilities
- May 2025: Starbucks debuted its first U.S. printed store in Brownsville, Texas, using robotic arms to fabricate wall modules
- April 2025: Japan finished a 3D-printed train station in seven days through a West Japan Railway–Serendix partnership
- February 2025: The U.S. Army inaugurated three printed barracks at Fort Bliss, each housing up to 56 soldiers


Research Methodology Framework and Report Scope
Market Definitions and Key Coverage
Our analysis defines the 3D printing construction market as all revenue earned from dedicated, large-format additive systems, the feedstock they consume, and the on-site or off-site printing services that fabricate load-bearing structural elements or complete shells for buildings and civil works.
Scope exclusion: The study does not track desktop printers, architectural scale models, or ancillary design software sold outside printing contracts.
Segmentation Overview
-
By Construction Method
- Extrusion
- Powder Bonding
- Additive Welding
-
By Material Type
- Concrete
- Metal
- Composite and Others
-
By End-User
- Residential
- Commercial
- Industrial / Infrastructure
-
By Construction Setting
- On-Site Printing
- Off-Site / Prefabrication
- Hybrid
-
By Geography
-
North America
- United States
- Canada
- Mexico
-
South America
- Brazil
- Argentina
- Rest of South America
-
Europe
- Germany
- France
- United Kingdom
- Spain
- Italy
- Russia
- Rest of Europe
-
Asia-Pacific
- China
- Japan
- India
- South Korea
- Australia and New Zealand
- Rest of Asia-Pacific
-
Middle East
- Israel
- Saudi Arabia
- United Arab Emirates
- Turkey
- Rest of Middle East
-
Africa
- South Africa
- Egypt
- Rest of Africa
-
North America
Detailed Research Methodology and Data Validation
Primary Research
Mordor analysts interviewed printer makers, tier-one contractors, building code officials, and university labs across North America, Europe, the Gulf, and East Asia. Conversations tested duty-cycle assumptions, concrete mix costs, and code-approval timelines, while an online survey of architects quantified average printed wall area per project. These insights closed gaps and aligned scenario bounds.
Desk Research
We gathered baseline indicators from open databases issued by bodies such as the US Census Bureau (new housing starts), Eurostat (construction output by material), UN-Habitat (urban population growth), and the International Energy Agency (cement intensity trends). Trade associations, for example, the American Concrete Institute and Germany's VDMA Additive Manufacturing working group, provided material mix ratios and machine shipment anecdotes. Company 10-Ks and investor decks helped us check typical printer prices and service margins. Where needed, we leaned on D&B Hoovers for private player revenue splits and Dow Jones Factiva to flag project announcements. The sources listed illustrate the range; many additional references fed the desk stage.
Market-Sizing & Forecasting
We began with a top-down construct that rebuilds annual spend from printed floor-space forecasts, regional concrete unit costs, and penetration rates into new residential, commercial, and public works pipelines. Supplier roll-ups of installed printers and average selling prices offered a bottom-up sense check before final calibration. Key drivers modeled include urban housing deficits, regulatory adoption milestones, printed-wall productivity (m² per hour), concrete price inflation, and capital subsidy programs. A multivariate regression mixed with scenario analysis projects demand through 2030. Missing node values, for example, printer utilization in emerging markets, were inferred from adjacent equipment datasets and validated with experts.
Data Validation & Update Cycle
Outputs pass two analyst reviews, variance testing against external signals, and peer sign-off. Models refresh each year, with interim tweaks when material code changes or billion-dollar projects reach financial close. Clients therefore receive the newest vetted baseline every release.
Why Mordor's 3D Printing Construction Baseline Stays Dependable
Published estimates often diverge because firms follow different scopes, price stacks, and refresh speeds.
Key gap drivers include whether revenues from one-off pilot homes are scaled up without cross-checking printer shipments, or whether peripheral services and R&D grants are rolled into market value. Our work fixes scope at monetized structural printing activity, applies region-specific concrete cost curves, and refreshes annually, giving decision-makers a balanced midpoint.
Benchmark comparison
| Market Size | Anonymized source | Primary gap driver |
|---|---|---|
| USD 2.46 B (2025) | Mordor Intelligence | - |
| USD 0.10 B (2025) | Global Consultancy A | Tracks only on-site concrete pilots and excludes printer and material sales |
| USD 15.43 B (2025) | Industry Association B | Aggregates broader 3D printing value chain and includes government R&D outlays |
Taken together, the comparison shows that Mordor's disciplined variable selection and yearly audit yield a practical, transparent baseline that sits between aggressive and conservative extremes while staying fully traceable for clients.


Key Questions Answered in the Report
What is the current value of the 3D printing construction market?
The market stood at USD 3.34 billion in 2026 and is projected to rise to USD 15.29 billion by 2031 at a 35.60% CAGR.
Which construction method dominates the 3D printing construction market?
Extrusion leads with 62.25% revenue share as of 2025, though powder bonding is growing fastest at a 46.20% CAGR to 2031.
How are governments supporting 3D-printed housing?
Programs such as HUD grants in the United States and Canada’s RHII allocate multimillion-dollar funds to pilot affordable printed homes, reducing private-sector risk.
What materials are gaining traction beyond concrete?
Metal printing is accelerating at a 55.10% CAGR, driven by projects like steel bridges and military hull components that need high strength and complex geometries.
Why are insurers cautious about 3D-printed buildings?
Limited field data on long-term performance keeps actuarial models immature, so underwriters price higher premiums until digital-twin monitoring proves durability.
Which region is expected to grow fastest through 2031?
Asia-Pacific shows the highest projected CAGR of 37.60%, propelled by rapid infrastructure needs and low-carbon mandates in China and Japan.
Page last updated on:


