
Market Overview
| Study Period | 2020 - 2031 |
|---|---|
| Market Size (2026) | USD 14.15 Billion |
| Market Size (2031) | USD 32.97 Billion |
| Growth Rate (2026 - 2031) | 18.43 % |
| Fastest Growing Market | Asia Pacific |
| Largest Market | North America |
| Market Concentration | Medium |
Major Players *Disclaimer: Major Players sorted in no particular order Image © Mordor Intelligence. Reuse requires attribution under CC BY 4.0. | |
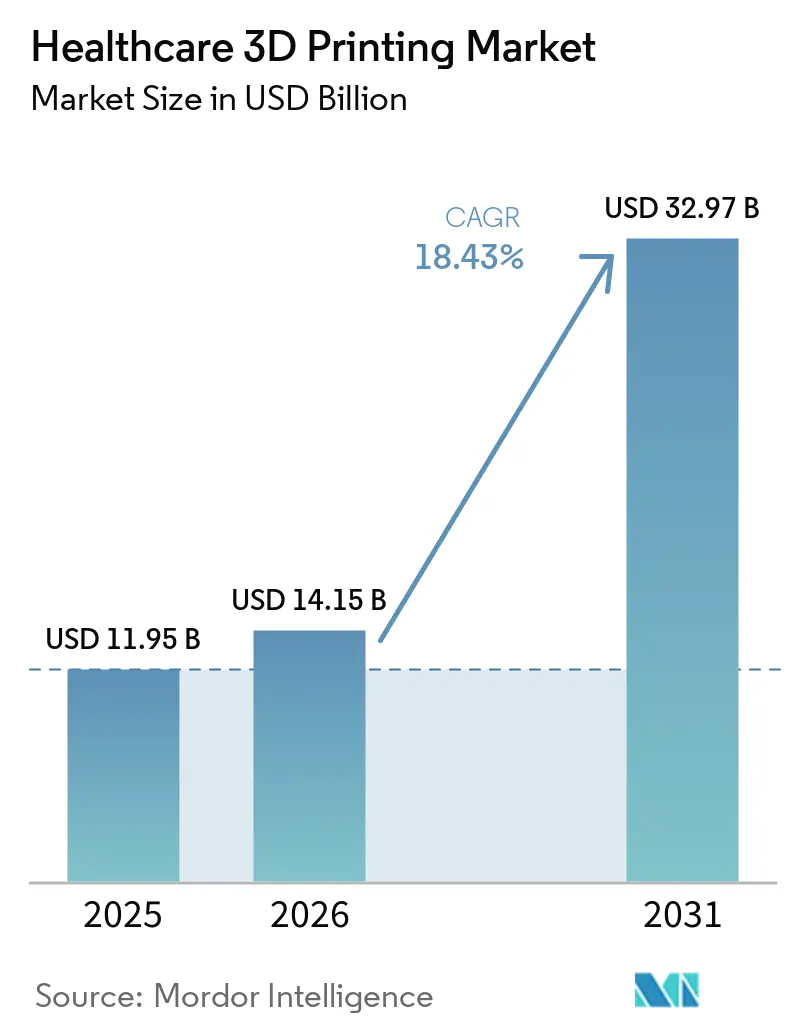
Healthcare 3D Printing Market Analysis by Mordor Intelligence
The healthcare 3D printing market size is projected to expand from USD 11.95 billion in 2025 and USD 14.15 billion in 2026 to USD 32.97 billion by 2031, registering a CAGR of 18.43% between 2026 to 2031. Hospitals are shifting from outsourced prototyping to in-house fabrication of patient-specific guides and anatomical models, compressing pre-operative planning cycles from weeks to days. Regulatory clarity, particularly the U.S. Food and Drug Administration’s additive manufacturing guidance, reduces approval risk, which in turn encourages capital investment. Stereo lithography leads adoption because its sub-50-micron resolution supports dental and craniofacial work, while electron-beam melting (EBM) grows fastest as orthopedic suppliers scale titanium-alloy implant production. Material innovation, particularly cell-laden hydrogels, propels bioprinting beyond proof-of-concept and into drug-screening workflows. Consolidation favors vertically integrated players that own powder supply chains and design-automation software, strengthening competitive moats and insulating margins against commodity volatility.
Key Report Takeaways
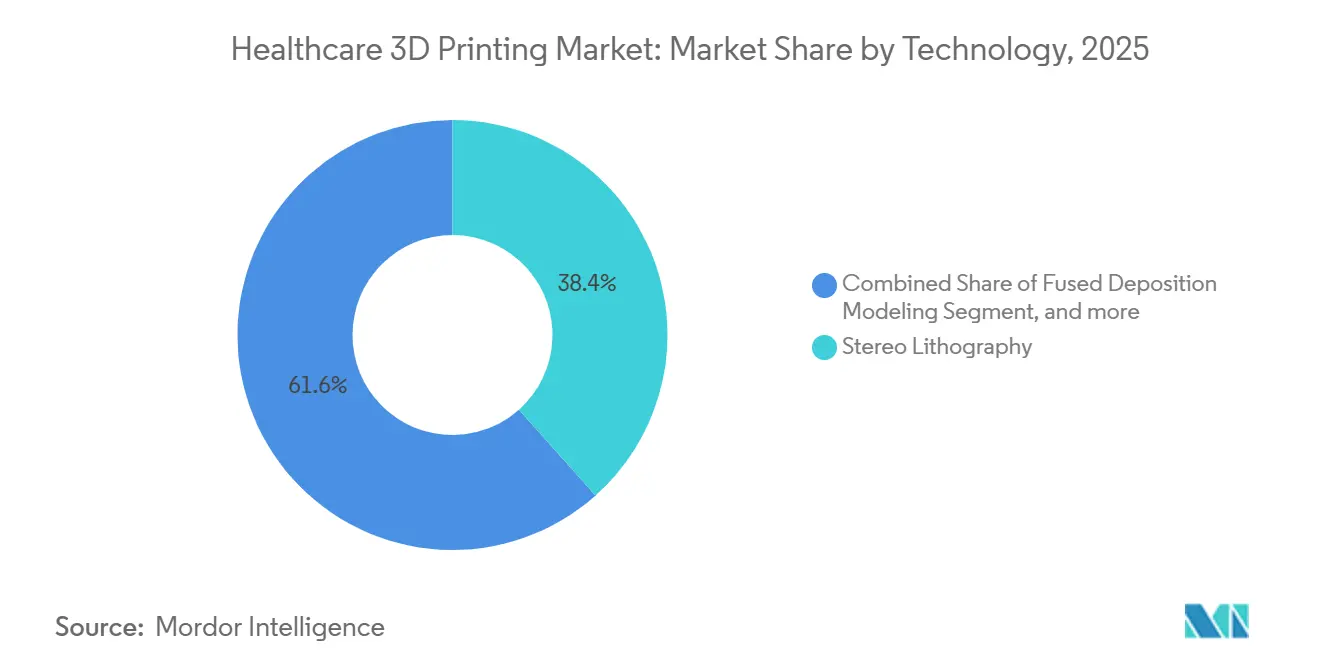
- By technology, stereo lithography led the healthcare 3D printing market with 38.42% of the market share in 2025; electron-beam melting is projected to expand at a 20.43% CAGR through 2031.
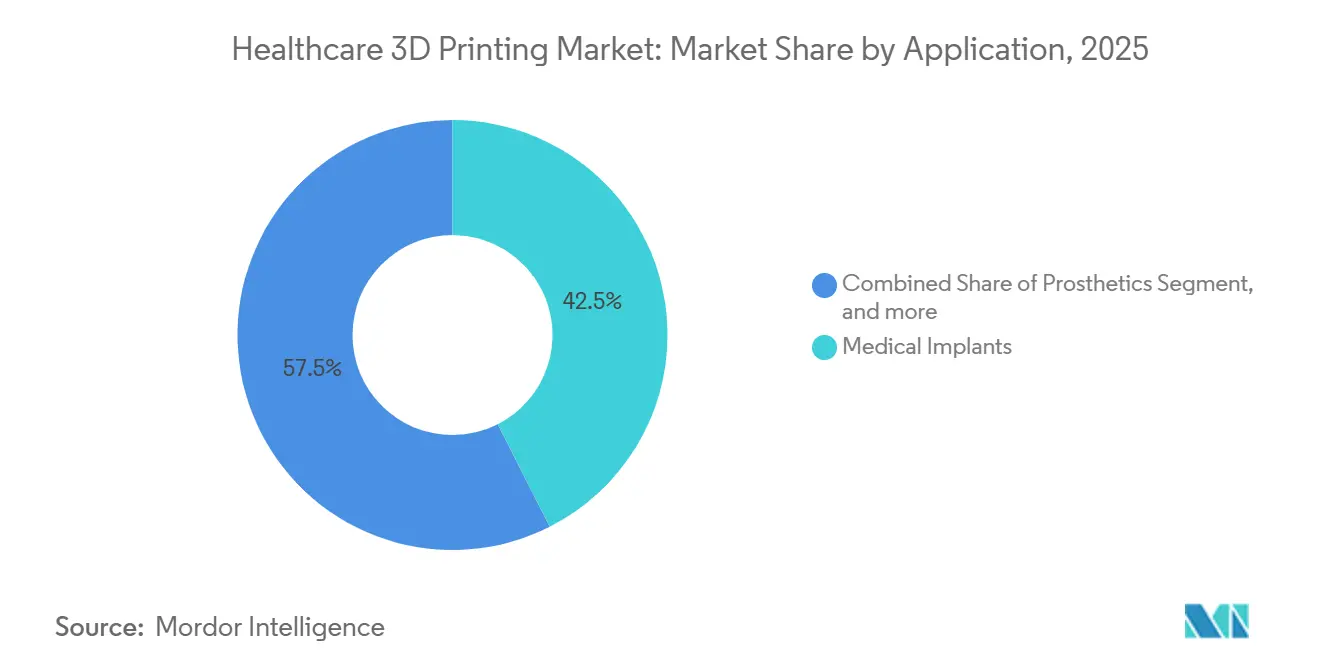
- By application, medical implants captured 42.53% of the healthcare 3D printing market size in 2025, while tissue engineering & bioprinting is advancing at a 20.67% CAGR through 2031.
- By material, metals & alloys accounted for 45.34% of the healthcare 3D printing market size in 2025; biomaterials/bio-inks are projected to record the highest CAGR at 20.11% through 2031.
- By geography, North America retained 40.43% of the 2025 revenue, whereas the Asia-Pacific region is expected to grow at a 19.54% CAGR through 2031.
Note: Market size and forecast figures in this report are generated using Mordor Intelligence’s proprietary estimation framework, updated with the latest available data and insights as of January 2026.
Global Healthcare 3D Printing Market Trends and Insights
Drivers Impact Analysis*
| Driver | (~) % Impact on CAGR Forecast | Geographic Relevance | Impact Timeline |
|---|---|---|---|
| Advancements in additive-manufacturing precision & speed | +4.2% | Global, early in North America & Europe | Medium term (2-4 years) |
| Expanding clinical indications across orthopedics, dental & tissue engineering | +3.8% | Global, strongest in North America & Asia-Pacific | Long term (≥4 years) |
| Growing acceptance of patient-specific implants & prosthetics | +3.5% | North America, Europe, urban Asia-Pacific | Medium term (2-4 years) |
| Hospital-based point-of-care labs reducing surgical lead times | +2.9% | North America, select European sites, emerging in APAC | Short term (≤2 years) |
| AI-driven automated design optimization | +2.1% | North America, Europe, Japan | Medium term (2-4 years) |
| Reimbursement codes for 3D-printed anatomical models | +1.8% | United States, Germany, Japan | Short term (≤2 years) |
| Source: Mordor Intelligence | |||
Advancements In Additive Manufacturing: Precision and Speed
Electron-beam systems now densify titanium lattices in single-digit-hour build cycles, enabling same-week delivery of patient-specific spinal cages. Multi-laser configurations double throughput without sacrificing dimensional tolerances, so batch production of 50–100 cranial plates becomes cost-competitive. Surface-finish gains reduce polishing, which formerly consumed 20%–30% of total production time. Lower per-part cost allows hospitals to match pricing on machined alternatives while retaining customization advantages. Such efficiencies collectively add roughly 4.2 percentage points to the sector’s forecast CAGR.
Expanding Clinical Indications Across Orthopedics, Dental, and Tissue Engineering
Dental labs produce clear-aligner molds in under 48 hours, displacing thermoforming workflows that took 10 days. Bioprinted vascularized constructs now remain viable for multi-week toxicology tests, meeting pharmaceutical screening thresholds. The FDA’s draft guidance on bioprinted tissues clarifies sterility and potency requirements, reducing filing uncertainty. As evidence accrues and reimbursement codes broaden, adoption will spread from tertiary centers to community hospitals. These factors collectively lift the CAGR contribution by 3.8 percentage points.
Growing Acceptance of Patient-Specific Implants and Prosthetics
Clinical data show custom implants cut revision rates and operating-room time, lowering overall cost of care. Prosthetic sockets with lattice structures distribute pressure evenly, resulting in improved comfort scores in peer-reviewed trials. Insurance parity encourages hospitals to order custom devices because reimbursement matches prefabricated alternatives[1]Centers for Medicare & Medicaid Services, “CY 2025 Physician Fee Schedule Final Rule,” cms.gov. German and Japanese payers have issued similar coverage, bolstering global diffusion. Acceptance adds 3.5 percentage points to forecast growth.
Hospital-Based Point-of-Care 3D Printing Labs Reducing Surgical Lead Times
Academic centers with on-site printers reduce model-delivery time from weeks to days; surgeons can iterate and guide the same day, which is impossible with distant service bureaus. Automated DICOM-to-print software cuts segmentation to under 30 minutes, lowering skill barriers. The FDA considers single-patient hospital prints as physician-directed, exempting them from pre-market review. Resulting time savings and scheduling flexibility raise procedure volume, contributing 2.9 percentage points to CAGR.
Restraints Impact Analysis*
| Restraint | (~) % Impact on CAGR Forecast | Geographic Relevance | Impact Timeline |
|---|---|---|---|
| Stringent regulatory approval pathways | −2.3% | Global, acute in North America & Europe | Medium term (2-4 years) |
| Skilled workforce shortage | −1.8% | Global, pronounced in emerging APAC | Long term (≥4 years) |
| Non-standardized sterilization for porous implants | −1.5% | Global, regulatory gaps in APAC & MEA | Medium term (2-4 years) |
| Raw-material supply volatility | −1.2% | Global, supply centered in Europe & North America | Short term (≤2 years) |
| Source: Mordor Intelligence | |||
Stringent Regulatory Approval Pathways for 3D-Printed Medical Devices
Process variability complicates validation, extending FDA 510(k) timelines by several months and necessitating costly powder characterization tests. Under Europe’s MDR, manufacturers must prove equivalence with machined predicates that lack porous architectures, inflating evidence requirements. Consulting fees can exceed USD 500,000 per device submission, deterring startups. ISO/ASTM standards harmonize terminology yet remain voluntary, so firms juggle fragmented regional rules. These factors reduce CAGR by 2.3 percentage points.
Shortage of Skilled Additive Manufacturing Workforce in Healthcare
Fewer than 30 universities offer curricula that combine ISO 13485 and hands-on printer operation, thereby limiting the talent supply. Hospitals rely on OEM service contracts, which raise operating costs and hinder in-house innovation. APAC growth intensifies shortages; Indian firms report additive-manufacturing vacancy rates above 25%. Certification bodies have launched fast-track courses, but equipment and instructor scarcity hinder their scale. Workforce gaps subtract 1.8 percentage points from forecast growth.
*Our forecasts treat driver/restraint impacts as directional, not additive. The impact forecasts reflect baseline growth, mix effects, and variable interactions.
Segment Analysis
By Technology: Resolution And Material Compatibility Drive Adoption
Stereo lithography contributed 38.42% of 2025 revenue, underscoring its dominance within the healthcare 3D printing market. Ultra-fine layers below 25 microns provide the smooth surfaces required for clear aligners and craniofacial models, while biocompatible photopolymers simplify FDA material submissions[2]U.S. Food and Drug Administration, “Premarket Notification Database,” fda.gov. EBM adoption accelerates at a 20.43% CAGR because it fuses high-melting-point titanium without residual porosity, essential for load-bearing hip stems.
Fused deposition modeling retains appeal for budget-sensitive anatomical models, whereas selective laser sintering satisfies dental and hearing-aid niches by pairing nylon powders with autoclave stability. PolyJet’s multi-material capability simulates cartilage versus bone in surgical rehearsals, and binder-jet ceramics supply bioactive scaffolds. Laminated-object manufacturing wanes as resin and powder systems match its economics with higher precision. Technologies such as 4d printing in healthcare that embed closed-loop melt-pool monitoring address FDA expectations for process validation, directing hospitals toward vendors offering turnkey compliance.



By Application: Implants Dominate, Bioprinting Gains Momentum
Medical implants accounted for 42.53% of 2025 application revenue, underscoring their dominance in the healthcare 3D printing market. Surgeons value pre-contoured titanium acetabular cups that cut fitting time, while dental zirconia crowns fabricated via powder-bed fusion fetch premium pricing. Tissue engineering and bioprinting, although still in their early stages, are expected to log a 20.67% CAGR as vascularized constructs address pharma’s need for human-relevant toxicology models.
Procedural reimbursement for surgical guides led to a rapid uptake, with hospitals printing models for 15%–20% of complex cases. Prosthetics benefit from lattice sockets that reduce skin-pressure hotspots, enhancing patient satisfaction. Wearable devices remain nascent, but they could expand once flexible filaments clear the biocompatibility hurdles. Implant design advances focus on graded porosity that encourages bone ingrowth and mitigates stress shielding, features unattainable in machined components.
By Material: Metals Lead, Bio-Inks Show Highest Growth Potential
Metals & alloys accounted for 45.34% of the 2025 material revenue, the largest share of the healthcare 3D printing market size for materials. Titanium alloy’s osteoconductivity underpins orthopedic dominance, while cobalt-chromium resists wear in articulating joints. Biomaterials and bio-inks are expected to post a 20.11% CAGR, with alginate-gelatin hydrogels demonstrating>85% post-print cell viability in preclinical studies.
Polymers and photopolymers meet the demands of dental and prosthetic applications with sterilizable methacrylate resins and polyamide-12. Ceramic scaffolds account for less than 10% of sales but attract niche demand for bioactive bone substitutes. Supply-chain risk remains: single-source polyamide-12 outages disrupt printer utilization rates, motivating device firms to dual-source materials. Metal powder innovation prioritizes spherical morphology to improve flow and fatigue life, while polymer vendors pursue antimicrobial additives to fight post-operative infection.
Geography Analysis
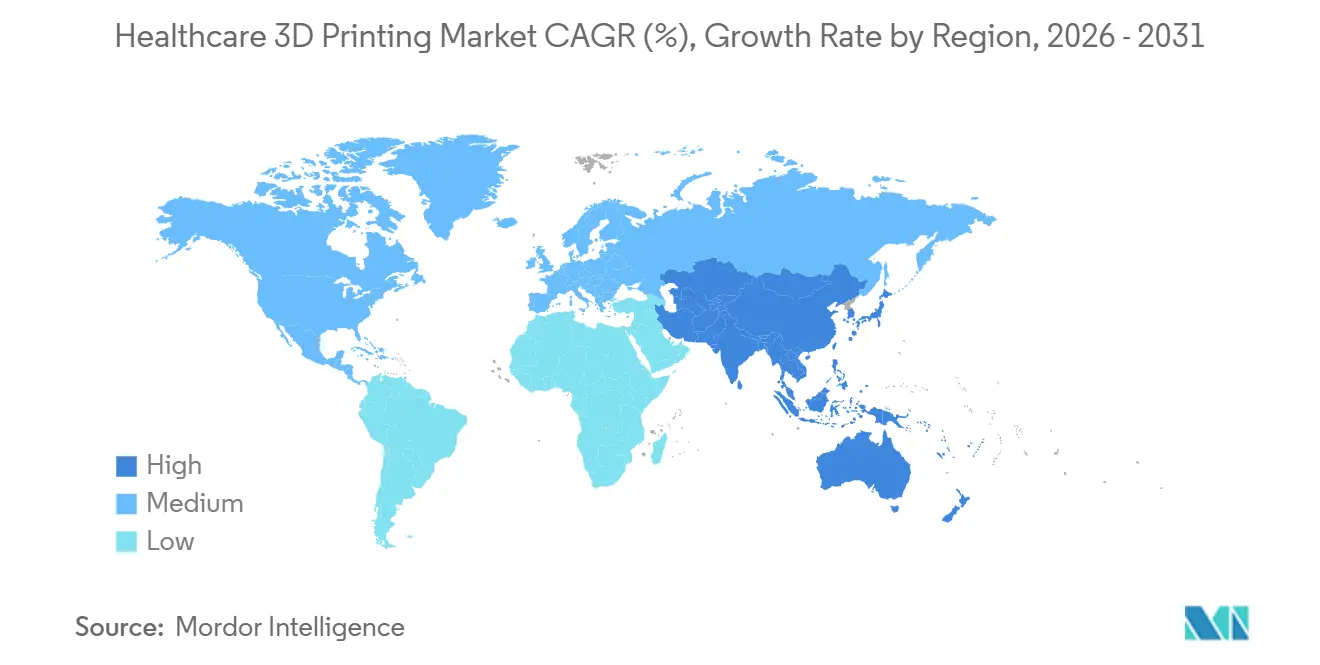
North America contributed 40.43% of the 2025 revenue, the largest regional share of the healthcare 3D printing market. The FDA’s additive-manufacturing guidance, coupled with CMS reimbursement for anatomical models, propels adoption across academic and community hospitals. Canada follows similar regulatory contours, yet provincial reimbursement heterogeneity tempers uniform uptake. Mexico utilizes duty-free zones to attract dental device contract manufacturing for export to the United States.
The Asia-Pacific region is expected to grow at a 19.54% CAGR through 2031, as China, Japan, and South Korea implement national additive manufacturing strategies. China scaled domestic powder output and expedited device approvals, reducing dependence on imports[3]National Medical Products Administration of China, “Guideline for Additively Manufactured Implants,” nmpa.gov.cn. Japan’s PMDA introduced fast-track pathways, and public insurers now cover patient-specific titanium implants. South Korean research centers are focusing on vascularized bioprinting to conduct clinical trials within five years. India positions itself as an orthopedic export hub but faces workforce constraints.
Europe held a mid-20s share in 2025. German insurers reimburse surgical guides, spurring equipment orders; the United Kingdom’s NHS pilots centralized 3D printing hubs to pool demand. France shortened customs implant reviews under its ANSM agency. The Middle East and Africa remain sub-10% share: the UAE’s free zones host orthopedic startups, whereas broader regional adoption lags due to reimbursement gaps. South America captures a low single-digit share, with Brazil approving primarily dental devices; tariffs inflate equipment costs.

Regulatory Landscape
Healthcare 3D printing remains regulated under conventional medical device pathways, with additive manufacturing-specific controls layered onto existing quality and risk frameworks. In the United States, the FDA, via CDRH, oversees 3D-printed medical devices through 510(k), De Novo, or PMA routes as applicable, supported by its additive manufacturing technical considerations guidance. A key quality anchor is the FDA Quality Management System Regulation (QMSR) final rule (2024), which incorporates ISO 13485:2016 by reference and pushes manufacturers and regulated point-of-care programs to tighten process validation, documentation, and supplier controls.
In Europe, compliance is governed by EU MDR 2017/745, while Article 5(5) continues to be a practical route for health institutions producing devices for in-house use under defined conditions (safety, performance, and quality controls) rather than full commercial placing-on-the-market. The Medical Device Coordination Group (MDCG) added an additional 3D-printing-specific reference point with guidance released in April 2026 on conformity assessment considerations for 3D-printed products used in medical contexts, alongside ongoing MDR implementation pressure that raises evidence expectations for porous and patient-matched implants. Across regions, updated ISO standards such as ISO 20417:2026 (information supplied by the manufacturer) and ISO 10993-6:2026 (biological evaluation, local effects) increase scrutiny on labeling, traceability, and biological safety characterization for novel printed materials and geometries.
Value Chain Analysis
The healthcare 3D printing value chain spans (1) patient data acquisition and planning (imaging, segmentation, and CAD), (2) design and simulation (including patient-specific design automation), (3) certified material supply (medical-grade powders, photopolymers, and bio-inks), (4) printing and post-processing (heat treatment, depowdering, finishing), (5) inspection and documentation (metrology, batch traceability, and quality records aligned to ISO 13485/QMSR expectations), and (6) sterilization, distribution, and clinical use across hospitals, dental labs, and device OEM channels. Workflow ownership increasingly bundles hardware, software, and validated materials, reflecting the need to control variability and to shorten the iteration loop for surgical guides, anatomical models, and implants.
Recent operating models show a split between centralized certified production and distributed point-of-care networks with remote quality oversight. Ricoh USA, Inc. created Ricoh 3D for Healthcare, LLC (June 2025) to centralize production of FDA-cleared patient-specific devices while also supporting hospital point-of-care studios, illustrating how regulated manufacturing and hospital deployment can be managed as one system. On the materials-to-production bridge, Himed and Adva Cera partnered in May 2026 to connect R&D through serial production for 3D-printed bioceramic medical devices, reducing re-qualification friction between prototype and scale manufacturing. Bottlenecks persist around (i) skilled workforce availability for additive plus clinical quality engineering, (ii) validation of materials and parameters for regulated use, and (iii) integrating QMS controls into decentralized hospital environments where repeatability and traceability must be maintained across sites.
Competitive Landscape
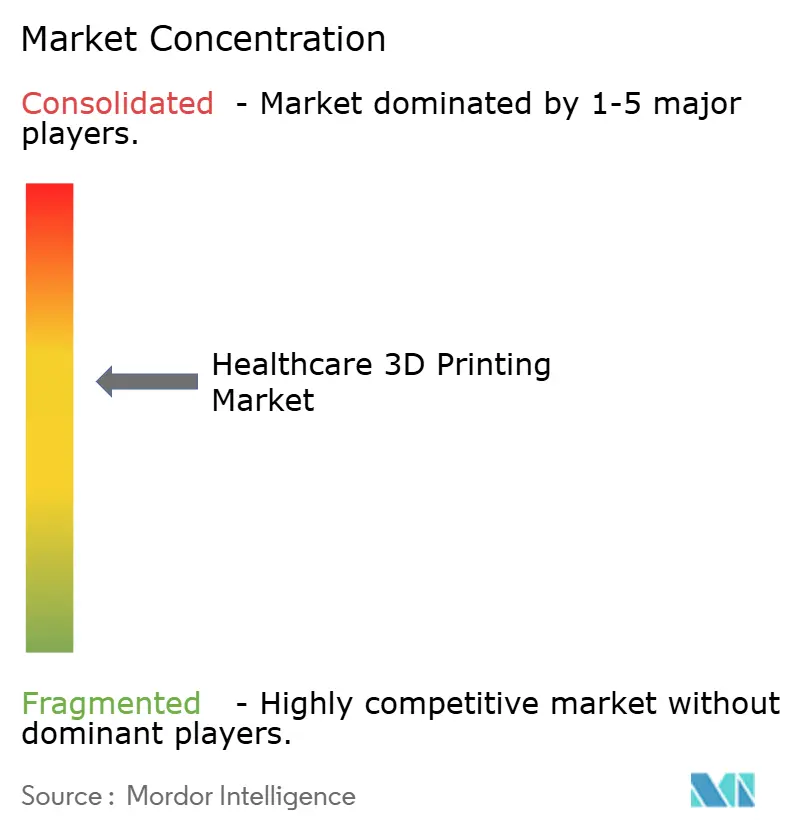
The healthcare 3D printing market is moderately concentrated, with the top five suppliers accounting for roughly 35% of the 2025 revenue. Orthopedic giants such as Zimmer Biomet and Stryker vertically integrate by acquiring powder manufacturers, securing feedstock quality and margin stability. EOS and 3D Systems differentiate with closed-loop melt-pool monitoring that satisfies FDA validation criteria, while Stratasys monetizes design-automation software through subscription models.
Startups exploit white spaces in bioprinting and ceramic scaffolds. Organovo and CELLINK pursue vascularized liver constructs for pharma toxicology before pivoting to therapeutic grafts. Partnership deals proliferate: software vendors embed generative design engines directly into printer controllers, sharing royalties on medical machines sold. Capital budgets under USD 100,000 favor compact printers tailored for dental labs and hospital point-of-care units, a niche populated by Formlabs and Carbon. ISO 13485 certification and FDA registration serve as acquisition filters; large corporates buy compliance infrastructure rather than build it.
Recent litigation trends show patent enforcement around lattice-optimization algorithms, signaling the strategic importance of design IP. Powder suppliers enter into long-term agreements with implant manufacturers to secure predictable demand and hedge against fluctuations in commodity prices. The competitive focus is shifting from printer price to turnkey workflow ownership, which bundles hardware, software, materials, and quality documentation templates.
Healthcare 3D Printing Industry Leaders
Nanoscribe GmbH & Co. KG
Stratasys Ltd
3D Systems Inc.
EOS GmbH
Renishaw PLC
- *Disclaimer: Major Players sorted in no particular order

Market Opportunities and Future Outlook
Point-of-care expansion remains a key whitespace, with hospitals moving beyond prototyping into standardized in-house manufacturing programs for anatomical models, guides, and selected patient-specific devices, supported by purpose-built operating models and software-controlled digital threads. In July 2026, Indiana University Health opened an upgraded 3D Print Studio at the 16 Tech Innovation District for patient-specific anatomical model production, developed alongside Ricoh 3D for Healthcare, LLC, which indicates more institutional investment in repeatable, on-site capacity rather than ad hoc outsourcing. A parallel opportunity sits in hospital-based implant programs that connect design, validation, and manufacturing: Rambam Health Care Campus partnered with EOS and PTC in July 2026 to establish a Digital Implant Engineering Center in Haifa focused on in-house patient-specific metal implants, reinforcing demand for integrated workflows that combine CAD, manufacturing parameters, and quality documentation.
Materials and regulatory-ready platforms create additional commercialization headroom, especially where suppliers can provide biocompatibility packages, sterilization compatibility, and documentation templates aligned to ISO 13485/QMSR. The QMSR effective date in February 2026 strengthens incentives for manufacturers and point-of-care operators to invest in harmonized quality systems that can support multi-site deployment and faster transfer from pilot to routine production. In therapeutic and reconstructive applications, emerging clinical evidence continues to open niches for bioresorbable and patient-matched scaffolds: BellaSeno reported outcomes for 30 patients receiving resorbable 3D-printed breast scaffolds in July 2026, supporting continued activity in regulated, application-specific implantable constructs where geometry and resorption profiles are central differentiators. Across these opportunities, the most immediate adoption pathways favor solutions that reduce validation burden for hospitals and OEMs through prequalified materials, controlled process monitoring, and auditable traceability from imaging to final part.
Recent Industry Developments
- July 2026: EOS partnered with Rambam Health Care Campus and PTC to establish a Digital Implant Engineering Center in Haifa, Israel, focused on in-house production of patient-specific metal 3D-printed implants. The initiative tightens the link between surgical planning, design iteration, and regulated manufacturing inside a hospital setting. It also strengthens demand for integrated software-to-printer workflows that can carry traceability and quality documentation end to end.
- June 2026: Stratasys introduced P3 MED Silicone 25A for medical device production, positioned as ISO 10993 certified for biocompatibility. The launch expands the addressable set of silicone-based clinical and device applications that require validated material properties and regulated documentation. Materials with clearer compliance packages also reduce qualification time for manufacturers scaling from prototypes to production.
- December 2024: Materialise launched its fully integrated Materialise Mimics platform to improve efficiency in advanced 3D planning and personalized device creation. By consolidating planning and device workflow steps, the platform supports faster model and guide preparation for hospitals and medical device companies. The release underscores the competitive shift toward software-led workflow integration alongside printers and materials.


Research Methodology Framework and Report Scope
Market Definition and Coverage
For this study, the market is defined as the revenue generated from 3D printing technologies and related services used for healthcare use cases, including patient-specific planning models, surgical guides, implants, prosthetics, and bioprinting-oriented outputs.
Scope exclusions: We exclude conventional subtractive manufacturing of medical parts and standard medical imaging, unless they directly result in a 3D printed healthcare output.
Segmentation Overview
- By Technology
- Stereo Lithography
- Fused Deposition Modeling
- Selective Laser Sintering
- Electron Beam Melting
- PolyJet / MultiJet
- Binder Jetting
- Laminated Object Manufacturing
- By Application
- Medical Implants
- Prosthetics
- Surgical Guides & Anatomical Models
- Tissue Engineering & Bioprinting
- Wearable Devices
- By Material
- Metals & Alloys
- Polymers & Photopolymers
- Ceramics & Bioceramics
- Biomaterials / Bio-Inks
- Geography
- North America
- United States
- Canada
- Mexico
- Europe
- Germany
- United Kingdom
- France
- Italy
- Spain
- Rest Of Europe
- Asia-Pacific
- China
- Japan
- India
- Australia
- South Korea
- Rest Of Asia-Pacific
- Middle East And Africa
- GCC
- South Africa
- Rest Of Middle East And Africa
- South America
- Brazil
- Argentina
- Rest Of South America
- North America
Data Sources, Market Sizing, and Validation
Desk Research
Desk research was used to set the fact base and boundaries before any modeling was built. We mainly used public sources that describe healthcare demand and procedure volumes, plus additive manufacturing adoption signals, such as FDA device databases and guidance notes, CDC and WHO health statistics, OECD health indicators, and World Bank macro data.
To keep the numbers practical, pricing and volume context was also cross-checked using company annual reports, investor presentations, earnings call transcripts, and credible medical and engineering journals that cover 3D printing workflows and materials. Where needed, paid subscriptions for company financials and patent landscaping were used to confirm product activity, shipment mentions, and technology intensity, which then supported the assumptions used in the model. These desk sources are illustrative, and other public references were also used for data collection, validation, and clarification throughout the work.
Primary Interviews and Surveys
Primary work focused on confirming what is actually being purchased and used in care delivery, and what portion is tied to healthcare budgets versus adjacent R and D spending. We spoke with a mix of printer and material ecosystem participants, hospital lab and clinical engineering stakeholders, and distribution or service partners across APAC, EMEA, and the Americas so assumptions on utilization, typical pricing, and mix shifts could be stress-tested.
Inputs from these discussions were used to close gaps in desk data, align definitions (for example, what gets counted as a surgical guide versus a model), and then triangulate the final outputs with independent signals such as procedure growth and regulatory activity.
Distribution of primary research fieldwork respondents
| Company type | Respondent position | Region |
|---|---|---|
| Top tier: 31% | CXOs: 18% | APAC: 49% |
| Mid tier: 51% | Functional/Unit leaders: 28% | EMEA: 32% |
| Smaller Players: 18% | Managers: 54% | Americas: 19% |
Market-Sizing & Forecasting
Sizing was built using a top-down and bottom-up approach, where healthcare demand pools were reconstructed first and then adjusted using supplier-side reality checks. The top-down logic starts from indicators such as procedure volumes linked to implants and prosthetics, adoption of point-of-care printing, and the share of cases using printed models or guides, which are then converted into value using typical pricing bands.
To keep the totals grounded, selective bottom-up approximations were run in parallel, using sampled average selling price (ASP) by printer class and materials, service revenue mix, and installation and utilization checks gathered during interviews. When a country or application lacked hard data, we used proxy penetration rates from similar health systems and then re-tested the result through follow-up calls until the range narrowed.
For forecasting, scenario analysis was applied so growth reflects how quickly hospitals scale in-house labs, how material qualification progresses, and how regulatory pathways influence patient-specific devices. Key inputs used in the model included installed base growth, utilization rates per printer, materials consumption per case, mix shifts between polymers and metals, and regional currency conversion timing for reported revenues.
Data Validation & Update Cycle
Outputs were validated through triangulation across three layers, independent demand signals, supplier-side checks, and pricing sanity tests by application. Variances were flagged when growth moved away from procedure trends, when ASP movement did not align with mix changes, or when a region showed adoption patterns that did not match interview feedback.
Before sign-off, the model is reviewed in multiple analyst passes so assumptions, calculations, and conversions can be traced back to the input logic. Reports are refreshed annually, and interim updates are made when material events occur, such as major regulatory changes or step-changes in hospital adoption. Just before delivery, we run a fresh pass on key inputs so the latest view is reflected in the final numbers.
Mordor Intelligence's Healthcare Industry Global 3d Printing Market Sizing Compared With Other Published Estimates
Published market sizes for healthcare 3D printing can look far apart even when the topic name is similar, because the boundaries and timing choices are not the same. Differences usually come from what gets counted as revenue (printers only versus printers plus materials and services), whether bioprinting-related activity is included, and how regions and currencies are handled.
A common split in this market comes from refresh cadence and currency timing, because fast ASP changes and mix shifts can move the value meaningfully within a year. For that reason, the model is rechecked with updated conversion rates and pricing checks before finalization in Mordor Intelligence.
Benchmark comparison
| Source | Market Size | Gaps in Research Methodology |
|---|---|---|
| Mordor Intelligence | USD 11.95 B (2025) | |
| Industry Publisher A | USD 1.96 B (2025) | Likely reflects a narrower spend definition that leans toward printer systems and selected services, while excluding a broader materials value pool and some healthcare applications that are counted in wider market definitions. |
| Global Publisher B | USD 9.86 B (2024) | Uses a different base year and may apply alternative ASP progressions by technology and materials, which can shift the value when utilization and mix are changing quickly across regions. |
Looking across the three figures, most of the spread is explained by scope width and the year used for pricing and currency conversion. When the market is rebuilt from clear demand indicators and then cross-checked with real-world pricing and utilization feedback, the resulting estimate stays traceable and can be repeated as inputs refresh year to year.


Key Questions Answered in the Report
How large is the healthcare 3D printing market in 2026?
It is valued at USD 14.15 billion, with an 18.43% CAGR projected through 2031.
Which technology leads current revenues?
Stereo lithography holds 38.42% of 2025 revenue due to high resolution and biocompatible resins.
What is the fastest-growing regional segment?
Asia-Pacific is forecast to expand at 19.54% CAGR through 2031 as China, Japan and South Korea scale capacity.
Why are titanium powders critical?
Titanium's biocompatibility and strength make it indispensable for load-bearing implants, giving metals 45.34% of 2025 material revenue.
How do reimbursement policies impact adoption?
CMS and other insurers now reimburse anatomical models and custom implants, turning 3D printing into a revenue-neutral or cost-saving option for hospitals.
Page last updated on:





