Market Overview
| Study Period | 2021 - 2031 |
|---|---|
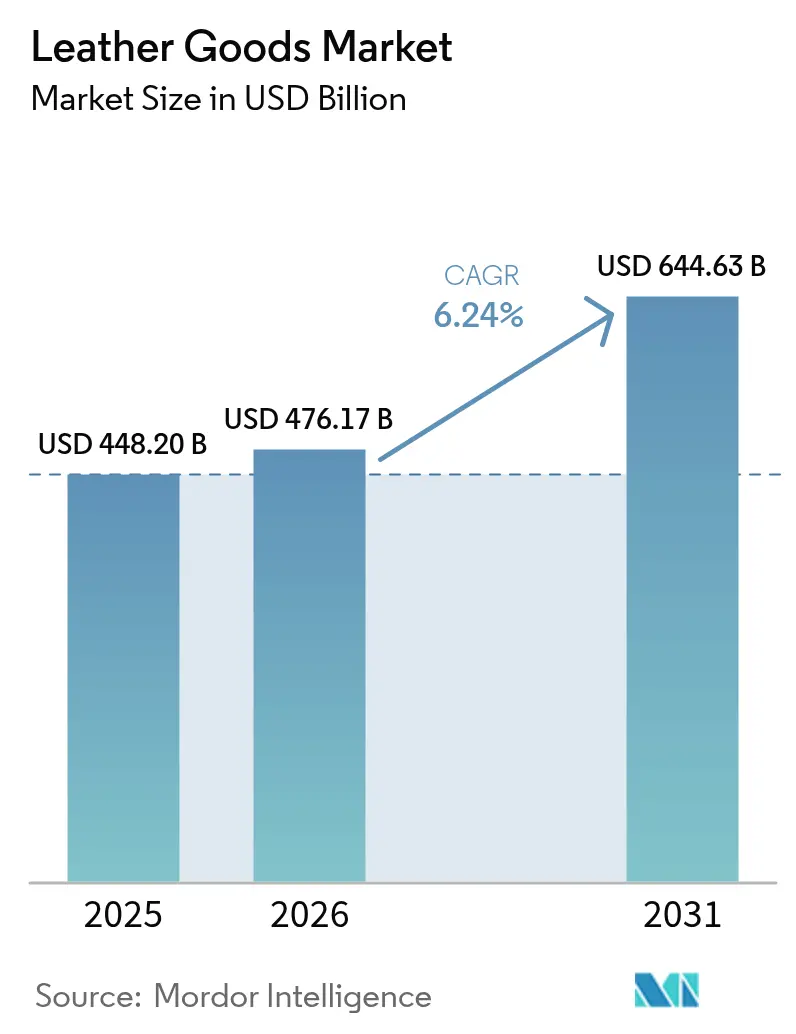
| Market Size (2026) | USD 476.17 Billion |
| Market Size (2031) | USD 644.63 Billion |
| Growth Rate (2026 - 2031) | 6.24% CAGR |
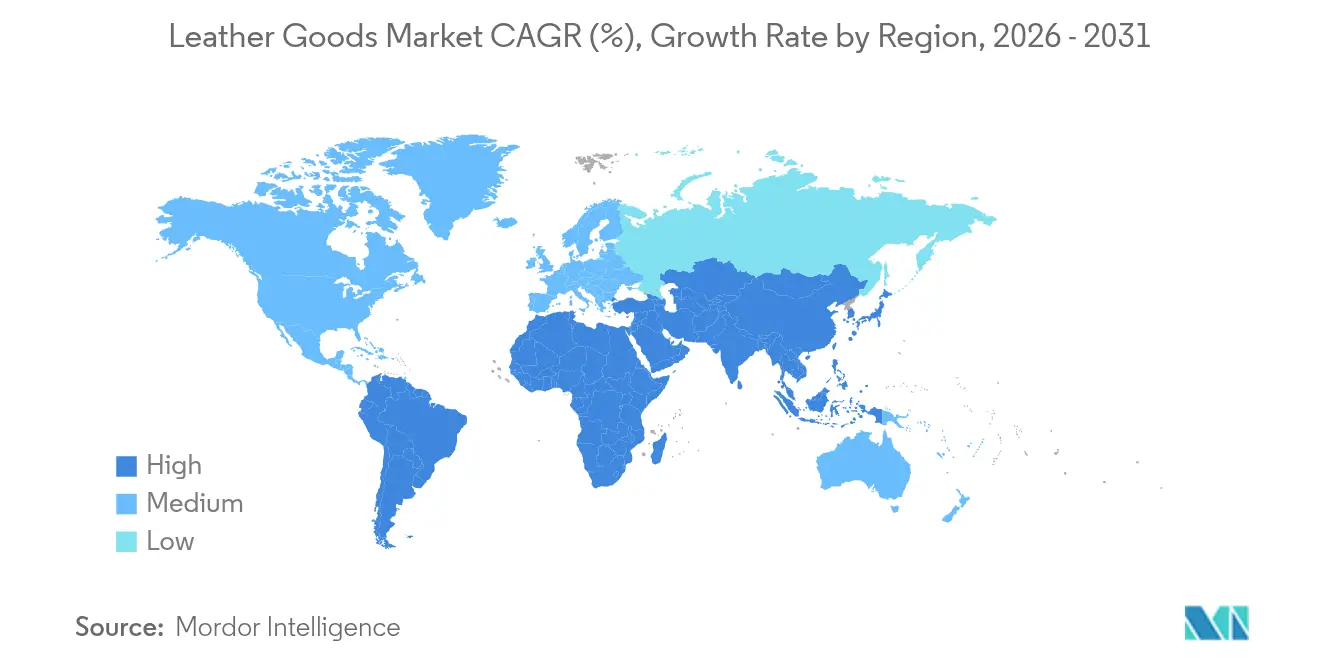
| Fastest Growing Market | Middle East and Africa |
| Largest Market | Asia Pacific |
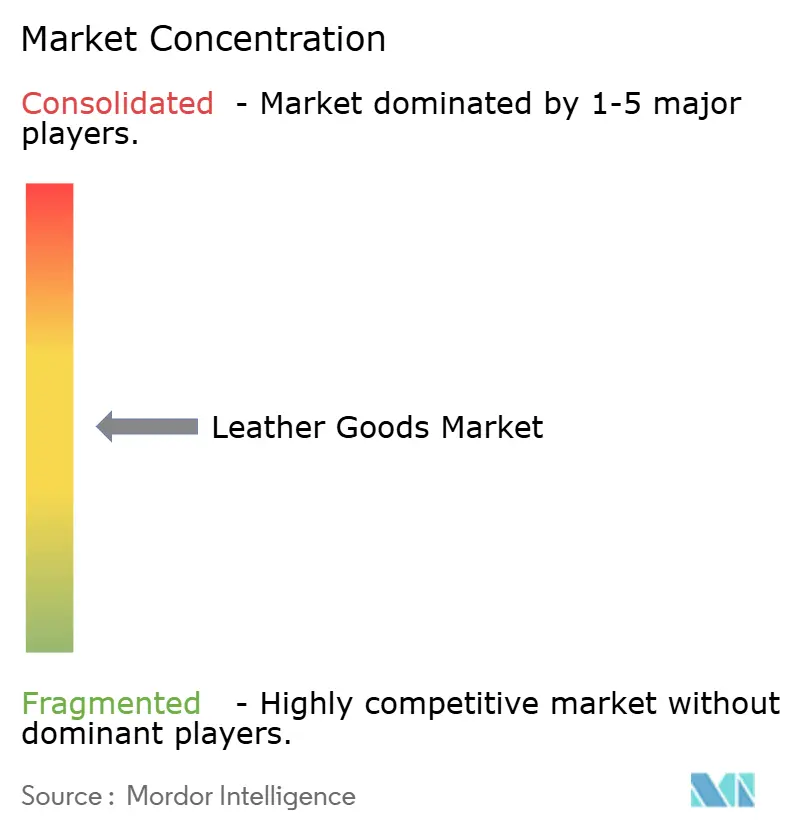
| Market Concentration | Medium |
Major Players *Disclaimer: Major Players sorted in no particular order Image © Mordor Intelligence. Reuse requires attribution under CC BY 4.0. | |
Leather Goods Market Analysis by Mordor Intelligence
The leather goods market size is expected to grow from USD 448.2 billion in 2025 to USD 476.17 billion in 2026 and is forecast to reach USD 644.63 billion by 2031 at 6.24% CAGR over 2026-2031. The market's expansion is attributed to heightened consumer demand for premium leather products, evolving fashion preferences, increased adoption of sustainable alternatives, and diversification in product portfolios. Regional market development is fundamentally driven by the expansion of middle-class demographics, progressive urbanization, and the transformation of consumer preferences toward luxury and customized merchandise. The market derives substantial benefits from technological advancements in manufacturing processes, sophisticated retail distribution networks, established brand equity, and strategic celebrity collaborations. Nevertheless, the industry encounters significant challenges with environmental regulations and fluctuations in raw material costs. Overall, the market's sustained progression reflects the equilibrium between traditional craftsmanship, technological innovation, and evolving consumer preferences.
Key Report Takeaways
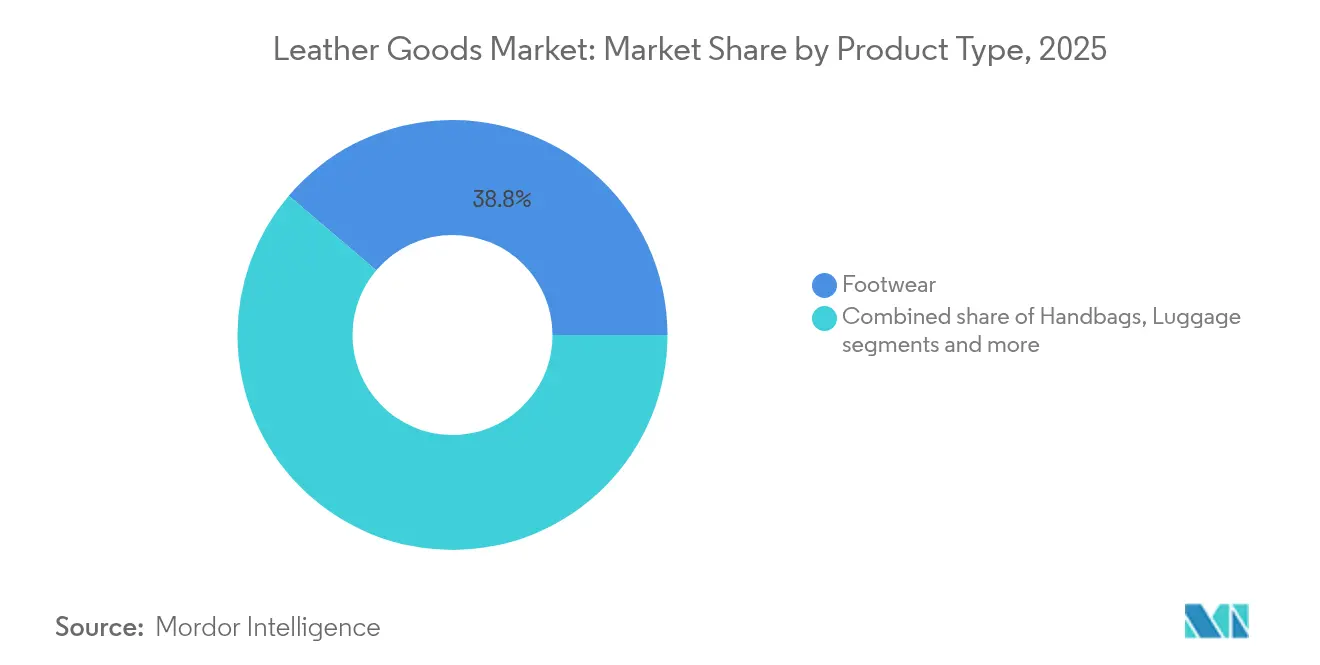
- By product, footwear led with 38.78% revenue share in 2025; accessories are forecast to expand at a 7.12% CAGR through 2031.
- By end user, men held 52.05% of the leather goods market share in 2025, while women are projected to advance at a 6.68% CAGR to 2031.
- By category, mass products accounted for a 62.88% share of the leather goods market size in 2025, yet the premium tier is poised to climb at a 7.31% CAGR between 2026-2031.
- By distribution channel, offline retail captured 70.55% of 2025 sales; online retail is set to accelerate at a 8.87% CAGR through 2031.
- By geography, Asia-Pacific commanded 39.52% of global revenue in 2025, whereas the Middle East and Africa is expected to record the fastest regional CAGR at 8.12% over the forecast period.
Note: Market size and forecast figures in this report are generated using Mordor Intelligence’s proprietary estimation framework, updated with the latest available data and insights as of 2026.
Global Leather Goods Market Trends and Insights
Drivers Impact Analysis*
| Driver | (~) % Impact on CAGR Forecast | Geographic Relevance | Impact Timeline |
|---|---|---|---|
| Rising demand for premium and luxury leather products | +1.8% | Global, with concentration in Asia-Pacific and North America | Medium term (2-4 years) |
| Cultural and social influences are driving the market growth | +1.4% | Global, with emphasis on Asia-Pacific and emerging markets | Long term (≥ 4 years) |
| Increasing demand for sustainability and eco-friendly leather | +1.5% | Europe and North America, with regulatory spillover to Asia-Pacific | Long term (≥ 4 years) |
| Influence of brand awareness and celebrity endorsements | +0.9% | Global, with emphasis on North America and Europe | Short term (≤ 2 years) |
| Increasing travel and tourism | +0.7% | Global, with recovery focus in Asia-Pacific and Europe | Medium term (2-4 years) |
| Strong presence of established luxury brands | +0.6% | Global, with strategic expansion in emerging markets | Medium term (2-4 years) |
| Source: Mordor Intelligence | |||
Rising demand for premium and luxury leather products
The global leather goods market demonstrates substantial growth propelled by heightened demand for premium and luxury leather products. Consumers exhibit a pronounced preference for high-quality, durable items that integrate functionality with sophisticated aesthetics. Manufacturers of luxury leather goods emphasize exceptional craftsmanship and distinctive designs, catering to clientele who prioritize sustained quality over cost considerations. Market expansion is facilitated by increased disposable incomes, notably in emerging economies, coupled with the geographical diversification of luxury consumption beyond established markets. In September 2024, fashion brand Mr P. initiated its presence in the luxury leather segment through the introduction of an autumn/winter collection comprising holdalls, totes, briefcases, and pouches. This strategic market entry exemplifies the systematic approach companies employ in developing premium leather product lines to address evolving consumer requirements.
Cultural and social influences are driving the market growth
Cultural and social influences significantly influence the global leather goods market's expansion through their impact on consumer preferences and the positioning of leather products as representations of heritage and craftsmanship. Consumers demonstrate a marked preference for authenticity, cultural narratives, and responsible production methodologies, which necessitate brands to incorporate traditional practices and artisanal techniques into their product offerings. The integration of culturally influenced and ethically manufactured leather goods facilitates market expansion while enabling distinct product differentiation. This trend is exemplified by Prada's July 2025 initiative, wherein the company introduced a limited edition Made in India leather sandals collection through collaboration with regional artisans. The collection, which derives its essence from Maharashtra's cultural heritage and maintains compliance with geographical indication requirements, serves as a platform to showcase the region's craftsmanship in the international market.
Increasing demand for sustainability and eco-friendly leather
The growing consumer demand for sustainable and eco-friendly leather products drives significant changes in the global leather goods market. Consumers increasingly seek products that demonstrate environmental responsibility and ethical manufacturing practices, focusing on reduced carbon footprints, animal welfare, and renewable materials. This market shift has prompted manufacturers to develop alternative leather sources, including plant-based and bio-fabricated materials, while improving supply chain transparency. For instance, in July 2024, India's P A Footwear collaborated with the National Institute for Interdisciplinary Science and Technology (NIIST) to launch eco-belts made from PETA-approved sugarcane leather. This development exemplifies the industry's adaptation to sustainability demands and demonstrates the practical implementation of eco-friendly alternatives in leather production.
Influence of brand awareness and celebrity endorsements
Brand awareness and celebrity endorsements drive the growth of the global leather goods market by increasing brand visibility and influencing consumer perceptions. Strong brand recognition builds consumer trust and loyalty, which typically results in increased sales. Celebrity endorsements create associations between products and desirable lifestyles, fostering emotional connections with consumers. These endorsements help brands expand into new markets and reach different demographic segments. In the leather goods market, where brand image and prestige significantly influence purchasing decisions, celebrity partnerships are particularly effective. For example, in February 2023, French leather goods brand Longchamp appointed Kim Se-Jeong, a singer and actress, as its brand ambassador for Asia. Kim Se-Jeong's popularity helps Longchamp strengthen its market presence and appeal to younger consumers across Asian markets.
Restraints Impact Analysis*
| Restraint | (~) % Impact on CAGR Forecast | Geographic Relevance | Impact Timeline |
|---|---|---|---|
| Stringent government regulations | -0.8% | Global, with emphasis on Europe and North America | Long term (≥ 4 years) |
| Counterfeit products and brand dilution | -0.6% | Global, with concentration in Asia-Pacific and emerging markets | Medium term (2-4 years) |
| Animal welfare concerns | -0.5% | Europe and North America, expanding to Asia-Pacific | Medium term (2-4 years) |
| Supply chain disruptions | -0.4% | Global, with particular impact on Asia-Pacific manufacturing | Short term (≤ 2 years) |
| Source: Mordor Intelligence | |||
Stringent government regulations
Government regulations significantly constrain the global leather goods market through increased compliance costs and operational complexities. Environmental protection, sustainable sourcing, and ethical production regulations continue to become more stringent worldwide. These regulations require companies to demonstrate supply chain transparency, prevent deforestation, and manage waste effectively, which affects production processes, increases costs, and restricts raw material availability. While these regulations promote sustainability, they create challenges for leather goods manufacturers, particularly smaller companies with limited resources for rapid adaptation. The Extended Producer Responsibility (EPR) regulation, implemented on January 1, 2025, across European Union (EU) member states, exemplifies this trend. The EPR mandates the separate collection of end-of-life textile products and imposes strict requirements on the textiles, apparel, footwear, and leather goods industries. The regulation requires leather users to prove their materials are not sourced from breeding farms on deforested land, enforcing sustainability and ethical sourcing standards.
Counterfeit products and brand dilution
The proliferation of counterfeit leather goods reduces brand value and pricing power, especially in premium segments where authentic products command higher prices. The growth of digital marketplaces makes it easier to distribute counterfeits, forcing brands to increase spending on anti-counterfeiting technologies and legal enforcement. Advanced counterfeit production methods, particularly in regions with established leather manufacturing, make traditional authentication and consumer education more difficult. Brand value diminishes through direct counterfeiting and unauthorized use of similar designs that mislead consumers. This issue is particularly significant in emerging markets with developing brand awareness and high price sensitivity. Addressing counterfeiting requires integrated approaches, including supply chain tracking, consumer education, legal action, and partnerships with e-commerce platforms to remove fake products.
*Our forecasts treat driver/restraint impacts as directional, not additive. The impact forecasts reflect baseline growth, mix effects, and variable interactions.
Segment Analysis
By Product Type: Accessories Drive Innovation While Footwear Maintains Volume Leadership
Footwear accounts for 38.78% of the leather goods market in 2025, representing the largest segment due to its fundamental role in daily life and regular replacement needs. The segment maintains strong performance through consistent consumer demand across global demographics, driven by requirements for durable and functional footwear. The combination of essential daily use and consumer preferences for quality and comfort establishes footwear as a primary revenue source in the leather goods industry. Moreover, Government initiatives in major manufacturing and exporting nations strengthen the industry's infrastructure and competitiveness. In August 2025, the Uttar Pradesh government in India implemented the Leather & Footwear Policy to expand the sector through capital subsidies, infrastructure improvements, workforce development programs, and export assistance .
The accessories segment leads growth in the leather goods market, with a projected CAGR of 7.12% through 2031. Consumer demand for personalized and distinctive products drives this expansion. Small leather goods, including belts, wallets, and accessories, provide affordable options for consumers to showcase brand preferences and update their style. For instance, in February 2025, Authentic Brands Group partnered with Unified Accessories to introduce a new Izod collection of belts and small leather goods. The collaboration features men's belts, wallets, and leather accessories, addressing market demand for quality branded products. This partnership reflects the market's shift toward branded and personalized leather accessories.


By End User: Women's Segment Accelerates Despite Men's Volume Dominance
Men constitute 52.05% of the leather goods market in 2025, attributed to established consumption patterns and superior purchasing capacity. The male consumer demographic demonstrates a distinct preference for durability and functionality in leather products, consequently extending product replacement intervals. Professional accessories, encompassing briefcases, formal footwear, wallets, and belts, sustain robust demand notwithstanding the evolution of workplace attire. Male consumers' inclination toward premium leather merchandise that integrates utilitarian aspects with professional aesthetics generates elevated average transaction values, thereby solidifying their predominant market position.
The women's segment in the leather goods market is expected to grow at a CAGR of 6.68% through 2031, exceeding the overall market growth rate. This growth stems from women's increasing economic empowerment and higher discretionary spending power worldwide. The rising financial independence of women and their growing influence on purchasing decisions have increased demand for various premium leather goods, including handbags, footwear, and accessories. According to the United Nations Development Programme (UNDP), the global Women's Empowerment Index (WEI) score reached 0.607 in 2023 . This ongoing improvement in women's empowerment correlates with increased purchasing power and lifestyle preferences, driving growth in the women's leather goods segment.
By Category: Premium Segment Outpaces Mass Market Despite Size Differential
Mass market products constitute a predominant 62.88% share of the leather goods market in 2025. This substantial market presence is attributed to the extensive distribution and accessibility of economically priced leather goods that fulfill fundamental consumer requirements. The segment encompasses essential merchandise, including wallets, belts, casual footwear, and bags, which integrate practical utility with aesthetic appeal. Manufacturing entities within the mass market segment implement cost-efficient production methodologies while maintaining product standards and incorporating contemporary design elements to maintain consistent consumer demand.
The premium leather goods market is expected to grow at a CAGR of 7.31% through 2031, driven by consumer demand for high-quality branded products. This growth stems from increasing disposable incomes, brand awareness, and appreciation for craftsmanship in leather accessories, footwear, and handbags. Consumers in this segment demonstrate a willingness to pay higher prices for superior materials and detailed designs. The growth is further supported by the expanding affluent population in emerging markets and the rise of online luxury retail channels. The premium segment's growth rate exceeds that of the overall leather goods market, highlighting its significance in driving industry value.

By Distribution Channel: Digital Transformation Accelerates Despite Physical Retail Dominance
Offline retail stores dominate the leather goods market with a 70.55% market share in 2025. This significant share reflects consumers' preference for physically examining leather products, allowing them to assess quality, texture, and craftsmanship before purchase. The traditional retail environment enables customers to evaluate essential characteristics such as suppleness, stitching, and finish firsthand. The presence of knowledgeable sales staff, personalized service, and immediate product availability further strengthens consumer confidence in purchasing decisions.
Online retail, despite its smaller market share, demonstrates the highest growth rate among distribution channels, with a projected CAGR of 8.87% through 2031. This growth stems from increased internet penetration, enhanced consumer confidence in digital shopping, and convenient doorstep delivery services. E-commerce platforms offer broader product selections, competitive prices, and improved accessibility. The integration of virtual try-on features, augmented reality, and detailed product visualization helps consumers make informed purchase decisions online. These technological advancements are transforming shopping patterns and encouraging traditional retailers to develop comprehensive omnichannel strategies.
Geography Analysis
Asia-Pacific holds a 39.52% share of the global leather goods market in 2025, driven by its manufacturing capabilities and expanding consumer market. China represents the largest market in the region, with luxury consumption extending beyond tier-one cities into emerging urban areas. The region's growth stems from increasing middle-class incomes, urbanization, and cultural preferences that associate leather goods with social status. This combination of domestic consumption and export production strengthens the Asia-Pacific's influence on global leather goods market trends.
The Middle East and Africa (MEA) region exhibits the highest growth rate with an 8.12% CAGR projected through 2031. This growth results from wealth diversification, expanding tourism, and a young, wealthy population with increasing exposure to luxury brands. North America maintains market stability despite tariff challenges, with consumers continuing to purchase premium leather goods despite higher prices. The region's preference for casual luxury and lifestyle products creates opportunities for brands combining traditional craftsmanship with contemporary design.
European markets maintain steady growth, supported by established heritage brands and strict quality and sustainability regulations. The United Kingdom, Germany, and Italy remain key markets in the region. The United Kingdom's footwear expenditure reached GBP 12.2 billion in 2023, increasing from GBP 11.0 billion in 2022, according to the Office for National Statistics, demonstrating sustained consumer spending on quality leather products . These regional patterns highlight the diverse factors influencing the global leather goods market's development.

Competitive Landscape
The global leather goods market shows moderate concentration, with major luxury companies holding strong market positions through diverse brand portfolios and vertical integration. LVMH, Kering S.A., and Hermes International S.A. use multi-brand platforms to serve different market segments while sharing manufacturing resources, distribution networks, and marketing capabilities. This structure creates competitive advantages through economies of scale, risk management, and stronger relationships with suppliers and retailers. The market includes many specialized manufacturers and regional companies that compete through niche positioning, traditional craftsmanship, or focus on specific product categories.
The competitive landscape is experiencing transformation through the emergence of sustainability-focused enterprises that present alternatives to conventional production methodologies, while synthetic leather manufacturers compete based on environmental performance metrics and competitive pricing structures. The integration of advanced technologies is reshaping competitive dynamics as organizations invest in digital infrastructure, supply chain transparency systems, and direct-to-consumer platforms to enhance customer engagement and reduce intermediary dependencies.
Market participants are increasingly focusing on product innovation, quality differentiation, and brand positioning to maintain competitive advantages. Companies are implementing strategic initiatives to expand their geographical presence, strengthen their distribution networks, and develop innovative product offerings to address evolving consumer preferences and market demands.
Leather Goods Industry Leaders
LVMH Moet Hennessy Louis Vuitton SE
Kering S.A.
Hermes International S.A.
Capri Holdings Limited
Samsonite International S.A.
- *Disclaimer: Major Players sorted in no particular order

Recent Industry Developments
- August 2025: Alo expanded into the Italian luxury leather bag market. The company's bags feature premium materials that combine style and functionality.
- July 2025: Louis Vuitton introduced a handbag designed in the shape of an autorickshaw. The brown handbag incorporates the company's signature monogram print, featuring miniature wheels and camel leather handles.
- October 2024: Montblanc has launched a new leather collection, featuring the Happy Holidays capsule, which draws inspiration from Alpine winter themes, alongside updates to its Meisterstuck collection.
- August 2024: Dr Martens introduced the Ambassador Leather collection. The boots feature the company's signature yellow welt stitching and black and yellow heel loop. The boots comprise a 100% leather upper and an interior made of 60% leather and 40% textile.


Global Leather Goods Market Report Scope
Leather goods are products made out of material from tanning hides and the skin of animals, mainly cattle. The process of tanning helps prevent the leather from being damaged while also smoothing its texture. The leather goods market is segmented on the basis of product type, distribution channel, and geography. Based on product type, the market is segmented into footwear, luggage, and accessories. The market is segmented by distribution channel into offline and online retail stores. The research also includes a global level analysis of the major regions, which include North America, Europe, Asia-Pacific, South America, the Middle East, and Africa. The market sizing and forecasts for each segment are based on value (in USD million).
By Product Type
| Footwear |
| Handbags |
| Luggage |
| Clothing |
| Accessories |
| Other Product Types |
By End User
| Male |
| Female |
By Category
| Mass |
| Premium |
By Distribution Channel
| Offline Retail Stores |
| Online Retail Stores |
By Geography
| North America | United States |
| Canada | |
| Mexico | |
| Rest of North America | |
| Europe | Germany |
| United Kingdom | |
| Italy | |
| France | |
| Spain | |
| Netherlands | |
| Poland | |
| Belgium | |
| Sweden | |
| Rest of Europe | |
| Asia-Pacific | China |
| India | |
| Japan | |
| Australia | |
| Indonesia | |
| South Korea | |
| Thailand | |
| Singapore | |
| Rest of Asia-Pacific | |
| South America | Brazil |
| Argentina | |
| Colombia | |
| Chile | |
| Peru | |
| Rest of South America | |
| Middle East and Africa | South Africa |
| Saudi Arabia | |
| United Arab Emirates | |
| Nigeria | |
| Egypt | |
| Morocco | |
| Turkey | |
| Rest of Middle East and Africa |
| By Product Type | Footwear | |
| Handbags | ||
| Luggage | ||
| Clothing | ||
| Accessories | ||
| Other Product Types | ||
| By End User | Male | |
| Female | ||
| By Category | Mass | |
| Premium | ||
| By Distribution Channel | Offline Retail Stores | |
| Online Retail Stores | ||
| By Geography | North America | United States |
| Canada | ||
| Mexico | ||
| Rest of North America | ||
| Europe | Germany | |
| United Kingdom | ||
| Italy | ||
| France | ||
| Spain | ||
| Netherlands | ||
| Poland | ||
| Belgium | ||
| Sweden | ||
| Rest of Europe | ||
| Asia-Pacific | China | |
| India | ||
| Japan | ||
| Australia | ||
| Indonesia | ||
| South Korea | ||
| Thailand | ||
| Singapore | ||
| Rest of Asia-Pacific | ||
| South America | Brazil | |
| Argentina | ||
| Colombia | ||
| Chile | ||
| Peru | ||
| Rest of South America | ||
| Middle East and Africa | South Africa | |
| Saudi Arabia | ||
| United Arab Emirates | ||
| Nigeria | ||
| Egypt | ||
| Morocco | ||
| Turkey | ||
| Rest of Middle East and Africa | ||


Key Questions Answered in the Report
How big is the leather goods market in 2026?
The leather goods market size stands at USD 476.17 billion in 2026 and is forecast to reach USD 644.63 billion by 2031.
Which product category is growing fastest?
Accessories such as handbags and small leather goods are expected to post a 7.12% CAGR through 2031, outpacing all other categories.
Why is Asia-Pacific critical for leather brands?
The region contributes 39.52% of global revenue in 2025, driven by strong demand in China and expanding middle-class spending across Southeast Asia.
Which distribution channel will see the highest CAGR?
Online retail is projected to grow at 8.87% CAGR as advanced visualization tools and seamless returns encourage consumers to buy leather goods digitally.
Page last updated on:


