Electric Vehicle Test Equipment Market Size and Share
Market Overview
| Study Period | 2019 - 2030 |
|---|---|
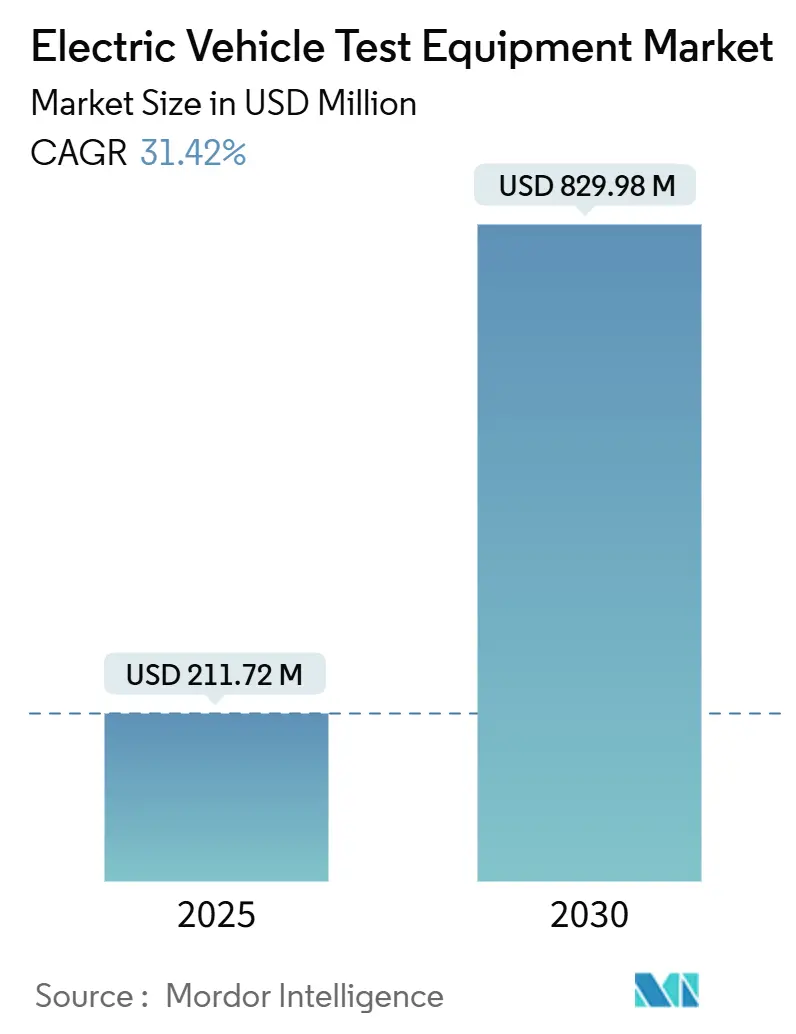
| Market Size (2025) | USD 211.72 Million |
| Market Size (2030) | USD 829.98 Million |
| Growth Rate (2025 - 2030) | 31.42% CAGR |
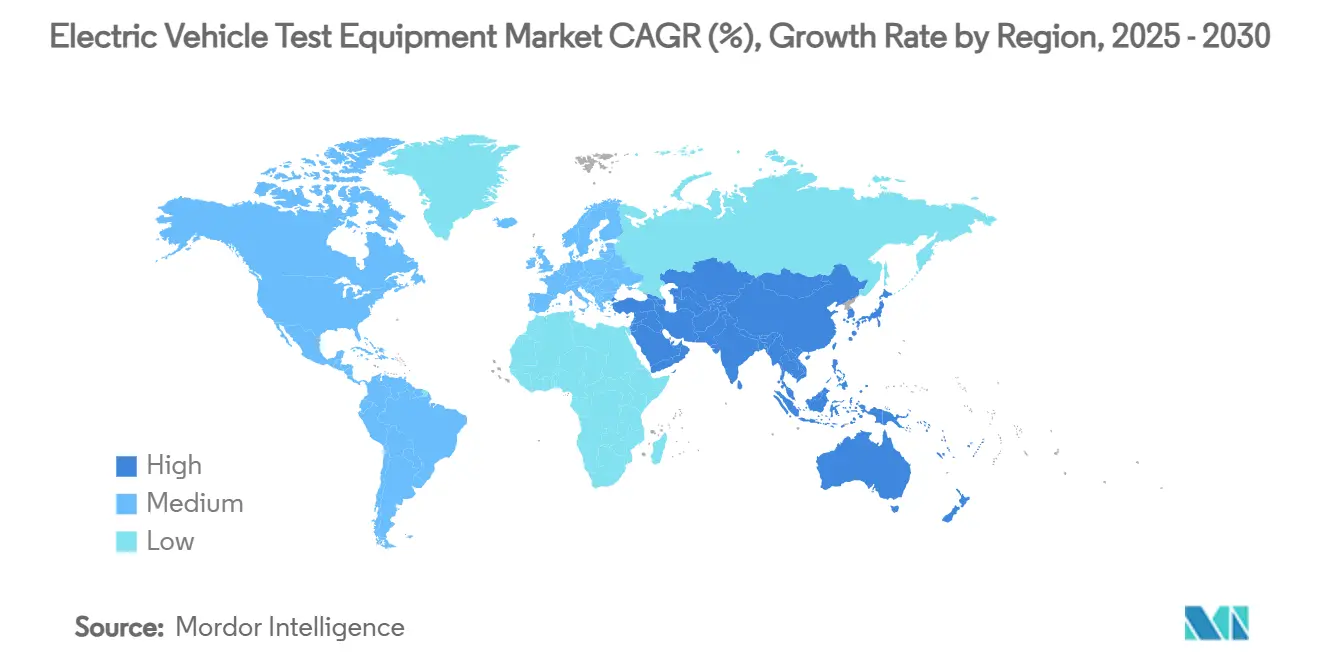
| Fastest Growing Market | Asia-Pacific |
| Largest Market | Asia-Pacific |
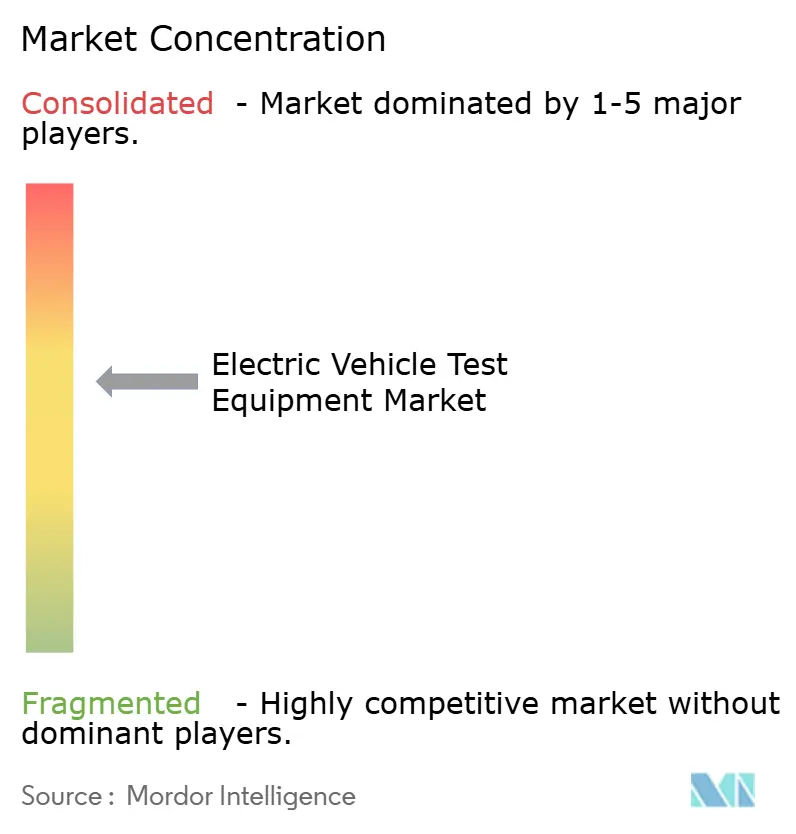
| Market Concentration | Medium |
Major Players
*Disclaimer: Major Players sorted in no particular order Image © Mordor Intelligence. Reuse requires attribution under CC BY 4.0. |
|
Electric Vehicle Test Equipment Market Analysis by Mordor Intelligence
The electric vehicle test equipment market size is valued at USD 211.72 million in 2025 and is projected to reach USD 829.98 million by 2030, translating into a robust 31.42% CAGR over the forecast period. Escalating production volumes, the transition from 400 V to 800 V vehicle architectures, and stringent global compliance deadlines are combining to lift demand for ever-more capable testing platforms. Regulatory deadlines such as UNECE R155/R156 cybersecurity requirements, alongside battery passports mandated in the European Union, continue to tighten validation timetables. In parallel, battery-cell innovation, especially solid-state and high-rate lithium-ion chemistries, has expanded the range of tests that automakers and suppliers must perform before vehicles reach series production. Finally, governments in Asia Pacific, North America, and Europe are channeling billions of dollars into battery mega factories, and a sizeable share of that capital is earmarked for on-site quality-assurance lines that house advanced test benches.
Key Report Takeaways
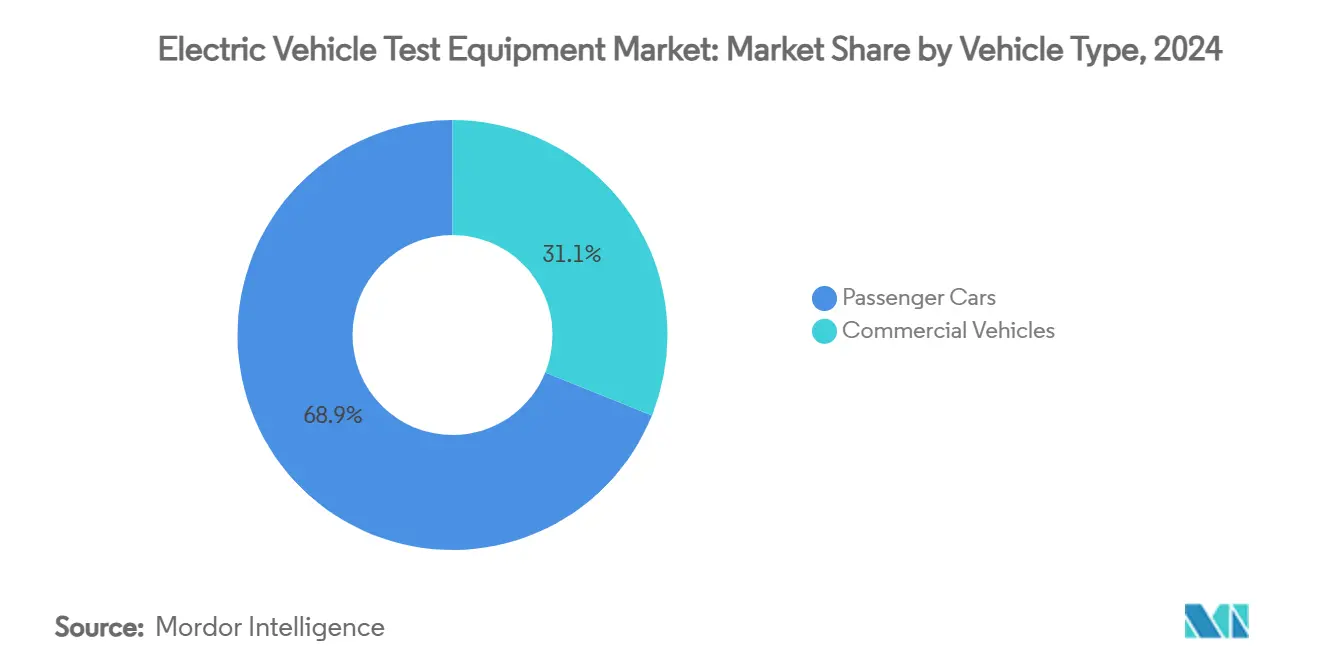
- By vehicle type, passenger cars generated 68.94% of 2024 revenue, whereas commercial vehicles will exhibit the fastest growth at 33.67% CAGR through 2030.
- By propulsion type, battery electric vehicles accounted for 74.66% of 2024 demand, yet fuel-cell electric vehicles are forecast to expand at a 36.22% CAGR to 2030.
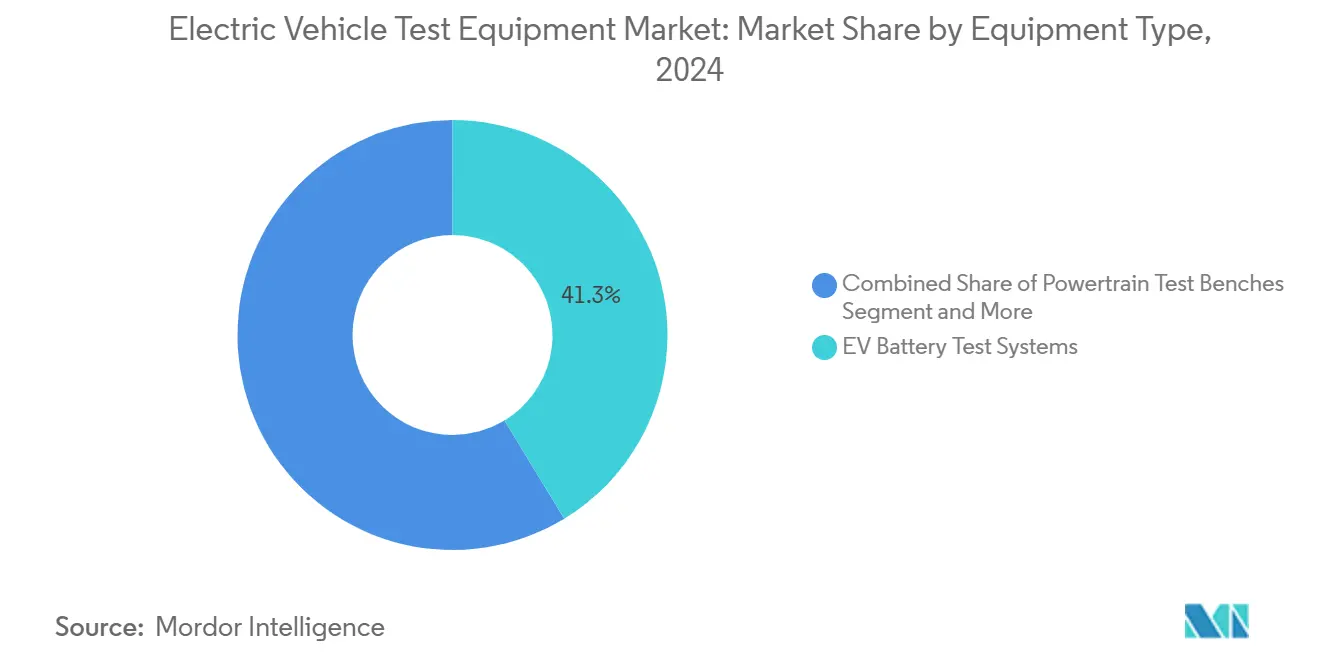
- By equipment type, EV Battery Test Systems held 41.25% of 2024 revenue, while EVSE/Charging Test Systems are advancing at a 35.52% CAGR through 2030.
- By application, OEM end-of-line testing represented 52.36% revenue in 2024; independent and certification laboratories are projected to grow at 33.15% CAGR, the highest among all end users.
- By geography, Asia Pacific commanded 48.33% revenue in 2024; the region is also the fastest growing with a 38.44% CAGR through 2030.
Global Electric Vehicle Test Equipment Market Trends and Insights
Drivers Impact Analysis*
| Driver | (~) % Impact on CAGR Forecast | Geographic Relevance | Impact Timeline |
|---|---|---|---|
| Accelerating Global EV Production & Model Launches | +8.5% | Global (Asia Pacific & Europe lead) | Medium term (2-4 years) |
| Government Funding for Battery Mega Factories Integrating On-site Test Lines | +7.2% | Core Asia Pacific, spill-over North America | Long term (≥ 4 years) |
| OEM Shift from 400 V to 800 V Architectures | +6.1% | Global, premium brands in front | Medium term (2-4 years) |
| Tightening UNECE R155/R156 Cybersecurity-OTA Compliance Deadlines | +5.8% | Europe & North America; Asia Pacific uptake | Short term (≤ 2 years) |
| AI-driven Hardware-in-the-Loop Platforms Cutting Test-cycle Time 40% + | +4.7% | Early adoption in North America & Europe | Short term (≤ 2 years) |
| Growing Battery-as-a-Service Pilots Requiring Rapid Swap-Cycle Protocols | +2.3% | Asia Pacific; pilots in Europe | Long term (≥ 4 years) |
| Source: Mordor Intelligence | |||
Accelerating global EV production & model launches
Full-scale production runs require test capacity that far exceeds prototyping needs. Emerging models now carry larger battery packs and high-frequency power electronics that must pass thermal, EMC, and functional safety checks. Automakers have therefore moved from batch testing to continuous, in-line quality oversight, prompting sizeable orders for modular benches that scale with output. The electric vehicle test equipment market benefits directly because every new vehicle architecture adds new validation steps.
Government funding for battery mega factories integrating on-site test lines
Public incentives are no longer limited to cell manufacturing; most packages mentioned fully equipped validation labs as an eligible cost. Integrated test lines give producers faster feedback loops, which is critical as chemistries evolve. Local sourcing clauses embedded in subsidy schemes are encouraging domestic manufacturers of rigs, cyclers, and HIL controllers to expand capacity, thereby intensifying regional competition.
OEM shift from 400 V to 800 V architectures
Up-rating to 800 V slashes charging times but multiplies voltage stress and fault-current hazards. Conventional 400 V cyclers cannot simply double their output, so most bench owners are phasing in next-generation rigs fitted with higher-rated safety relays, reinforced isolation, and advanced cooling. As old assets are retired, the electric vehicle test equipment market sees a replacement windfall alongside green-field projects.
Tightening UNECE R155/R156 cybersecurity-OTA compliance deadlines
From July 2024, vehicle type approvals in many jurisdictions must prove robust cybersecurity processes and safe software update mechanisms [1]UL, "UNECE Automotive Cybersecurity Compliance Requirements,”ul.com . This has established a new sub-segment of test equipment able to simulate attack vectors, validate over-the-air firmware downloads, and log residual risk. Suppliers that already serve telecom security labs are repurposing their appliances for EV applications, bringing fresh know-how and pricing discipline into the electric vehicle test equipment market.
Restraints Impact Analysis*
| Restraint | (~) % Impact on CAGR Forecast | Geographic Relevance | Impact Timeline |
|---|---|---|---|
| High CAPEX for Multi-domain (Power + RF + EMC) Integrated Benches | -4.2% | Global, sharpest for SMEs | Medium term (2-4 years) |
| Shortage of High-precision HV Sensors Delaying Test-cell Build-outs | -3.1% | Worldwide; acute in Asia Pacific | Short term (≤ 2 years) |
| Fragmented Charging-protocol Standards Inflating Validation Work | -2.8% | Global with regional variants | Long term (≥ 4 years) |
| Rising Cybersecurity Certification Costs for Test Labs | -1.9% | Europe & North America | Medium term (2-4 years) |
| Source: Mordor Intelligence | |||
High CAPEX for multi-domain integrated test benches
Full-spectrum benches that unify power-cycle, RF, and EMC testing save floorspace and labor, yet capital outlays of USD 2–5 million remain beyond the reach of many Tier-2 suppliers [2]“EMI/EMC Compliance Costs in EV Testing,” Tektronix, tek.com. Smaller firms often continue to outsource complex tests, slowing in-house capability expansion and capping short-term equipment sales growth.
Shortage of high-precision HV sensors delaying test-cell build-outs
Demand for 1000 V-rated sensors has soared across renewables, rail traction, and industrial drives, leaving EV-focused integrators competing for the same components. Lead-time extensions of 28–84 weeks disrupt factory start-ups and force some projects to reschedule investment until supply stabilizes, trimming near-term revenue for the electric vehicle test equipment market.
*Our forecasts treat driver/restraint impacts as directional, not additive. The impact forecasts reflect baseline growth, mix effects, and variable interactions.
Segment Analysis
By Vehicle Type: Commercial vehicles drive testing innovation
Passenger cars generated 68.94% of 2024 revenue; however, commercial vehicles are growing at 33.67% CAGR as fleet operators adopt large battery packs and embrace battery-as-a-service models. These duty cycles require 24/7 reliability, pushing test durations to tens of thousands of operational hours. For passenger cars, emphasis remains on range accuracy and consumer-grade charging interoperability, so laboratories continue to favor medium-power rigs with flexible communication-protocol stacks.
Diverging test profiles are prompting vendors to bundle software analytics that segment datasets by use-case, urban stop-and-go versus long-haul, and feed them into predictive-maintenance engines. This capability is especially valued by logistics fleets that cannot tolerate unplanned downtime. Consequently, commercial-vehicle-specific orders account for a rising share of backlogs among the top five suppliers.


By Propulsion Type: Fuel-cell acceleration challenges BEV dominance
Battery Electric Vehicles still captured 74.66% of 2024 demand, but fuel-cell electric vehicles’ 36.22% CAGR means hydrogen-powered platforms are quickly reshaping lab layouts. Facilities must now handle high-pressure gas lines, purge-control logic, and stack-diagnostic algorithms. The electric vehicle test equipment market share for FCEV-focused rigs is projected to climb from 2025’s low-single-digit base into double digits by decade’s end. Solid-state batteries, while still developmental, introduce new safety test conditions such as dendrite-related thermal runaways, requiring calorimetric chambers and X-ray tomography add-ons.
Plug-in hybrids cling to a transitional role; they need dual-mode benches that alternate between internal-combustion and electric operating cycles, stretching test durations. Vendors that offer configurable DC sources alongside exhaust-gas analyzers are therefore winning hybrid programs. Across all propulsion types, end users value unified software dashboards that merge electrical, mechanical, and chemical data into traceable quality records.
By Equipment Type: Charging test systems surge past battery testing
EV Battery Test Systems captured 41.25% of 2024 revenue, yet charging test systems are advancing at 35.52% CAGR as nations accelerate fast-charger rollouts. The electric vehicle test equipment market size for charger-interoperability platforms is set to triple between 2025 and 2030, driven by protocol diversity. Modern benches cycle seamlessly across CCS, CHAdeMO, and GB/T, and many include vehicle-to-grid test modes that assess reverse-power flow.
Component-level rigs for inverters, BMS, and DC-DC converters remain a steady business, but profit margins are narrowing because of commoditization. Suppliers are now embedding digital twins into their offers, permitting off-line scenario exploration before hardware arrives. Powertrain benches targeting integrated e-axles have grown popular among start-ups championing skateboard chassis designs, further widening the addressable base of the electric vehicle test equipment market.

By Application: Independent labs gain testing market share
OEM end-of-line stations retained 52.36% revenue in 2024, yet growth momentum lies with independent and certification laboratories expanding 33.15% CAGR. Many new entrants lack capital for comprehensive in-house validation, preferring to book block hours at accredited facilities. Independent labs, in turn, specialize in cybersecurity audits and UNECE type-approval dossiers, enlarging their service scope. For suppliers of benches, this client group demands mobile rigs that can relocate quickly as contracts shift, an angle that manufacturers are leveraging to differentiate.
Component suppliers, especially those making wide-bandgap power modules, continue to procure high-frequency switching analyzers to shorten design cycles. The electric vehicle test equipment market is therefore bifurcating: one track toward permanently installed high-throughput lines, the other toward portable systems that maximize asset utilization across multiple paying customers.
Geography Analysis
Asia Pacific held 48.33% of the electric vehicle test equipment market share in 2024 and is projected to grow at a 38.44% CAGR through 2030. China’s March 2025 battery-safety standard and USD 844 million in solid-state R&D funding fuel bulk purchases of cyclers, impedance spectrometers, and abuse-test chambers. Japanese subsidies worth USD 2.4 billion reimburse factories for on-site validation benches, while South Korea’s USD 10.9 billion parts-sector program finances 800 V hardware-in-the-loop systems. These national schemes collectively anchor the region as the largest buying center for the electric vehicle test equipment market, with purchases spanning cell, module, and pack-level rigs. Suppliers that offer modular racks and local after-sales support are winning multi-plant contracts across the region.
North America ranks second by revenue and is buoyed by the Inflation Reduction Act’s USD 370 billion clean-tech pool, plus a USD 140 billion pipeline of EV projects running to 2028. Bench buyers prefer AI-enhanced platforms that compress calibration loops, mirroring local software expertise. Canada’s battery corridor adds demand for climatic chambers able to reproduce sub-zero duty cycles, expanding the regional order book. Europe sits third but leads in compliance workloads as UNECE R155/R156 and the 2027 EU battery-passport mandate push labs to deploy cybersecurity penetration rigs and full-traceability software. German integrators export turnkey battery labs across the bloc, while French and Italian suppliers roll out cloud archives for immutable end-of-test certificates.
South America and the Middle East & Africa remain early-stage adopters with emerging policy frameworks. Brazil’s federal EV credit program and Saudi Arabia’s local e-mobility assembly incentives hint at future demand, yet procurement cycles trail the major regions by at least two years. Laboratories here are expected to start with mid-range 400/800 V benches and scale toward megawatt-class rigs as standards and infrastructure mature.

Competitive Landscape
The electric vehicle test equipment market remains moderately fragmented, with technology leaders deepening capabilities via mergers, partnerships, and in-house R&D. Keysight Technologies agreed to acquire Spirent Communications for USD 1.46 billion, aiming to fold network-security know-how into power-test portfolios [3]“Keysight to Acquire Spirent Communications,” Keysight Technologies, keysight.com. AVL List GmbH channels roughly 11% of its yearly turnover into R&D and recently released CAMEO 5™ and PUMA 2™ machine-learning engines that trim calibration loops by 40%. Rohde & Schwarz partnered with Analog Devices to commercialize a wireless BMS validation platform, uniting RF, power-cycle, and functional-safety tests in a single rack.
Strategic moves reflect three core themes. First, vendors are embedding AI to automate test-point selection, shrinking program timelines. Second, modular rack chassis allow customers to swap 400 V modules for 800 V blocks without a full rebuild. Third, cybersecurity test libraries are being baked directly into power benches so users can execute UNECE threat scenarios alongside electrical cycling.
Regional specialists in China, Japan, and South Korea are capitalizing on domestic-content rules to win factory-floor contracts. European service providers differentiate with bundled accreditation audits and data-retention cloud stacks. North American start-ups emphasize software-defined instruments that update firmware online, ensuring benches stay current with evolving standards.
Electric Vehicle Test Equipment Industry Leaders
-
Keyinsight Technologies, Inc.
-
National Instruments Corporation
-
Horiba Ltd.
-
AVL List GmbH
-
Chroma ATE Inc.
- *Disclaimer: Major Players sorted in no particular order

Recent Industry Developments
- April 2025: Comemso launched a calibration tool for EV chargers that cuts field-service time by 30%.
- December 2024: Chroma ATE rolled out a one-stop battery cell charge/discharge system, and its SoC/Analog Test System 3650-S2 secured the 2025 Taiwan Excellence Award.
- December 2024: Emerson invested in EecoMobility, an AI-powered battery-testing start-up specializing in defect prediction.


Global Electric Vehicle Test Equipment Market Report Scope
Electric vehicle test equipment evaluates crucial components of electric vehicles (EVs), such as batteries and motors, ensuring peak performance of all integrated parts. This suite of Electric Vehicle (EV) test equipment and software includes tools designed to test various systems. These systems encompass battery modules, packs, electric powertrains, DC fast charging systems, and power electronics.
The electric vehicle test equipment market is segmented by vehicle type, propulsion type, equipment type, and geography. By vehicle type, the market is segmented into passenger cars and commercial vehicles. By propulsion type, the market is segmented into battery electric vehicles (BEVs), plug-in hybrid electric vehicles (PHEVs), hybrid electric vehicles (HEVs), and fuel cell electric vehicles (FCEVs). By equipment type, the market is segmented into electric vehicle (EV) battery test systems, powertrain testing, electric vehicle (EV) component, electric vehicle (EV) charging, and others (EV drivetrain test). By geography, the market is segmented into North America, Europe, Asia-Pacific, and Rest of the World.
The report offers market size and forecasts in value (USD) for all the above segments.
| Passenger Cars |
| Commercial Vehicles |
| Battery Electric Vehicles (BEVs) |
| Plug-In Hybrid Electric Vehicles (PHEVs) |
| Hybrid Electric Vehicles (HEVs) |
| Fuel-Cell Electric Vehicles (FCEVs) |
| EV Battery Test Systems |
| Powertrain Test Benches |
| Component-level Test Rigs (inverter, BMS, DC-DC) |
| EVSE / Charging Test Systems |
| Drivetrain & NVH Test Systems |
| OEM End-of-Line |
| Tier-1 / Tier-2 Component Suppliers |
| Independent & Certification Laboratories |
| North America | United States |
| Canada | |
| Rest of North America | |
| South America | Brazil |
| Argentina | |
| Rest of South America | |
| Europe | Germany |
| United Kingdom | |
| France | |
| Italy | |
| Spain | |
| Rest of Europe | |
| Asia Pacific | China |
| Japan | |
| India | |
| South Korea | |
| Rest of Asia Pacific | |
| Middle East and Africa | Saudi Arabia |
| United Arab Emirates | |
| Egypt | |
| Turkey | |
| South Africa | |
| Rest of Middle East and Africa |
| By Vehicle Type | Passenger Cars | |
| Commercial Vehicles | ||
| By Propulsion Type | Battery Electric Vehicles (BEVs) | |
| Plug-In Hybrid Electric Vehicles (PHEVs) | ||
| Hybrid Electric Vehicles (HEVs) | ||
| Fuel-Cell Electric Vehicles (FCEVs) | ||
| By Equipment Type | EV Battery Test Systems | |
| Powertrain Test Benches | ||
| Component-level Test Rigs (inverter, BMS, DC-DC) | ||
| EVSE / Charging Test Systems | ||
| Drivetrain & NVH Test Systems | ||
| By Application | OEM End-of-Line | |
| Tier-1 / Tier-2 Component Suppliers | ||
| Independent & Certification Laboratories | ||
| By Geography | North America | United States |
| Canada | ||
| Rest of North America | ||
| South America | Brazil | |
| Argentina | ||
| Rest of South America | ||
| Europe | Germany | |
| United Kingdom | ||
| France | ||
| Italy | ||
| Spain | ||
| Rest of Europe | ||
| Asia Pacific | China | |
| Japan | ||
| India | ||
| South Korea | ||
| Rest of Asia Pacific | ||
| Middle East and Africa | Saudi Arabia | |
| United Arab Emirates | ||
| Egypt | ||
| Turkey | ||
| South Africa | ||
| Rest of Middle East and Africa | ||


Key Questions Answered in the Report
What is the current size of the electric vehicle test equipment market?
The market stands at USD 211.72 million in 2025 and is forecast to reach USD 829.98 million by 2030, driven by rising EV production and regulatory compliance needs.
Which region leads the electric vehicle test equipment market?
Asia Pacific holds the largest share at 48.33% in 2024 and posts the fastest growth, with a 38.44% CAGR projected through 2030.
Why are charging test systems growing faster than battery test systems?
Fast-charging rollouts and multiple global protocol standards are pushing laboratories to invest in flexible charger-interoperability rigs, resulting in a 35.52% CAGR for charging test platforms.
How do UNECE R155/R156 regulations influence test equipment demand?
They require mandatory cybersecurity and OTA-update validation, spurring purchases of benches that can simulate threat vectors and confirm secure software delivery.
Page last updated on:


