Genomics In Cancer Care Market Size and Share
Market Overview
| Study Period | 2020 - 2031 |
|---|---|
| Forecast Data Period | 2026 - 2031 |
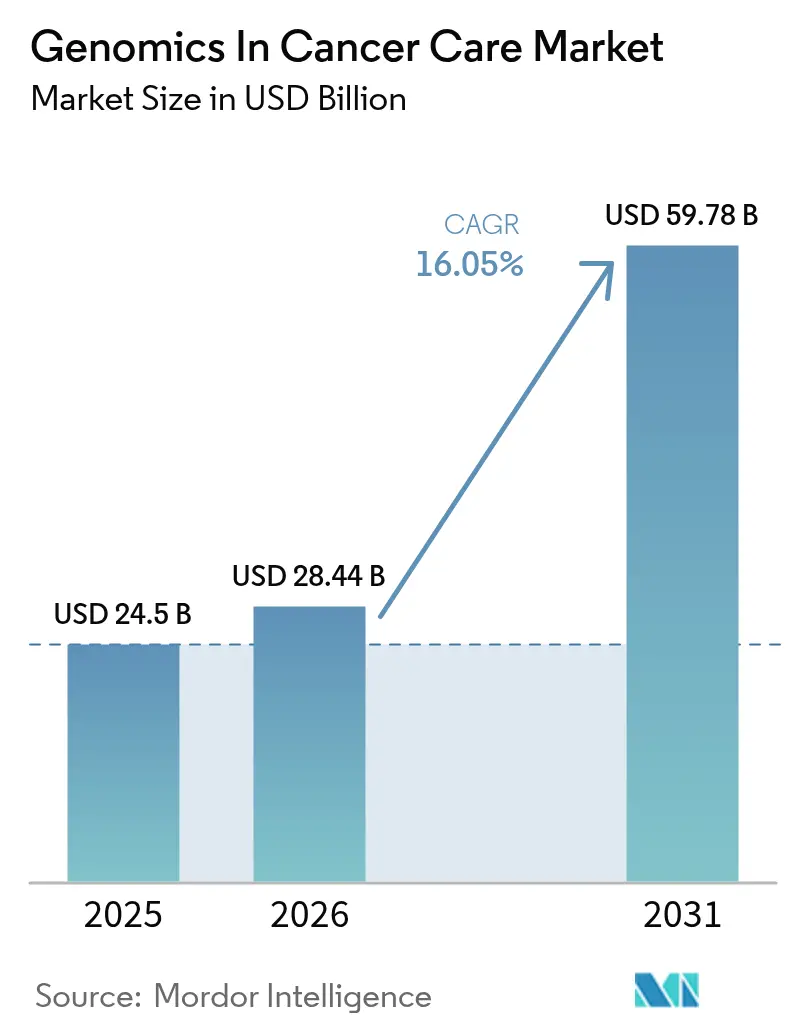
| Market Size (2026) | USD 28.44 Billion |
| Market Size (2031) | USD 59.78 Billion |
| Growth Rate (2026 - 2031) | 16.05% CAGR |
| Fastest Growing Market | Asia Pacific |
| Largest Market | North America |
Major Players
*Disclaimer: Major Players sorted in no particular order Image © Mordor Intelligence. Reuse requires attribution under CC BY 4.0. |
|
Genomics In Cancer Care Market Analysis by Mordor Intelligence
Genomics in the cancer care market size in 2026 is estimated at USD 28.44 billion, growing from 2025 value of USD 24.5 billion with 2031 projections showing USD 59.78 billion, growing at 16.05% CAGR over 2026-2031. The surge reflects sustained technology innovation, harmonized regulation, and expanding clinical validation that make genomic testing central to precision oncology. Broader Medicare reimbursement for liquid biopsy, falling sequencing costs that bring whole-genome testing close to the USD 100 threshold, and rapid integration of artificial-intelligence decision tools are reshaping therapeutic strategies toward proactive, molecularly guided care. Competitive intensity accelerates as platform vendors converge with analytics specialists, and as single-molecule, real-time sequencing begins to erode short-read NGS dominance. Together, these dynamics reinforce a structural transition from one-off diagnostic assays to longitudinal, data-rich solutions that inform every stage of the oncology journey.
Key Report Takeaways
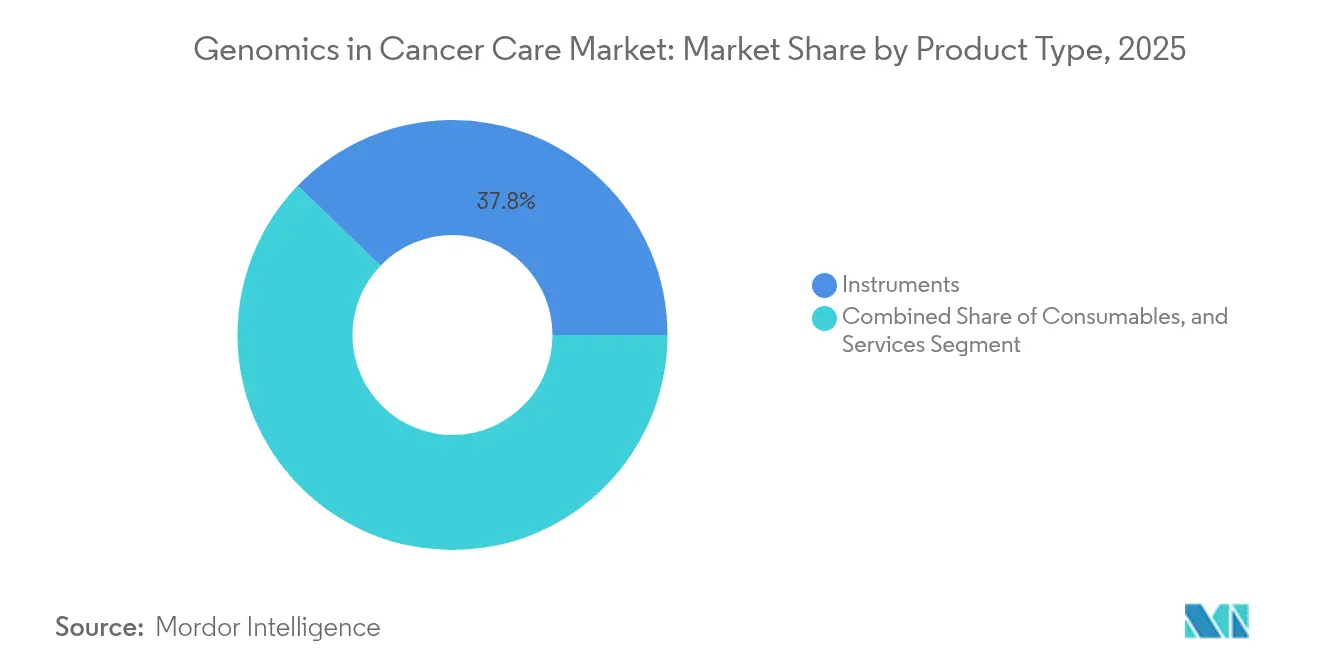
- By product type, instruments led with 37.80% revenue share in 2025, while services are projected to grow at an 18.35% CAGR through 2031.
- By technology, genome sequencing commanded 45.70% of the genomics in cancer care market share in 2025, and single-molecule real-time sequencing is advancing at a 22.85% CAGR to 2031.
- By application, diagnostics held 52.00% of the genomics in cancer care market size in 2025; minimal-residual-disease monitoring and liquid biopsy is expanding at a 20.65% CAGR.
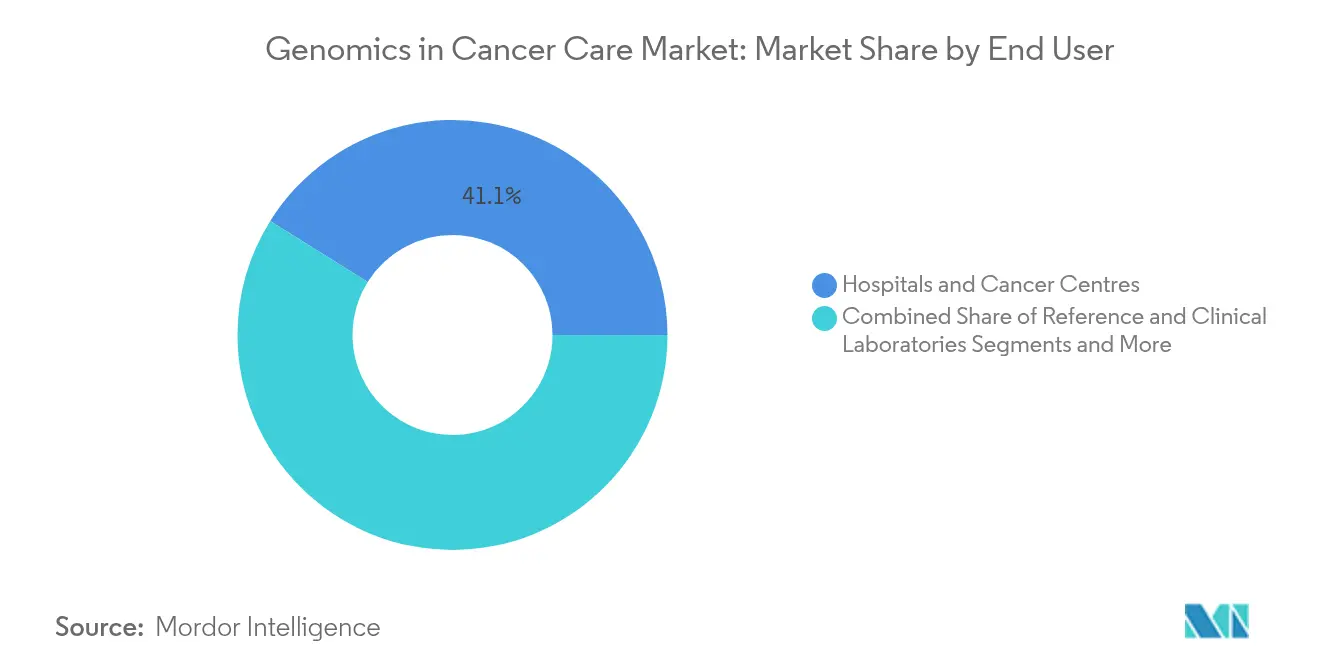
- By end-user, hospitals and cancer centers accounted for 41.10% of the genomics in cancer care market size in 2025, while reference and clinical laboratories are rising at a 17.35% CAGR.
- By geography, North America contributed 36.60% market share in 2025, and Asia-Pacific posted the fastest regional CAGR at 14.55%.
Note: Market size and forecast figures in this report are generated using Mordor Intelligence’s proprietary estimation framework, updated with the latest available data and insights as of 2026.
Global Genomics In Cancer Care Market Trends and Insights
Drivers Impact Analysis*
| Driver | (~) % Impact on CAGR Forecast | Geographic Relevance | Impact Timeline |
|---|---|---|---|
| Growing burden of cancer & earlier screening | +3.20% | Global, concentrated in North America & Europe | Medium term (2-4 years) |
| Increasing adoption of NGS-based CGP | +4.10% | North America & EU, expanding to Asia-Pacific | Short term (≤ 2 years) |
| Rapid sequencing and digital-PCR cost decline | +2.80% | Global, accelerated in emerging markets | Long term (≥ 4 years) |
| Scaling liquid-biopsy MRD pipelines | +3.50% | North America & EU, early expansion in Asia-Pacific | Medium term (2-4 years) |
| AI-powered multi-omic decision tools | +1.90% | North America & EU, limited penetration in emerging markets | Long term (≥ 4 years) |
| Rise of reimbursement for tumor-agnostic CDx | +2.40% | North America & EU, gradual adoption in Asia-Pacific | Medium term (2-4 years) |
| Source: Mordor Intelligence | |||
Growing Burden of Cancer & Earlier Screening Programs
Robust growth in global cancer incidence is compelling health-system planners to shift resources toward preventive genomic screening. Latin America alone projects a 66% rise in cancer cases by 2040, intensifying pressure to catch malignancies at sub-clinical stages. U.S. agencies embraced blood-based detection when the FDA cleared Guardant Health’s Shield test for colorectal screening in adults aged 45 and older, setting a precedent for non-invasive assays.[1]U.S. Food and Drug Administration, “FDA Takes Action to Ensure Safety and Effectiveness of Laboratory Developed Tests,” fda.gov Large population trials such as the National Cancer Institute’s Vanguard study employ the same platform to test multi-cancer detection across diverse cohorts. These developments create long-term reimbursement pathways, foster payer confidence, and bolster recurring revenue streams for test developers while lowering downstream treatment costs.
Increasing Adoption Of NGS-Based Comprehensive Genomic Profiling
Oncology practices are migrating from sequential single-gene tests toward expansive panels that interrogate hundreds of loci in one run. Evidence from the GOZILA trial showed patients guided by the Guardant360 CDx liquid biopsy achieved a median overall survival of 18.6 months compared with 9.9 months under standard care. Illumina’s TruSight Oncology Comprehensive became the first FDA-cleared kit with pan-cancer companion-diagnostic claims.[2]Illumina, Inc. "FDA Approves Next-Generation Cancer Biomarker Test and Companion Diagnostics." MyADLM, November 1, 2024. Coupled with AI analytics, laboratories now deliver clinically actionable reports within days, and U.S. Medicare increasingly reimburses broad panels over iterative assays, accelerating mainstream uptake.
Rapid Cost Decline of Sequencing & Digital PCR Reagents
PacBio’s SPRQ chemistry for Revio systems cut HiFi whole-genome sequencing costs below USD 500 while preserving accuracy. The University of Minnesota Genomics Center reported an additional 20% drop after adopting AVITI technology, surpassing Illumina NovaSeq X Plus on cost-per-gigabase metrics. Roche’s sequencing-by-expansion prototypes promise throughput capable of seven 30× human genomes per hour. These breakthroughs help institutions in emerging economies overcome budget barriers and lay the groundwork for point-of-care genomic testing models.
Scaling Liquid-Biopsy Pipelines for Minimal-Residual-Disease (MRD) Monitoring
Exact Sciences’ OncoDetect test identifies colorectal-cancer recurrence up to two years earlier than imaging by scanning 200 ctDNA variants. A 2,000-patient colon-cancer study showed 62.6% of ctDNA-positive cases relapsed within three years versus 15.4% of ctDNA-negative cases, reinforcing MRD’s prognostic power. The FDA guidance on ctDNA endpoints sponsors use liquid biopsy for accelerated approval pathways.[3]Food and Drug Administration. "Medical Devices; Laboratory Developed Tests." Federal Register, May 6, 2024. With CMS covering Guardant Reveal in postoperative surveillance, economic and regulatory alignment is propelling wide adoption.
Restraints Impact Analysis*
| Restraint | (~) % Impact on CAGR Forecast | Geographic Relevance | Impact Timeline |
|---|---|---|---|
| Shortage Of Accredited Molecular Pathologists | -2.10% | Global, with acute shortages in emerging markets | Long term (≥ 4 years) |
| Persistently High Total-Cost-Of-Ownership For WGS Platforms | -1.80% | Global, with disproportionate impact on emerging markets | Medium term (2-4 years) |
| Cyber-Security & Genomic-Data-Sovereignty Regulation | -1.30% | North America & EU core, expanding to APAC | Medium term (2-4 years) |
| Limited Clinical-Utility Evidence For Emerging MRD Assays | -0.90% | Global, with regulatory focus in North America & EU | Short term (≤ 2 years) |
| Source: Mordor Intelligence | |||
Shortage Of Accredited Molecular Pathologists
Worldwide demand for professionals who can translate multi-omic data into clinical action far exceeds supply. Training requirements encompass molecular biology, bioinformatics, and oncology subspecialties, competencies that extend beyond legacy pathology curricula. Emerging economies face added challenges as talent migrates to higher-income regions. AI tools lighten routine interpretation workloads, yet regulations still require board-certified oversight for final sign-off. Fast-track certification programs are under development, but workforce expansion will lag market growth for several years.
Persistently High Total-Cost-Of-Ownership for WGS Platforms
While reagent costs keep falling, capital outlays for high-throughput sequencers, environmental controls, secure data storage, and specialized staffing remain steep. Mid-sized hospitals in emerging economies must often send samples to external reference labs, slowing turnaround and limiting the accrual of in-house expertise. Cloud bioinformatics services reduce hardware needs, but data-sovereignty rules and cybersecurity obligations raise separate compliance expenses. Sequencing-as-a-service models continue to mature, yet have not fully resolved budget constraints.
*Our forecasts treat driver/restraint impacts as directional, not additive. The impact forecasts reflect baseline growth, mix effects, and variable interactions.
Segment Analysis
By Product Type: Services Drive Growth Despite Instruments Dominance
Instruments represented the largest revenue pool, holding 37.80% share of the genomics in the cancer care market in 2025. Demand reflected ongoing platform refresh cycles as users swapped legacy sequencers for higher-throughput, longer-read systems. Consumables sales expanded in line with test-volume growth, while point-of-care cartridges opened new, decentralized channels.
Services are accelerating at an 18.35% CAGR, underscoring a shift toward data interpretation, cloud analytics, and integrated clinical reporting. Guardant Health’s 31% revenue jump to USD 737 million during 2024 shows the pull of recurring testing and bioinformatics fees. Hospitals increasingly outsource bioinformatics to mitigate staffing shortages, and bundled, end-to-end service contracts now cover sample logistics, sequencing, interpretation, and decision-support updates. This evolution positions service providers as strategic partners rather than transactional suppliers within the genomics in cancer care market.


By Technology: Single-Molecule Sequencing Disrupts NGS Dominance
Genome sequencing platforms based on short-read NGS secured 45.70% market share in 2025, supported by established laboratory workflows and extensive clinical evidence. Yet single-molecule, real-time sequencing is expanding at a startling 22.85% CAGR as oncologists seek structural-variant resolution in repeat-rich regions and methylation layers unavailable from short reads.
Oxford Nanopore’s latest chemistry generated complete chromosome assemblies and simultaneous epigenetic maps, demonstrating the clinical readiness of long-read approaches. Meanwhile, Roche’s sequencing-by-expansion prototypes promise to merge long reads with high throughput, threatening to redraw product-replacement cycles. PCR-based kits retain value for low-plex companion diagnostics and rapid EGFR or KRAS checks, yet microarrays are ceding ground as sequencing prices near parity. Technology diversity ensures that laboratories can align platform choice with specific oncology use cases inside the genomics in cancer care market.
By Application: MRD Monitoring Accelerates Beyond Diagnostics
Diagnostics maintained 52.00% of the genomics in the cancer care market size in 2025 through entrenched companion-diagnostic pathways and payer familiarization. Routine EGFR, BRAF, and PIK3CA panels anchor laboratory revenue streams.
Minimal-residual-disease and liquid-biopsy assays, growing at a 20.65% CAGR, are redefining follow-up protocols. The SERENA-6 trials verified that ctDNA-guided treatment switches halve the progression risk for ER-positive breast-cancer patients with emergent ESR1 mutations. Pharma sponsors now embed MRD endpoints in adjuvant-therapy trials, which reinforce assay volumes post-approval. Drug-discovery genomics and precision-oncology decision platforms further enlarge the pipeline, supplying biomarker insights during early clinical development and supporting adaptive trial designs.
By End-user: Reference Labs Gain Share Through Specialized Capabilities
Hospitals and cancer centers generated 41.10% of 2025 revenue, leveraging on-site pathology and integrated care teams to run high-throughput panels for newly diagnosed patients. Yet reference and clinical laboratories exhibit the fastest momentum at 17.35% CAGR, bolstered by economies of scale and capital-intensive automation that lower per-sample costs.
Labcorp’s partnership with Ultima Genomics to expand whole-genome offerings and to launch Plasma Detect ctDNA MRD illustrates reference labs’ strategic positioning. Pharmaceutical and biotech firms intensify demand for high-complexity assays to stratify trial subjects, while academic institutes pilot novel technologies before broader rollout. Together, these segments create a complementary ecosystem in which centralized expertise coexists with bedside sequencing in the genomics market for cancer care.
Geography Analysis
North America led with 36.60% market share in 2025, supported by broad payer coverage, a mature clinical-trial network, and stringent but predictable regulatory oversight. The FDA’s May 2024 Laboratory Developed Tests final rule aligned quality requirements across commercial and academic laboratories. Parallel Medicare decisions extended reimbursement to liquid-biopsy-based MRD surveillance, unlocking sizable, recurring test volumes. Cross-industry collaborations ensure rapid migration of research innovations into front-line clinical practice, consolidating the region’s leadership in the genomics in cancer care market.
Asia Pacific records the fastest regional CAGR at 14.55% to 2031. National genome programs in China, Japan, Singapore, and the United Arab Emirates underpin large-scale sequencing infrastructure and create fertile ground for early screening pilots. Ongoing investment in Saudi Arabia’s precision-medicine corridor, combined with streamlined regulatory pathways in the United Arab Emirates, attracts multinational diagnostics firms to establish regional hubs. Rising cancer incidence and widening insurance coverage accelerate demand, while local manufacturing partnerships drive down consumables’ costs, improving accessibility.
Europe remains a critical pillar of global adoption through coordinated regulatory and value-assessment frameworks. The European Commission’s conditional approval of Illumina’s divestment plan for GRAIL removed a legal logjam, restoring competitive balance and allowing pan-European multi-cancer screening pilots to proceed. Meanwhile, the EU In Vitro Diagnostic Regulation enforces stringent clinical-evidence requirements, boosting confidence among physicians and payers. Standard-setting bodies such as the European Liquid Biopsy Society publish harmonized protocols that foster reproducibility across laboratories. In combination, these measures sustain healthy growth despite mature infrastructure.


Competitive Landscape
The genomics in the cancer care market is moderately consolidated. Illumina, Thermo Fisher Scientific, and Roche hold multi-platform portfolios that span instruments, consumables, and software, granting them pricing leverage and global distribution reach. Specialized providers such as Guardant Health and Exact Sciences outpace the field in liquid-biopsy and MRD niches, leveraging protected assay patents and large proprietary datasets.
Mergers and acquisitions intensified in 2024–2025 as incumbents sought AI analytics, multi-omic fusion capabilities, and regional market entry.
Examples include Guardant Health’s agreement with Pfizer to co-develop therapy-linked diagnostics and PacBio’s release of the benchtop Vega system aimed at decentralizing HiFi sequencing. Litigation has also emerged as a competitive instrument; Guardant filed suit against Tempus AI alleging infringement of DNA-testing patents.
Players are now prioritizing vertical integration, pairing wet-lab kits with real-time analytics delivered through cloud dashboards. Intellectual-property filings concentrate on chemistry that improves read accuracy and on machine-learning pipelines that cut interpretation time. Emerging white spaces include point-of-care sequencing for community oncology clinics, AI-driven molecular tumor boards, and turnkey solutions tailored to low-resource settings.
Genomics In Cancer Care Industry Leaders
-
Agilent Technologies
-
Illumina, Inc.
-
Pacific Biosciences, Inc.
-
ThermoFisher Scientific Inc.
-
Intrexon Bioinformatics Germany GmbH
- *Disclaimer: Major Players sorted in no particular order

Recent Industry Developments
- May 2025: Guardant Health introduced Guardant360 Tissue, a multi-omic tissue profile that delivers results in under two weeks and uses 40% less material than conventional workflows.
- April 2025: Exact Sciences released the OncoDetect MRD assay, which detects up to 200 ctDNA variants and flags recurrence up to two years earlier than imaging.
- April 2025: Exact Sciences released the OncoDetect MRD assay, which detects up to 200 ctDNA variants and flags recurrence up to two years earlier than imaging.
- January 2025: Guardant Health and ConcertAI launched the first data-as-a-service platform integrating 5.5 million clinical records with tumor-profiling data across more than 60 cancer types.
- November 2024: PacBio unveiled the benchtop Vega system, extending HiFi sequencing to smaller laboratories.


Research Methodology Framework and Report Scope
Market Definitions and Key Coverage
Our study, according to Mordor Intelligence, defines the genomics in cancer care market as all revenue generated when DNA, RNA, or epigenetic information is processed, interpreted, and clinically applied to diagnose, monitor, or treat human tumors through instruments, consumables, and software-enabled services. Revenue channels include sequencing systems, PCR and microarrays, reagent kits, data-analysis pipelines, and service fees paid by hospitals, reference laboratories, and oncology centers worldwide.
Scope Exclusion: Animal genomics, hereditary screening unrelated to cancer, and pure research consumables sold outside translational or clinical oncology settings are excluded from our baseline.
Segmentation Overview
-
By Product Type
- Instruments
- Consumables
- Services
-
By Technology
- Genome Sequencing
- PCR
- Microarrays &
- Others
-
By Application
- Diagnostics
- Drug Discovery & Clinical Trials Genomics
- Personalized / Precision Oncology
- Others
-
By End-user
- Hospitals & Cancer Centres
- Reference & Clinical Laboratories
- Pharmaceutical & Biotech Companies
- Academic & Research Institutes
-
By Geography
-
North America
- United States
- Canada
- Mexico
-
Europe
- Germany
- United Kingdom
- France
- Italy
- Spain
- Rest of Europe
-
Asia Pacific
- China
- Japan
- India
- South Korea
- Australia
- Rest of Asia Pacific
-
Middle East and Africa
- GCC
- South Africa
- Rest of Middle East and Africa
-
South America
- Brazil
- Argentina
- Rest of South America
-
North America
Detailed Research Methodology and Data Validation
Desk Research
We began by mapping demand using open assets such as IARC GLOBOCAN incidence files, SEER survival tables, Eurostat procedure volumes, and national reimbursement schedules, which show how many patients are eligible and funded for genomic testing. Trade bodies like the American Clinical Laboratory Association and the Global Alliance for Genomics and Health, along with country sequencing initiatives, reveal installed instrument bases and cost trajectories. Annual reports, 10-Ks, and oncology conference abstracts enriched price and pipeline insights.
Our team then tapped paid resources, D&B Hoovers for company splits, Dow Jones Factiva for deal flow, and Questel for patent velocity, to track technology diffusion, while Volza shipment logs and UN Comtrade tariffs clarified regional supply shifts and average selling prices. The sources listed are illustrative; many additional public and proprietary references informed data checks throughout the build.
Primary Research
We spoke with molecular pathologists, lab managers, platform distributors, and payer policy advisors across North America, Europe, East Asia, and the Gulf, gathering test-volume growth, price concessions, and reimbursement timelines that reconciled desk findings on liquid-biopsy and minimal-residual-disease panels. These conversations anchored assumption ranges and validated emerging adoption curves.
Market-Sizing & Forecasting
A top-down model, anchored on cancer incidence and guideline-recommended genomic-test penetration, sizes the addressable pool and multiplies it by verified average selling prices. Bottom-up cross-checks sampled instrument deliveries, reagent pull-through ratios, and channel audits adjust totals until variance falls within an acceptable range. Key variables include sequencing cost per genome, accredited lab counts, share of metastatic patients receiving biomarker-matched therapy, installed NGS throughput, and payer-coverage expansion events. Multivariate regression projects each driver through the forecast period, capturing shifts in cost curves and clinical adoption. Forecast gaps for nations lacking device data are bridged with region-specific incidence elasticity factors agreed in expert calls, before currency harmonization to constant values.
Data Validation & Update Cycle
Every draft passes anomaly screening, peer review, and senior sign-off. If material regulatory or M&A news emerges, we reopen the file immediately. Otherwise, reports refresh annually, and a pre-delivery pass ensures clients receive the latest vetted baseline.
Why Mordor's Genomics in Cancer Care Baseline Remains the Go-To Reference
Estimates published by different firms often diverge because product mixes, patient cohorts, and refresh cadences vary widely. Mordor Intelligence fixes scope to clinical oncology testing revenue, keeps currency constant, and applies transparent driver forecasts, whereas others may fold in research kits, treat reimbursement as static, or extrapolate single-country data globally.
Benchmark comparison
| Market Size | Anonymized source | Primary gap driver |
|---|---|---|
| USD 21.07 B (2024) | Mordor Intelligence | - |
| USD 20.93 B (2024) | Global Consultancy A | Includes research-only reagent sales, lower currency-normalization frequency |
| USD 46.60 B (2024) | Trade Journal B | Counts all-disease sequencing instruments, no penetration adjustment |
| USD 19.08 B (2023) | Industry Association C | Uses pre-COVID growth curve and hospital-only lab scope |
The comparison shows that scope definition and driver rigor, rather than headline CAGR, explain most gaps. Because our analysts triangulate real test volumes with price erosion and frequent refreshes, Mordor's figures provide a balanced, defensible baseline for decision-makers.


Key Questions Answered in the Report
What is the current size of the genomics in cancer care market?
The market generated USD 28.44 billion in revenue in 2026 and is projected to grow to USD 59.78 billion by 2031.
Which region leads in market share?
North America contributed 36.60% of global revenue in 2025, buoyed by extensive reimbursement coverage and clear regulatory pathways.
Which product segment is expanding fastest?
Service-based offerings that bundle sequencing, analysis, and reporting are advancing at an 18.35% CAGR through 2031.
Why is single-molecule sequencing gaining traction?
Long-read platforms resolve structural variants and methylation patterns that standard NGS can miss, fueling a 22.85% CAGR in this technology segment.
How are liquid biopsies changing cancer management?
Circulating-tumor-DNA assays enable minimal-residual-disease monitoring, helping detect relapse up to two years earlier than imaging while supporting therapy adjustments in real time.
Page last updated on:


