Global Transcriptomics Market Size and Share
Market Overview
| Study Period | 2020 - 2031 |
|---|---|
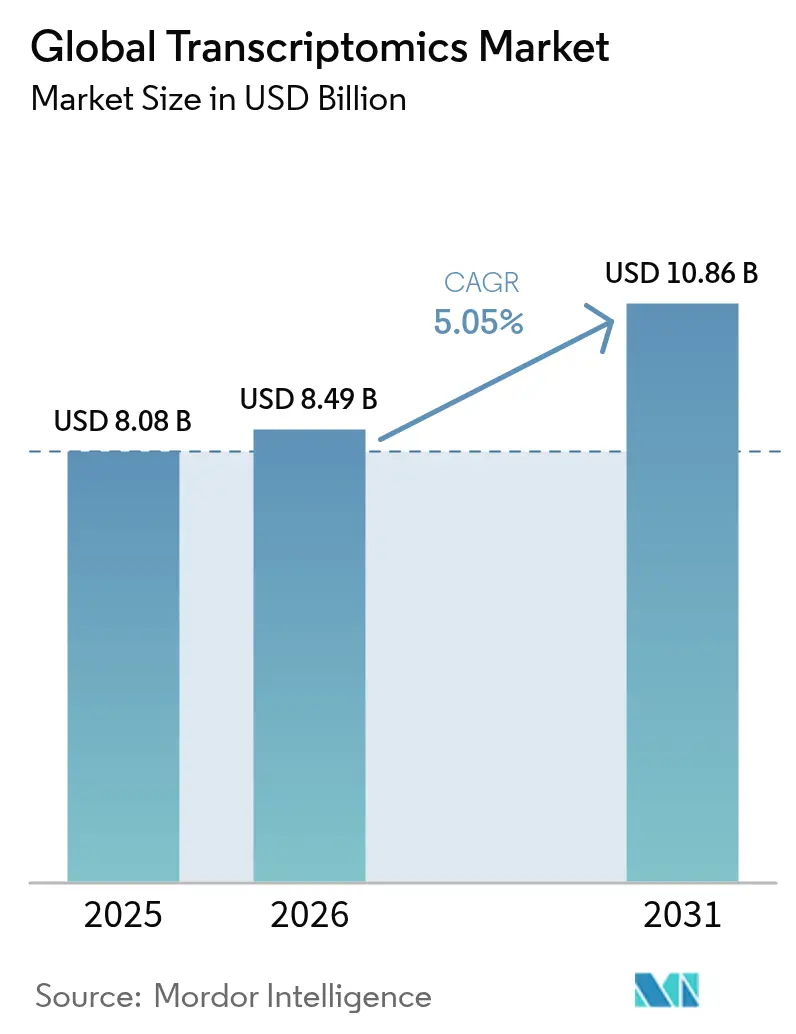
| Market Size (2026) | USD 8.49 Billion |
| Market Size (2031) | USD 10.86 Billion |
| Growth Rate (2026 - 2031) | 5.05% CAGR |
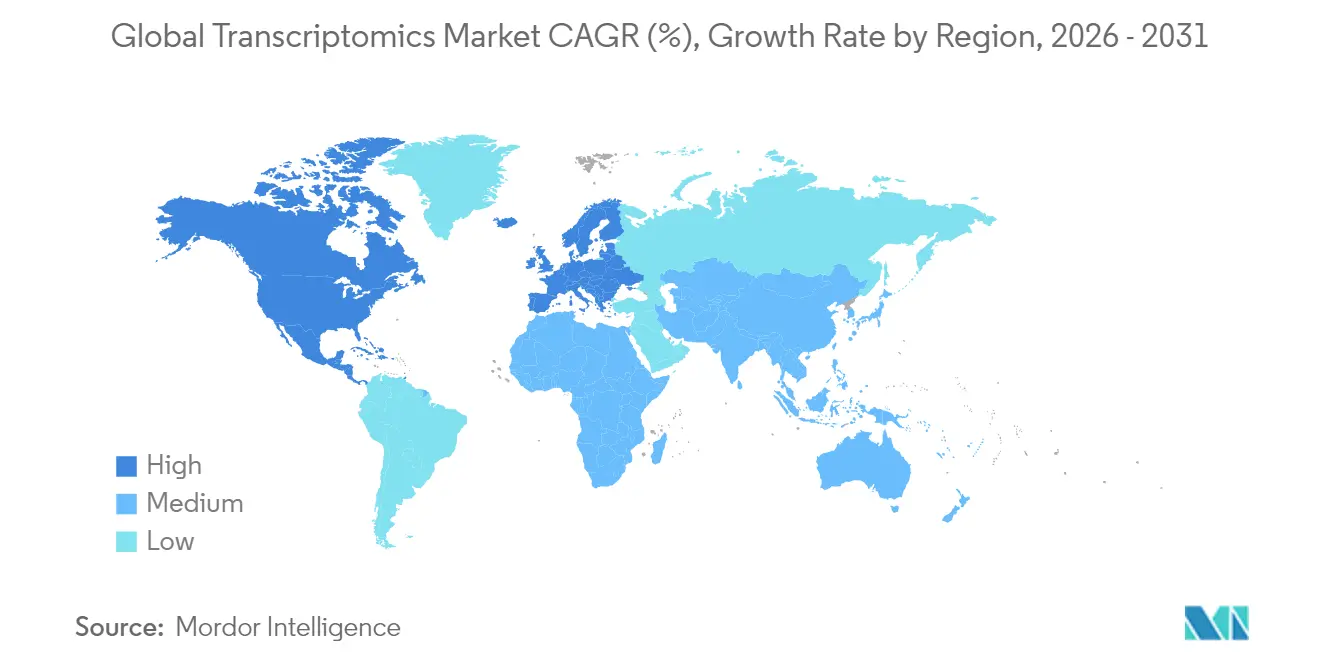
| Fastest Growing Market | Asia Pacific |
| Largest Market | North America |
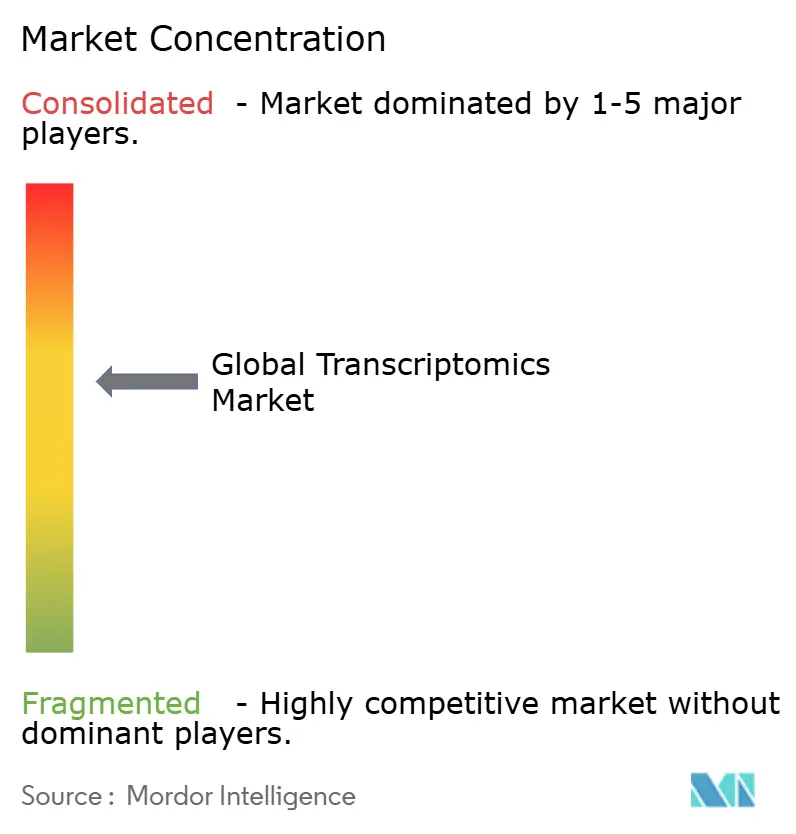
| Market Concentration | Medium |
Major Players *Disclaimer: Major Players sorted in no particular order Image © Mordor Intelligence. Reuse requires attribution under CC BY 4.0. | |
Global Transcriptomics Market Analysis by Mordor Intelligence
The transcriptomics market size is expected to grow from USD 8.08 billion in 2025 to USD 8.49 billion in 2026 and is forecast to reach USD 10.86 billion by 2031 at 5.05% CAGR over 2026-2031. Near-term growth stems from rising clinical demand for gene-expression profiling across oncology, immunology, and rare-disease applications, while longer-term expansion will be driven by artificial-intelligence (AI) integration, spatial sequencing advances, and broad reimbursement adoption. Single-cell RNA sequencing (scRNA-seq) underpins almost half of current revenues, yet spatial transcriptomics is outpacing all other technologies as laboratories seek tissue-architecture context. North America’s mature reimbursement pathways sustain its leadership, whereas Asia-Pacific benefits from state-backed genomics initiatives and lower clinical-trial costs. Strategic acquisitions that bundle transcriptomics with proteomics and metabolomics signal a market pivot toward end-to-end precision-medicine solutions rather than stand-alone expression platforms.
Key Report Takeaways
- By technology, single-cell RNA sequencing captured 46.78% of transcriptomics market share in 2025, while spatial transcriptomics is forecast to expand at a 6.32% CAGR through 2031.
- By product, consumables and reagents accounted for 53.74% of the transcriptomics market size in 2025; instruments are advancing at a 6.55% CAGR.
- By application, drug discovery held 41.02% revenue share in 2025, whereas biomarker identification is set to grow at 6.89% CAGR to 2031.
- By end user, academic and research institutes commanded 43.32% share of the transcriptomics market size in 2025, while pharmaceutical-biotechnology companies post the fastest 6.82% CAGR.
- By geography, North America led with 44.96% transcriptomics market share in 2025; Asia-Pacific is projected to grow at 7.05% CAGR through 2031.
Note: Market size and forecast figures in this report are generated using Mordor Intelligence’s proprietary estimation framework, updated with the latest available data and insights as of 2026.
Global Transcriptomics Market Trends and Insights
Drivers Impact Analysis*
| Driver | (~) % Impact on CAGR Forecast | Geographic Relevance | Impact Timeline |
|---|---|---|---|
| Rapid Adoption Of RNA-Seq Platforms | +1.2% | Global, with North America and Europe leading | Medium term (2-4 years) |
| Expansion Of Transcriptomics-Based Drug Discovery | +1.8% | North America & EU, expanding to APAC | Long term (≥ 4 years) |
| Cloud-Native AI Pipelines Are Democratizing Large-Scale Transcriptomic Data Analysis | +1.0% | Global, with early adoption in North America and EU | Medium term (2-4 years) |
| Rising Chronic Disease Burden & Precision Diagnostics Demand | +1.5% | Global, with highest impact in aging populations | Long term (≥ 4 years) |
| Emergence Of Spatial & Single-Cell Transcriptomics | +0.9% | North America, EU, Japan, South Korea | Medium term (2-4 years) |
| Agri-Genomics Programs In Food-Insecure Regions | +0.4% | Sub-Saharan Africa, South Asia, Latin America | Long term (≥ 4 years) |
| Source: Mordor Intelligence | |||
Rapid Adoption Of RNA-Seq Platforms
Clinical laboratories increasingly integrate RNA-sequencing workflows following 2024 FDA approvals of assays such as TruSight Oncology Comprehensive, creating reimbursement certainty and accelerating platform uptake [1]U.S. Food & Drug Administration, “TruSight Oncology Comprehensive Approval,” fda.gov. Long-read technologies from Oxford Nanopore and Pacific Biosciences have solved splice-variant detection, reporting median 98.8% read accuracy for direct RNA sequencing. Clinical sequencing revenues exceeded research use for the first time in 2023, pushing manufacturers to emphasize automation and interpretation software rather than throughput. The shift raises quality-control expectations but simultaneously unlocks premium pricing, reinforcing a recurring consumables model that underpins sustained transcriptomics market growth.
Expansion Of Transcriptomics-Based Drug Discovery
Pharmaceutical companies deploy multi-omics AI to mine scRNA-seq data for drug targets, cutting development timelines; Recursion Pharmaceuticals’ approach exemplifies this trend. Spatial transcriptomics adds micro-environment context critical for oncology research, and FDA guidance from its 2024 Omics Days conference clarified biomarker-validation pathways, spurring investment. Resulting translational studies move expression biomarkers from discovery to pivotal trials faster, lifting demand for high-throughput sequencing reagents.
Rising Chronic Disease Burden & Precision Diagnostics Demand
Liquid-biopsy platforms now combine circulating tumor RNA with DNA mutation panels for real-time disease monitoring; Foundation Medicine’s Liquid CDx secured expanded approval in 2024. COVID-19’s molecular-testing infrastructure remains in place, easing hospital adoption of transcriptomic assays across oncology and cardiology. Point-of-care nanopore devices deliver gene-expression results in remote settings, helping health systems manage chronic conditions proactively and lowering downstream treatment costs.
Emergence Of Spatial & Single-Cell Transcriptomics
Spatial methods moved from research to clinical validation as Illumina introduced a high-density platform in 2025 that profiles millions of cells per slide. AI-driven pattern recognition maps cellular interaction networks, revealing disease pathways unseen in bulk analysis. Falling per-cell costs democratize access for smaller centers, deepening the user base and reinforcing the consumables revenue stream vital to the transcriptomics market.
Restraints Impact Analysis*
| Restraint | (~) % Impact on CAGR Forecast | Geographic Relevance | Impact Timeline |
|---|---|---|---|
| High Platform & Consumable Costs | -1.1% | Global, with highest impact in emerging markets | Short term (≤ 2 years) |
| Bioinformatics Skill Gap & Data-Handling Complexity | -0.8% | Global, particularly acute in APAC and Latin America | Medium term (2-4 years) |
| Stringent Data-Privacy / Clinical-Validation Regulations | -0.6% | EU, North America, with spillover to global markets | Medium term (2-4 years) |
| Supply Bottlenecks For Single-Cell Reagents | -0.4% | Global, with manufacturing concentrated in North America & EU | Short term (≤ 2 years) |
| Source: Mordor Intelligence | |||
High Platform & Consumable Costs
A scRNA-seq run ranges from USD 3,170 to USD 25,540, straining research grants and discouraging small clinical labs. Consumables outpace instrument costs over a platform’s life, yet limited supplier competition slows price declines. Emerging entrants Element Biosciences and Ultima Genomics promise lower-cost chemistries, but widespread adoption remains two years away. Leasing and service models help offset capital expenditure, though they raise lifecycle costs and reduce workflow flexibility.
Bioinformatics Skill Gap & Data-Handling Complexity
Multi-layer expression datasets demand expertise spanning biology, statistics, and computer science, skills scarce outside top centers [2]National Center for Biotechnology Information, “Single-Cell Transcriptomics Databases,” ncbi.nlm.nih.gov . Automated cloud pipelines lower entry barriers, yet many clinicians distrust opaque algorithms for diagnostic decisions. Universities struggle to update curricula to pace evolving methods, inflating salaries and giving large urban centers a talent monopoly that slows broader transcriptomics market penetration.
*Our forecasts treat driver/restraint impacts as directional, not additive. The impact forecasts reflect baseline growth, mix effects, and variable interactions.
Segment Analysis
By Technology: Single-Cell Dominance Faces Spatial Challenge
Single-cell RNA sequencing held 46.78% transcriptomics market share in 2025, underscoring its role in resolving cellular heterogeneity that bulk methods overlook . The segment’s maturity redirects innovation toward workflow throughput and cost reduction, while spatial platforms record a 6.32% CAGR as laboratories seek tissue-structure context.
The transcriptomics market continues to tilt toward multimodal solutions that merge scRNA-seq with spatial barcoding, enhancing insight without sacrificing resolution. Long-read chemistries capture complex isoforms, broadening oncologic and neurologic study scope. Although microarrays fade, quantitative PCR maintains a foothold for rapid, low-plex assays. Vendors therefore balance portfolios between high-content discovery tools and targeted clinical panels to secure diverse revenue streams.


By Product: Consumables Revenue Model Drives Recurring Growth
Consumables generated 53.74% of the transcriptomics market size in 2025, emphasizing the power of a razor-razorblade model that assures recurrent cash flow. Instrument sales slowed as core features converged across vendors, yielding only 6.55% growth.
Software and analytical-service revenues accelerate as data complexity grows, allowing specialized providers to capture value beyond wet-lab reagents. Cloud-native pipelines democratize advanced bioinformatics, yet premium prices for clinical-grade kits keep margins high. As the installed instrument base saturates top research centers, consumable vendors pivot to emerging markets and mid-tier hospitals, tailoring kit sizes and price points to local budgets.
By Application: Drug Discovery Leadership Yields to Diagnostics Growth
Drug discovery commanded 41.02% revenue in 2025, but biomarker identification’s 6.89% CAGR through 2031 signals a shift toward diagnostic deployment. Early-stage RNA signatures now guide patient-selection criteria, lowering trial failure rates.
High regulatory clarity encourages commercial labs to launch expression panels for minimal residual disease and immune-checkpoint response. Agriculture-focused transcriptomics gains momentum through CRISPR-enabled crop improvement projects led by USDA, diversifying the transcriptomics market beyond biomedical confines. Environmental monitoring and forensics emerge as niche uses that extend the technology’s reach.

By End User: Academic Institutions Lead Despite Pharma Acceleration
Academic and research institutes held 43.32% of the transcriptomics market size in 2025, reflecting sustained public-grant funding. Growth, however, moderates as budgets plateau, while pharmaceutical-biotechnology firms post a 6.82% CAGR by linking transcriptomics to pipeline productivity.
Clinical laboratories expand rapidly once reimbursement pathways stabilize, reshaping test-volume distribution toward patient-centric assays. Contract research organizations offer turnkey sequencing and analysis, enabling smaller biotechs to compete without capital-intensive infrastructure. Government agencies also scale transcriptomic surveillance for public-health monitoring, broadening the end-user base.
Geography Analysis
North America accounted for 44.96% transcriptomics market share in 2025, anchored by abundant venture capital, dense biopharma clusters, and FDA companion-diagnostic pathways that encourage clinical validation. Public–private partnerships such as the Cancer Moonshot sustain large-scale expression-atlas projects, keeping domestic consumables demand high. Canada leverages a single-payer system to run population-level gene-expression studies, while Mexico lures contract-manufacturing investment through lower costs and rising clinical-trial activity.
Asia-Pacific posts a 7.05% CAGR, propelled by China’s multi-billion-dollar precision-medicine grants and Japan’s early adoption of spatial-omic diagnostics. India’s contract-research ecosystem couples vast patient pools with cost-efficient trials that increasingly include transcriptomic endpoints. Australia’s government-funded Genomics Australia program encourages translational-omics collaborations, funneling academic breakthroughs into commercial assays. Diverse regulatory regimes remain both opportunity and obstacle, with some markets offering accelerated approvals and others demanding prolonged local validation.
Europe maintains strong basic-research output through projects like Genome of Europe, yet stringent General Data Protection Regulation (GDPR) rules lengthen time-to-clinic for novel diagnostics. Germany, the United Kingdom, and France dominate test volumes, supported by established reimbursement codes. Smaller nations such as Switzerland and the Netherlands specialize in high-content single-cell analytics and platform integration consulting. Post-Brexit collaboration frameworks ensure continued data exchange, preserving the region’s cohesive R&D landscape.

Competitive Landscape
The transcriptomics market shows moderate consolidation as sequencing incumbents extend portfolios via mergers and vertical integration. Illumina’s USD 350 million SomaLogic deal and Thermo Fisher’s USD 3.1 billion Olink acquisition illustrate the pivot toward multi-omic ecosystems that bundle RNA, protein, and spatial data. These moves elevate switching costs for customers, who increasingly favor one-stop solutions covering sample prep through AI reporting.
Emergent challengers such as Element Biosciences and Ultima Genomics attract attention with lower-cost chemistries and innovative sequencing-by-synthesis variants, forcing incumbents to revisit pricing and reagent formats. Roche’s Sequencing-by-Expansion technology enters pilot deployment in 2025, promising higher read accuracy on clinical FFPE tissue. Competitive focus shifts from maximum throughput to usability, automation, and integrated analytics that eliminate bioinformatics bottlenecks.
Intellectual-property positioning remains decisive; Illumina continues to defend core bridge-amplification patents while newcomers design around them. White-space opportunities lie in point-of-care devices, cGMP-compliant automation for cell-therapy QC, and real-time AI interpretation dashboards. Vendors able to manage data security under global privacy frameworks hold an advantage as cross-border genomic collaborations expand.
Global Transcriptomics Industry Leaders
F. Hoffmann-La Roche Ltd
Thermo Fisher Scientific
Merck KGaA
GE Healthcare
Bio-Rad Laboratories
- *Disclaimer: Major Players sorted in no particular order

Recent Industry Developments
- December 2022: Alithea Genomics launched MERCURIUS™ Full-Length DRUG-seq, enabling large-scale RNA-seq without RNA isolation.
- April 2024: BioBam released OmicsBox 3.2 with enhanced visualization and cell-type annotation for single-cell and long-read datasets.
- May 2024: Bruker acquired NanoString Technologies for USD 392.6 million, adding AtoMx, nCounter, GeoMx, and CosMx lines.
- April 2024: Lexogen debuted its FFPE Transcriptomics suite, including QuantSeq FFPE 3′ mRNA-Seq, CORALL FFPE Whole Transcriptome, and SPLIT One-Step RNA Extraction kits.


Research Methodology Framework and Report Scope
Market Definitions and Key Coverage
Our study defines the global transcriptomics market as the value of instruments, consumables, software, and data-analysis tools used to profile every RNA transcript expressed in cells, tissues, or whole organisms across research, diagnostic, agricultural, and industrial settings.
Scope exclusion: Disposable laboratory plastics, cloud-storage services that deliver no analytic function, and proteomic or metabolomic kits are not counted.
Segmentation Overview
- By Technology
- Microarray
- Real-time Quantitative PCR (qPCR)
- Next-Generation Sequencing (RNA-Seq)
- Single-cell RNA-Seq
- Spatial Transcriptomics
- In-situ Hybridization & Other Methods
- By Product
- Consumables & Reagents
- Instruments
- Software & Services
- By Application
- Drug Discovery & Development
- Diagnostics & Disease Profiling
- Biomarker & Target Identification
- Agriculture & Plant Science
- Others
- By End User
- Academic & Research Institutes
- Pharmaceutical & Biotechnology Companies
- Clinical & Diagnostic Laboratories
- Others
- By Geography
- North America
- United States
- Canada
- Mexico
- Europe
- Germany
- United Kingdom
- France
- Italy
- Spain
- Rest of Europe
- Asia-Pacific
- China
- Japan
- India
- Australia
- South Korea
- Rest of Asia-Pacific
- Middle East & Africa
- GCC
- South Africa
- Rest of Middle East & Africa
- South America
- Brazil
- Argentina
- Rest of South America
- North America
Detailed Research Methodology and Data Validation
Primary Research
Mordor analysts conduct in-depth interviews and short surveys with sequencing-platform engineers, bioinformatics software architects, core-facility managers, and translational researchers in North America, Europe, Asia-Pacific, and Latin America. These discussions validate unit pricing, throughput shifts, and procurement plans, while also revealing region-specific funding headwinds that rarely surface in public data.
Desk Research
We begin with structured searches across public datasets such as the NCBI Gene Expression Omnibus, NIH RePORTER grant awards, Eurostat biotech outputs, and FAOSTAT crop-omics statistics; these sources ground baseline sample volumes and funding flows. Peer-reviewed journals (Nature Methods, Genome Biology, Plant Physiology) help trace adoption curves for single-cell and spatial RNA-seq. Annual reports and 10-Ks supply segment revenue splits, which are captured through D&B Hoovers, while Questel patent analytics signal emerging sub-fields. National trade associations, customs records, and reputable press releases fill geographic or technology gaps. This list is illustrative; numerous additional sources inform our desk work.
Market-Sizing & Forecasting
A top-down model converts global RNA-seq run counts and spatial slide throughput into reagent and instrument demand, which is then cross-checked with selective bottom-up estimates from supplier roll-ups and average selling price × volume samples. Key variables include (1) median read cost per gigabase, (2) annual NIH and Horizon Europe transcriptomics funding, (3) installed next-generation sequencer base, (4) publication volumes indexed in PubMed, and (5) adoption rates of single-cell capture kits. Multivariate regression links these drivers to historical revenue, and three-scenario analysis tests policy or pricing shocks. Where data gaps persist, we interpolate using peer country proxies and confirm plausibility through respondent feedback.
Data Validation & Update Cycle
Outputs pass automated variance checks against prior editions and against third-party shipment or grant statistics, followed by a two-step analyst review. Reports refresh each year, and interim updates are triggered when funding laws, major platform launches, or merger events materially alter our baseline.
Why Mordor's Transcriptomics Baseline Commands Reliability
Published estimates diverge because publishers mix scopes, apply dissimilar price decks, or project growth from outdated baselines.
Key gap drivers center on whether software analytics are included, the breadth of end-user segments, refresh cadence, and the rigor of primary validation. Our study reports the current year after reconciling kit ASP drift and newly installed spatial platforms; many others freeze exchange rates or extrapolate from older sequencer shipments.
Benchmark comparison
| Market Size | Anonymized source | Primary gap driver |
|---|---|---|
| USD 8.08 B (2025) | Mordor Intelligence | - |
| USD 7.80 B (2025) | Regional Consultancy A | Omits software analytics; counts only 20 largest economies |
| USD 7.06 B (2025) | Trade Journal B | Relies on straight-line historical growth; lacks primary interviews |
| USD 8.37 B (2024) | Industry Association C | Combines RNA analysis with proteomics; year mismatch and fixed 2024 FX |
Together, these comparisons show that Mordor's disciplined scope selection, annual refresh, and dual-source validation yield a balanced, transparent baseline that decision-makers can trust.


Key Questions Answered in the Report
What is the current Global Transcriptomics Market size?
The transcriptomics market size reached USD 8.49 billion in 2026 and is forecast to hit USD 10.86 billion by 2031.
Who are the key players in Global Transcriptomics Market?
F. Hoffmann-La Roche Ltd, Thermo Fisher Scientific, Merck KGaA, GE Healthcare and Bio-Rad Laboratories are the major companies operating in the Global Transcriptomics Market.
Which is the fastest growing region in Global Transcriptomics Market?
Asia Pacific is estimated to grow at the highest CAGR over the forecast period (2026-2031).
Which technology leads the transcriptomics market?
Single-cell RNA sequencing leads with 46.78% market share, though spatial transcriptomics is growing faster at a 6.32% CAGR.
Page last updated on:


