DNA Microarray Market Size and Share
Market Overview
| Study Period | 2020 - 2031 |
|---|---|
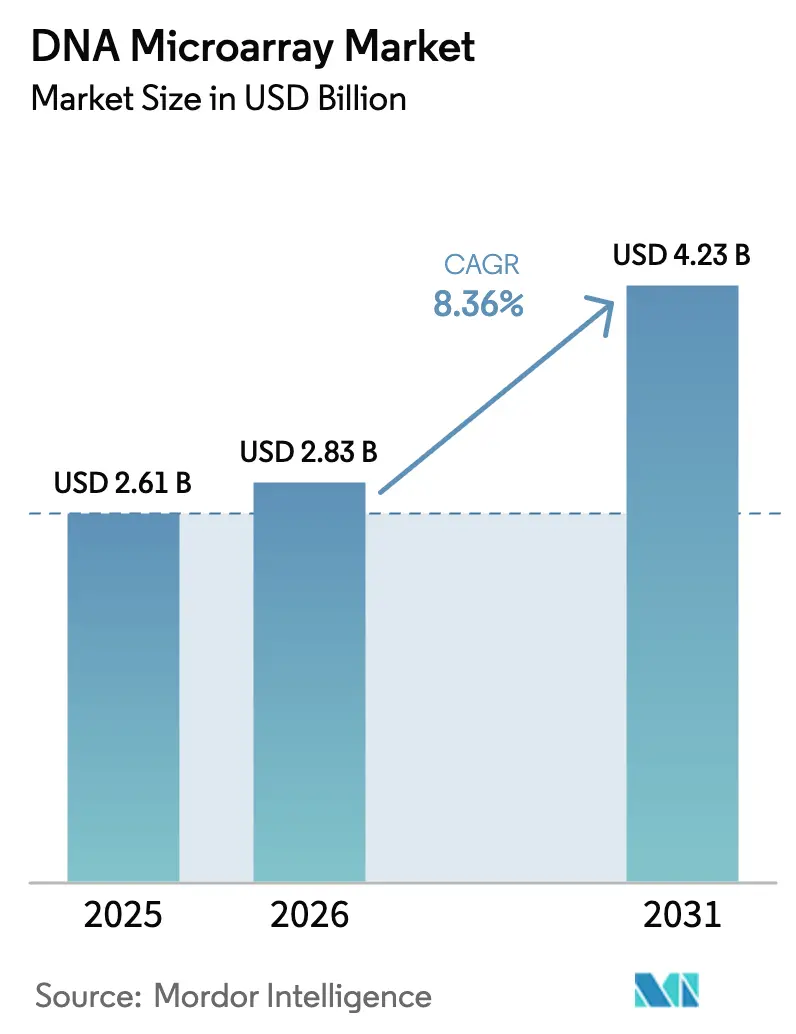
| Market Size (2026) | USD 2.83 Billion |
| Market Size (2031) | USD 4.23 Billion |
| Growth Rate (2026 - 2031) | 8.36% CAGR |
| Fastest Growing Market | Asia Pacific |
| Largest Market | North America |
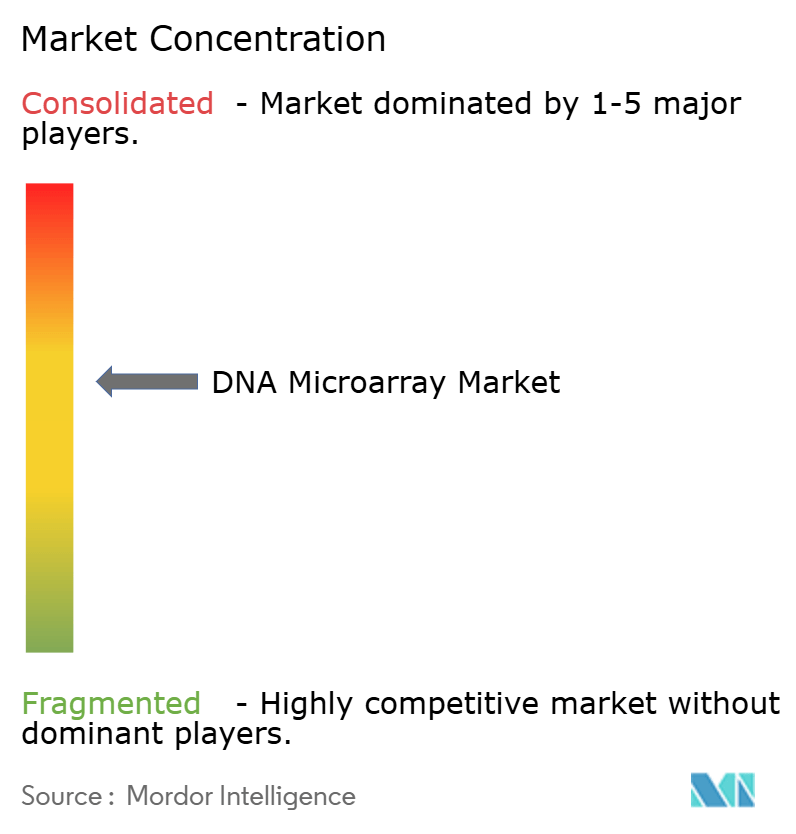
| Market Concentration | Medium |
Major Players *Disclaimer: Major Players sorted in no particular order Image © Mordor Intelligence. Reuse requires attribution under CC BY 4.0. | |
DNA Microarray Market Analysis by Mordor Intelligence
The DNA microarray market size was valued at USD 2.61 billion in 2025 and estimated to grow from USD 2.83 billion in 2026 to reach USD 4.23 billion by 2031, at a CAGR of 8.36% during the forecast period (2026-2031). Cost-effective targeted profiling, easier regulatory pathways and new spatial transcriptomics workflows continue to anchor the DNA microarray market’s relevance even as next-generation sequencing (NGS) prices fall.[1]Mohan Yourick et al., “An updated comparison of microarray and RNA-seq for concentration response transcriptomic study,” BMC Genomics, biomedcentral.com Oligonucleotide arrays hold nearly half of current revenues, companion-diagnostic approvals bolster clinical uptake, and integrated software services gain momentum. Established reimbursement structures in North America and rising research outlays across Asia-Pacific sustain demand, while consolidation among leading suppliers finances multiomics expansion strategies.
Key Report Takeaways
- By product category, oligonucleotide arrays led with 46.62% revenue share in 2025, while Other Types (BAC & SNP arrays) are projected to advance at an 11.62% CAGR through 2031.
- By application, gene-expression analysis accounted for 51.05% of the DNA microarray market share in 2025; epigenetics is forecast to grow at a 12.15% CAGR through 2031.
- By component, instruments commanded 42.74% of the DNA microarray market size in 2025, whereas services & bioinformatics software are expanding at a 12.33% CAGR to 2031.
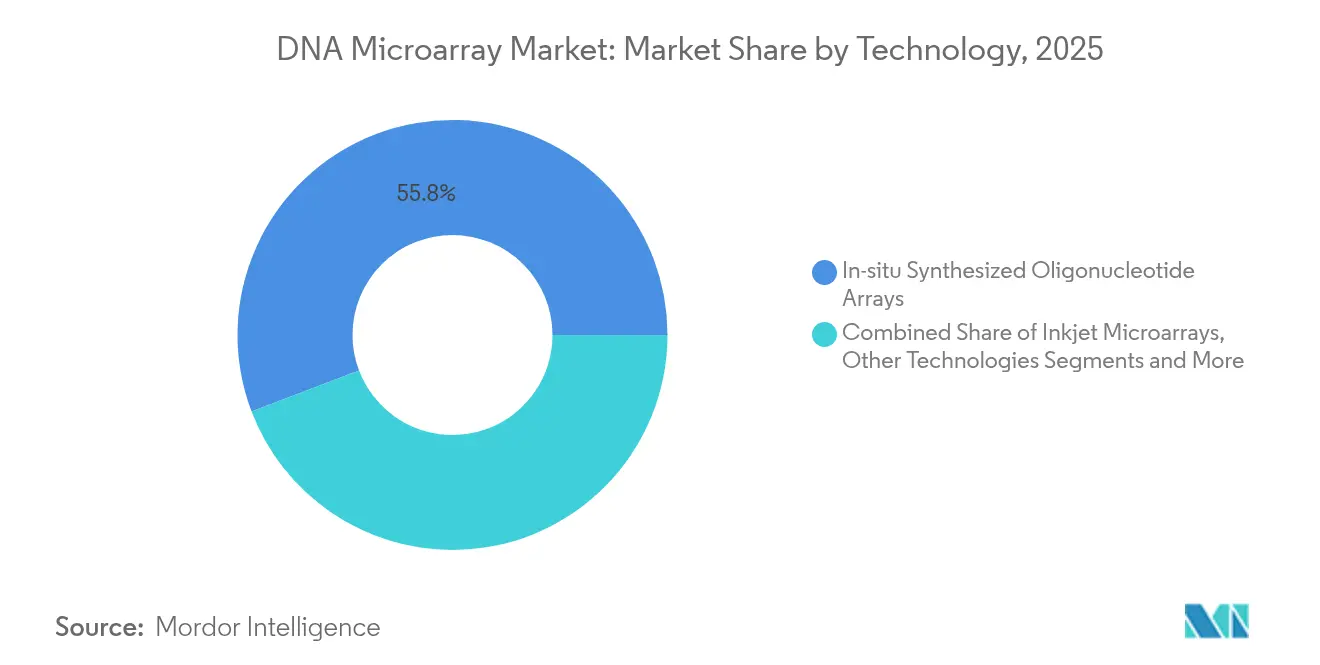
- By technology, in-situ synthesized arrays held 55.78% revenue share in 2025, while other technologies are expected to post an 11.3% CAGR up to 2031.
- By end user, academic & government research institutes captured 50.62% share in 2025; hospitals & diagnostic centers are progressing at a 10.24% CAGR during the forecast period.
- By geography, North America contributed 38.84% of 2025 revenues, whereas Asia-Pacific is projected to grow the fastest at a 10.7% CAGR through 2031.
Note: Market size and forecast figures in this report are generated using Mordor Intelligence’s proprietary estimation framework, updated with the latest available data and insights as of 2026.
Global DNA Microarray Market Trends and Insights
Drivers Impact Analysis*
| Driver | (~) % Impact on CAGR Forecast | Geographic Relevance | Impact Timeline |
|---|---|---|---|
| Growing need for personalized medicine amid high burden of genetic disorders & cancers | +1.2% | Global, early gains in North America & EU | Medium term (2-4 years) |
| Increasing medical research funding volumes | +0.8% | Global, concentrated in APAC & North America | Short term (≤ 2 years) |
| Rising adoption of microarray-based companion diagnostics in oncology pipelines | +1.5% | North America & EU core, spill-over to APAC | Medium term (2-4 years) |
| Emergence of spatial transcriptomics integrating microarray chips | +0.9% | Global, early adoption in research centers | Long term (≥ 4 years) |
| Growth of agricultural genomics deploying low-cost crop-specific arrays | +0.7% | APAC core, expansion to South America & Africa | Long term (≥ 4 years) |
| Decentralized point-of-care microarray devices for infectious-disease panels | +0.6% | Global, priority in resource-limited settings | Medium term (2-4 years) |
| Source: Mordor Intelligence | |||
Growing Need For Personalized Medicine Amid High Burden Of Genetic Disorders & Cancers
The FDA clearance of FoundationOne CDx for PIK3CA, AKT1 and PTEN alterations in breast cancer highlights how microarrays help clinicians triage tumors for precision therapies.[2]U.S. Food and Drug Administration, “FoundationOne CDx – P170019/S048,” fda.govRoughly 70% of hormone-receptor-positive, HER2-negative breast cancers harbor PIK3CA mutations, creating a sizable testable population. Hospitals link electronic health records to microarray outputs to refine risk stratification. Laboratories still favor arrays when NGS depth exceeds local budgets. As oncology pipelines widen, payers reward fast, lower-complexity assays that fit within existing lab workflows.
Increasing Medical Research Funding Volumes
National funding bodies and private foundations are raising genomic infrastructure budgets, spurred by lessons from recent viral outbreaks. The National Cancer Institute’s myeloMATCH trial pairs broad genomic profiling with targeted therapy selection, reinforcing demand for scalable platforms. Universities blend microarray pre-screens with focused NGS to manage costs without sacrificing coverage. This hybrid approach lengthens instrument life cycles and fuels service revenues, directly benefiting the DNA microarray market.
Rising Adoption Of Microarray-Based Companion Diagnostics In Oncology Pipelines
Stringent biomarker-labeling rules drive drug developers toward established array systems that already carry class-III or class-IV approvals. Agilent’s partnership with Incyte leverages the FDA-cleared GeneChip System 3000Dx to shave months from regulatory timelines. Illumina’s TruSight Oncology Comprehensive assay, approved as a pan-tumor companion diagnostic, underscores how arrays can prescreen for broad variant panels before deeper sequencing. Pharmaceutical firms embed such screening into phase II studies to stratify patients quickly.
Emergence Of Spatial Transcriptomics Integrating Microarray Chips
Spatial transcriptomics tools like FISHnCHIPs deliver 2-20× higher sensitivity than conventional FISH while keeping tissue architecture intact. The Microarray Integrated Spatial Transcriptomics platform cuts per-sample costs to USD 875, about one-quarter of older methods.[3]Fei Chen, “Highly sensitive spatial transcriptomics using FISHnCHIPs,” Nature Communications, nature.com Computational array reconstruction further removes imaging steps yet retains single-cell resolution. These advances place microarrays at the center of next-generation pathology, especially where hospitals seek economical entry into spatial omics.
Restraints Impact Analysis*
| Restraint | (~) % Impact on CAGR Forecast | Geographic Relevance | Impact Timeline |
|---|---|---|---|
| High cost & competition from NGS, qPCR & CRISPR screening platforms | -2.1% | Global, especially high-income markets | Short term (≤ 2 years) |
| Limited reimbursement for array-based diagnostics | -1.8% | North America & EU core, expanding globally | Medium term (2-4 years) |
| Data-privacy regulations constraining clinical genomic data sharing | -1.2% | EU core, spill-over worldwide | Long term (≥ 4 years) |
| Supply-chain fragility of specialty reagents & substrates | -0.9% | Global, acute impact in Asia-Pacific | Short term (≤ 2 years) |
| Source: Mordor Intelligence | |||
High Cost & Competition From NGS, qPCR & CRISPR Screening Platforms
The cost to sequence a genome fell from USD 1 million in 2007 to roughly USD 600 in 2025, pressuring array pricing. RNA-seq detects more novel transcripts, yet arrays still satisfy many protein-coding studies with simpler data pipelines. Long-read sequencers from PacBio and Oxford Nanopore resolve complex regions beyond array reach, shifting certain budgets away from microarrays. Vendors answer by bundling instruments with software and service contracts to defend installed bases.
Limited Reimbursement For Array-Based Diagnostics
U.S. Medicare policies often require extensive documentation and use non-specific CPT codes, delaying payment for array tests. Private insurers vary widely; MolDX covers 65 drug-gene pairs while some plans reimburse fewer than 10. Administrative hurdles drain laboratory resources and dampen new-test submissions. The proposed pharmacogenomic LCD may ease approval for certain panels, yet final guidance remains pending into 2026.
*Our forecasts treat driver/restraint impacts as directional, not additive. The impact forecasts reflect baseline growth, mix effects, and variable interactions.
Segment Analysis
By Product: Oligonucleotide Arrays Drive Innovation While Specialty Formats Accelerate
Oligonucleotide microarrays generated 46.62% of 2025 revenues, underscoring their entrenched role in gene-expression workflows and regulatory-cleared companion diagnostics. High probe density, mature manufacturing lines and broad annotation databases keep these arrays attractive to both clinical and research buyers. The DNA microarray market size for oligonucleotide formats is projected to expand steadily as laboratories refresh installed instruments in line with software upgrades. Meanwhile, BAC and SNP arrays post an 11.62% CAGR to 2031, propelled by structural-variation studies and large-scale biobank initiatives that require cost-controlled genotyping.
cDNA arrays retain footholds in focused research, though NGS dominates discovery-level transcriptomics. Comparative studies still cite cDNA arrays for consistent protein-coding coverage with minimal compute burden. Specialty formats gain fresh momentum from spatial transcriptomics integrations, where customized surfaces preserve tissue context. As capital budgets tighten, hybrid labs often invest in mid-range specialty arrays rather than move straight to full NGS, keeping the DNA microarray market resilient.


By Application: Gene Expression Dominates While Epigenetics Emerges
Gene-expression analysis contributed 51.05% of 2025 application revenue thanks to validated protocols, reimbursement familiarity and continuing drug-development use. Clinically, FDA-cleared expression panels in breast cancer underscore regulatory trust in array outputs. Drug sponsors design adaptive trials that employ expression arrays at enrollment to streamline biomarker stratification.
Epigenetics grows at a 12.15% CAGR as oncology shifts toward methylation-based early detection. Arrays offer an economical first screen before targeted bisulfite sequencing. Pathogen detection and pharmacogenomics maintain niche appeal, leveraging 400-antigen protein arrays that out-perform legacy ELISA panels. As reimbursement codes for pharmacogenomics mature, the DNA microarray market share attributed to these high-growth niches may widen.
By Component: Instruments Lead While Services Accelerate
Capital equipment sales made up 42.74% of 2025 revenue, anchored by legacy GeneChip and SurePrint systems still favored for FDA submissions. Vendors extend service contracts and bundle software licenses to keep utilization high, thus safeguarding recurring consumables income.
Services and bioinformatics software, growing 12.33% annually, reflect rising data complexity and the need for integrated cloud pipelines. Laboratories lacking in-house data scientists outsource analysis, creating high-margin opportunities for platform providers. Consumables see steady sales tied to daily throughput but remain price sensitive in academia. Diversification away from single-origin reagent suppliers mitigates disruption risk, supporting a stable DNA microarray market.
By Technology: In-Situ Synthesis Dominates While Alternative Methods Gain Traction
In-situ synthesized oligonucleotide arrays held 55.78% of 2025 sales, offering unmatched probe density for comprehensive panels. Photolithographic processes leverage semiconductor expertise to deliver uniformity, key for regulatory-grade assays.
Inkjet and contact-spotted arrays rise 11.3% annually, catering to rapid prototyping and custom panels for emerging pathogens or plant-genomics projects. Advances in substrate chemistry improve signal-to-noise, narrowing performance gaps with photolithography. As spatial omics converges, microfabrication specialists experiment with three-dimensional substrates to integrate histology and transcriptomics on a single slide, broadening the DNA microarray market.
By End User: Academic Institutions Lead While Clinical Adoption Accelerates
Academic & government institutes generated 50.62% of demand in 2025, benefiting from discounted pricing and grant support. Multi-year projects such as pan-cancer atlases rely on arrays for baseline expression profiling before deep sequencing.
Hospitals & diagnostic centers, the fastest-growing segment at 10.24% CAGR, expand molecular pathology menus with array-based pharmacogenomic panels that fit within existing lab information systems. Pharmaceutical and biotech companies keep arrays in early-stage pipelines for screening large compound libraries against expression signatures. As point-of-care devices mature, community hospitals may adopt portable array modules, extending the DNA microarray industry’s reach.
Geography Analysis
North America retained 38.84% of 2025 revenue on the back of clear FDA pathways and established reimbursement codes for oncology assays. Large reference labs integrate arrays into high-volume workflows that pair with NGS follow-up when required. The MyeloMATCH precision-medicine program illustrates continuing institutional faith in array-enabled stratification despite sequencing advances. Yet complex coding rules and payer variability temper clinical rollout speed, leaving some growth on the table.
Asia-Pacific is forecast to post a 10.7% CAGR as China’s sequencing sector rebounds and public funds flow into precision-health goals. Domestic policies favor locally made instruments, prompting multinationals to form joint ventures or license technology to regional players. Japan and South Korea pursue aging-population health strategies that rely on pharmacogenomic testing, boosting array reagent consumption. Emerging agricultural genomics hubs in India and Southeast Asia further widen addressable volumes.
Europe’s trajectory is moderated by GDPR-induced data-sharing restrictions that complicate pan-EU clinical studies. AliveDx secured IVDR CE mark for its microarray immunoassay, proving the regulatory route is viable but resource intensive. Federated-learning pilots hope to reconcile privacy with cross-border research, yet adoption costs slow near-term uptake. Nonetheless, national cancer plans in Germany and France keep baseline demand intact for the DNA microarray market.


Competitive Landscape
The DNA microarray market shows moderate consolidation as incumbents reposition toward integrated multiomics. Illumina spent USD 775 million on Fluent BioSciences and SomaLogic to secure single-cell and proteomics capabilities. Thermo Fisher’s USD 3.1 billion Olink deal and Agilent’s USD 925 million BioVectra purchase illustrate how arrays now form one layer within broader analytical ecosystems. Consolidation provides scale for R&D into spatial omics and AI-driven bioinformatics.
Competition intensity diverges by application. Companion-diagnostic markets favor incumbents with FDA-cleared systems, giving Thermo Fisher’s GeneChip System 3000Dx a moat where reproducibility outweighs price. Research-only segments are more fragmented, with universities shifting grants toward lowest-cost suppliers. New entrants push inkjet-printed arrays for pilot studies, seeking footholds before scaling.
White-space opportunities appear in spatial transcriptomics, portable infectious-disease testing and agricultural genotyping. The MIST platform’s USD 875 per-sample profile reduces entry barriers for digital pathology, potentially expanding demand across mid-tier hospitals. Start-ups focused on plant breeding deploy custom low-density chips that integrate with field sensors, carving niche revenue streams as food-security concerns rise.
DNA Microarray Industry Leaders
Thermo Fisher Scientific Inc.
Illumina, Inc.
Agilent Technologies, Inc.
QIAGEN
F. Hoffmann-La Roche
- *Disclaimer: Major Players sorted in no particular order

Recent Industry Developments
- May 2025: Illumina received Japanese MHLW approval for TruSight Oncology Comprehensive, enabling streamlined pan-tumor profiling in clinical settings.
- April 2025: Eurofins Genomics acquired LGC Group’s Sanger sequencing business to broaden its service portfolio.
- July 2024: Agilent closed a USD 925 million deal for BioVectra to strengthen oligonucleotide and peptide manufacturing.


Global DNA Microarray Market Report Scope
As per the scope of the report, DNA microarray is a laboratory tool used to detect the expression of thousands of genes simultaneously by hybridizing labeled RNA or DNA samples to complementary DNA probes fixed on a solid surface. This technique allows researchers to analyze gene expression patterns and study genetic variations across different conditions or treatments.
The DNA microarray market is segmented by type, application, end user, and geography. By type, the market is segmented into cDNA microarrays, oligonucleotide microarrays, and other types. The other types are further segmented into BAC microarrays and SNP microarrays. By application, the market is segmented into gene expression analysis, genotyping, and other applications. The other applications are further segmented into epigenetics and pathogen detection. By end user, the market is segmented into pharmaceutical and biotechnology companies, hospitals and diagnostic centers, and research and academic institutes. The report also covers the market size and forecasts for the DNA microarray market in 17 countries across major regions. For each segment, the market sizing and forecasts have been done on the basis of value (USD).
| cDNA Microarrays |
| Oligonucleotide Microarrays |
| Other Types (BAC & SNP arrays) |
| Gene Expression Analysis |
| Genotyping & SNP Analysis |
| Epigenetics |
| Pathogen Detection & Infectious Disease Panels |
| Consumables (Slides, Reagents, Kits) |
| Instruments (Scanners, Spotters, Washers) |
| Services & Bioinformatics Software |
| In-situ Synthesized Oligonucleotide Arrays |
| Spotted Microarrays (Contact / Non-contact) |
| Photolithographic Arrays |
| Inkjet Microarrays |
| Other Technologies |
| Pharmaceutical & Biotechnology Companies |
| Hospitals & Diagnostic Centers |
| Research & Academic Institutes |
| North America | United States |
| Canada | |
| Mexico | |
| Europe | Germany |
| United Kingdom | |
| France | |
| Italy | |
| Spain | |
| Rest of Europe | |
| Asia-Pacific | China |
| Japan | |
| India | |
| Australia | |
| South Korea | |
| Rest of Asia-Pacific | |
| Middle East and Africa | GCC |
| South Africa | |
| Rest of Middle East and Africa | |
| South America | Brazil |
| Argentina | |
| Rest of South America |
| By Product | cDNA Microarrays | |
| Oligonucleotide Microarrays | ||
| Other Types (BAC & SNP arrays) | ||
| By Application | Gene Expression Analysis | |
| Genotyping & SNP Analysis | ||
| Epigenetics | ||
| Pathogen Detection & Infectious Disease Panels | ||
| By Component | Consumables (Slides, Reagents, Kits) | |
| Instruments (Scanners, Spotters, Washers) | ||
| Services & Bioinformatics Software | ||
| By Technology | In-situ Synthesized Oligonucleotide Arrays | |
| Spotted Microarrays (Contact / Non-contact) | ||
| Photolithographic Arrays | ||
| Inkjet Microarrays | ||
| Other Technologies | ||
| By End User | Pharmaceutical & Biotechnology Companies | |
| Hospitals & Diagnostic Centers | ||
| Research & Academic Institutes | ||
| By Geography | North America | United States |
| Canada | ||
| Mexico | ||
| Europe | Germany | |
| United Kingdom | ||
| France | ||
| Italy | ||
| Spain | ||
| Rest of Europe | ||
| Asia-Pacific | China | |
| Japan | ||
| India | ||
| Australia | ||
| South Korea | ||
| Rest of Asia-Pacific | ||
| Middle East and Africa | GCC | |
| South Africa | ||
| Rest of Middle East and Africa | ||
| South America | Brazil | |
| Argentina | ||
| Rest of South America | ||


Key Questions Answered in the Report
What is the current value of the DNA microarray market?
The DNA microarray market size is USD 2.83 billion in 2026 with an expected rise to USD 4.23 billion by 2031.
Which product segment leads the DNA microarray market?
Oligonucleotide microarrays hold the largest share, accounting for 46.62% of 2025 revenues.
Why is Asia-Pacific the fastest-growing region?
Recovery in China’s genomics sector, coupled with national precision-health investments across the region, drives a forecast 10.7% CAGR.
How are companies responding to competition from sequencing technologies?
Market leaders are acquiring single-cell, proteomics and manufacturing assets to integrate arrays into multiomics workflows.
What clinical areas are expanding fastest for microarray adoption?
Companion diagnostics in oncology and methylation-based epigenetic tests show the highest growth rates, fueled by regulatory approvals and payer acceptance.
Page last updated on:


