Market Overview
| Study Period | 2020 - 2031 |
|---|---|
| Forecast Data Period | 2026 - 2031 |
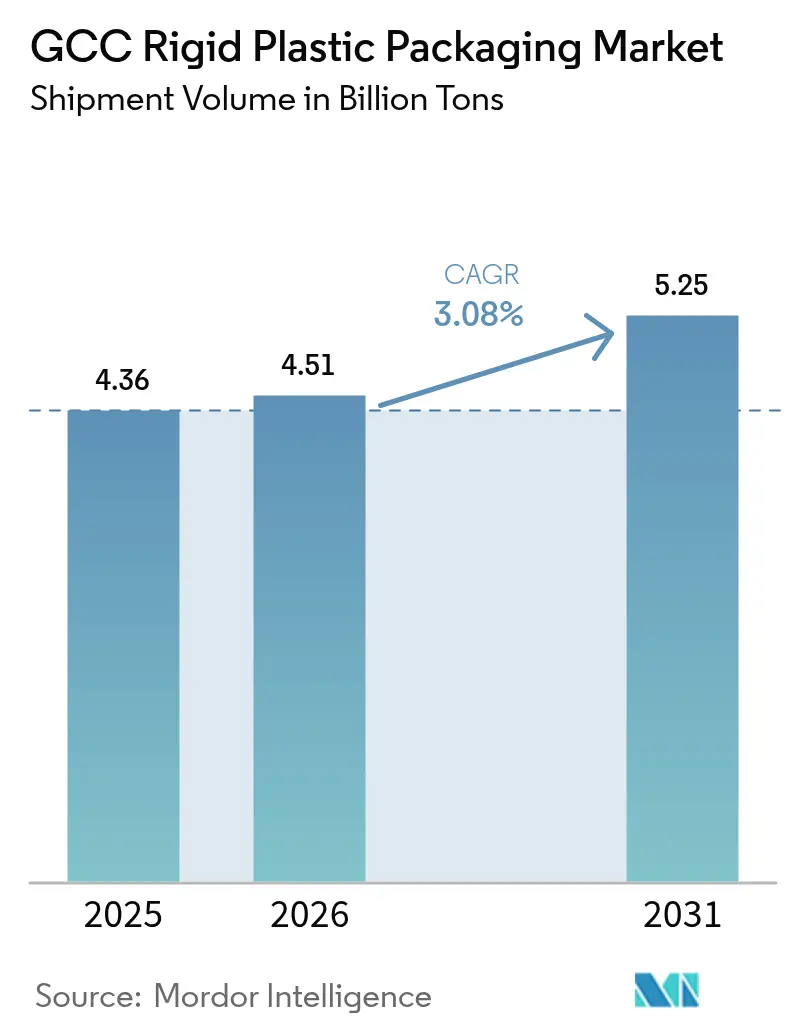
| Base Year Market Size (2025) | 4.36 Billion tons |
| Market Volume (2026) | 4.51 Billion tons |
| Market Volume (2031) | 5.25 Billion tons |
| Growth Rate (2026 - 2031) | 3.08% CAGR |
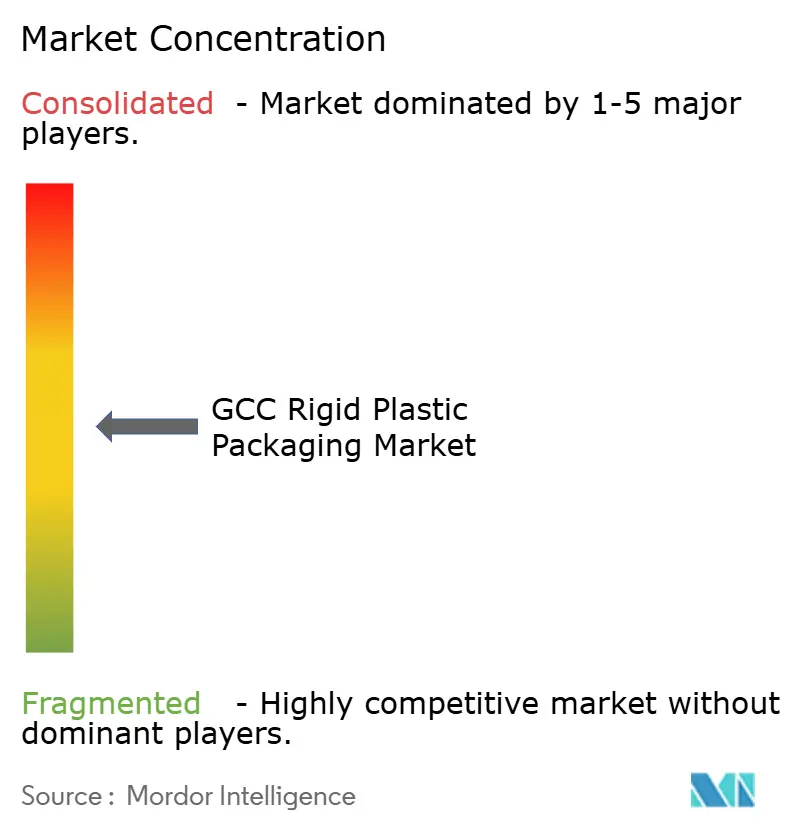
| Market Concentration | Medium |
Major Players *Disclaimer: Major Players sorted in no particular order Image © Mordor Intelligence. Reuse requires attribution under CC BY 4.0. | |
GCC Rigid Plastic Packaging Market Analysis by Mordor Intelligence
The GCC rigid plastic packaging market size in terms of shipment volume is projected to be 4.36 Billion tons in 2025, 4.51 Billion tons in 2026, and reach 5.25 Billion tons by 2031, growing at a CAGR of 3.08% from 2026 to 2031. Converters are accelerating design-for-recycling and lightweighting programs because feedstock allocations are now tied to domestic value-add rules, while Saudi Arabia’s ethane price hikes are nudging resin selection toward polypropylene and recycled polyethylene terephthalate. Bottled-water demand, anchored by chronic water scarcity, keeps polyethylene terephthalate bottle output high, and pharmacy-retail chains expanding beauty and wellness ranges are stimulating demand for premium high-density polyethylene jars and closures. Across the GCC rigid plastic packaging market, European tethered-cap rules are cascading into export specifications, spurring a surge in rHDPE closure projects. At the same time, green-hydrogen investments are steering integrated producers toward low-carbon polypropylene and PET pathways that promise long-term cost and emissions advantages.
Key Report Takeaways
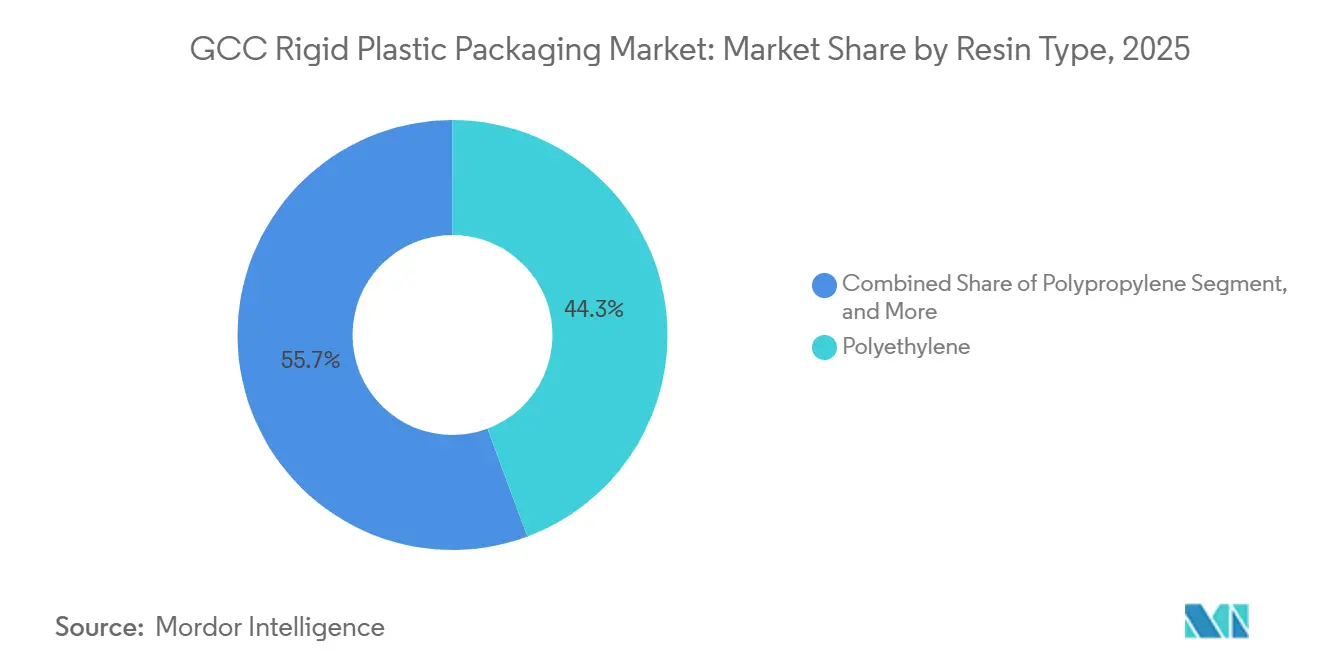
- By resin type, polyethylene held 44.32% of the GCC rigid plastic packaging market share in 2025, while recycled PET within the “other” category is projected to rise at a 4.04% CAGR through 2031.
- By product type, bottles and jars led with 39.32% revenue share in 2025, and caps and closures recorded the fastest 4.23% CAGR to 2031.
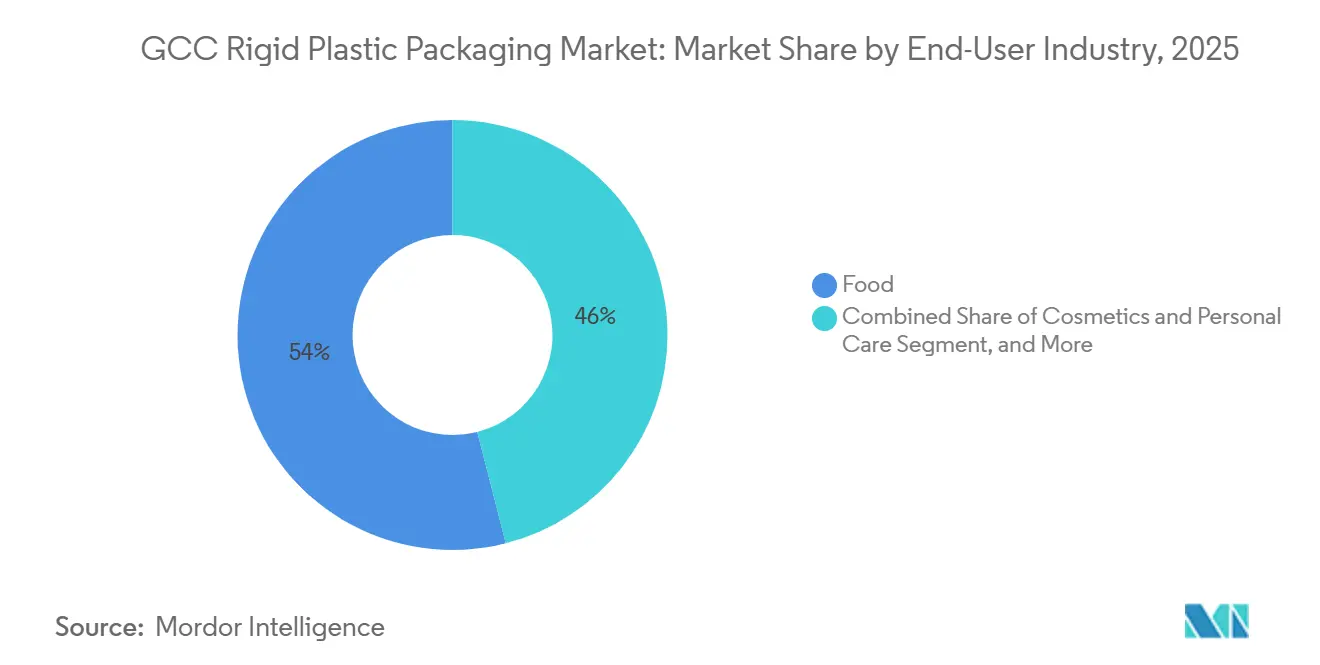
- By end-user, food applications accounted for 53.98% of the GCC rigid plastic packaging market size in 2025, whereas cosmetics and personal care advance at a 4.41% CAGR over the forecast period.
- By manufacturing process, blow molding represented 47.32% of the 2025 volume, but thermoforming is set to expand at a 4.98% CAGR.
- By geography, Saudi Arabia captured 61.12% of the 2025 volume, and the United Arab Emirates is forecast to post a 3.63% CAGR through 2031.
Note: Market size and forecast figures in this report are generated using Mordor Intelligence’s proprietary estimation framework, updated with the latest available data and insights as of 2026.
GCC Rigid Plastic Packaging Market Trends and Insights
Drivers Impact Analysis*
| Driver | (~) % Impact on CAGR Forecast | Geographic Relevance | Impact Timeline |
|---|---|---|---|
| Low-Carbon PP and PET from Green Hydrogen Hubs | +0.9% | Saudi Arabia, United Arab Emirates | Long term (≥ 4 years) |
| Regulatory Push for Recyclable Rigid Plastics | +0.8% | United Arab Emirates, Saudi Arabia, with spillover to Qatar, Oman | Medium term (2-4 years) |
| Expansion of GCC Bottled-Water and Beverage Industries | +0.6% | Saudi Arabia, United Arab Emirates, Rest of GCC | Short term (≤ 2 years) |
| Industry 4.0 Capacity Build-out in Local Converters | +0.5% | Saudi Arabia, United Arab Emirates, Oman | Medium term (2-4 years) |
| Shelf-Life Extension Needs in Food and Pharmaceuticals | +0.4% | Saudi Arabia, United Arab Emirates, Qatar | Short term (≤ 2 years) |
| Logistics Cost-Down via Lightweight Conversion | +0.3% | Global, with early gains in United Arab Emirates, Saudi Arabia | Short term (≤ 2 years) |
| Source: Mordor Intelligence | |||
Low-Carbon PP and PET from Green Hydrogen Hubs
Saudi Arabia and the United Arab Emirates are financing electrolysis projects that feed new olefin routes, letting producers cut cradle-to-gate emissions by up to 60% compared with naphtha cracking.[1]Gulf Petrochemicals and Chemicals Association, “GCC Petrochemical Capacity Outlook 2025,” gpca.org.ae SABIC already runs a circular-feedstock pilot that turns post-consumer plastics into food-grade polypropylene and high-density polyethylene for caps and tubs, proving that low-carbon resin can clear safety tests without changing tooling. Emirates Biotech is building a 160 ktpa polylactic acid plant that will supply bio-based resin for trays and bottles when it starts up in 2028, widening the menu of drop-in options beyond fossil grades. Brand owners serving the European Union view these materials as a way to avoid future carbon-border taxes, so converters see early adoption as a route to premium contracts. As capacity scales, analysts expect price parity with conventional grades inside the next decade, unlocking double-digit share for low-carbon resins in GCC rigid plastic packaging.
Regulatory Push for Recyclable Rigid Plastics
Dubai’s Waste Management Law No. 18 of 2024 assigns collection and recycling duties to producers and imposes fines up to AED 500,000 on firms that ship non-recyclable packs, pushing converters toward mono-material bottles and trays.[2]Dubai Municipality, “Law No. 18 of 2024 on Waste Management,” dm.gov.ae Saudi Arabia’s Ministry of Environment, Water, and Agriculture targets a 35% municipal recycling rate by 2028, which is forcing package designers to drop carbon-black colorants and PVC layers that obstruct optical sorters. Converters that certify 25-30% recycled content now receive eco-modulation fee discounts under the United Arab Emirates’ 2026 extended producer responsibility scheme, improving payback on wash-flake and re-pelletizing lines. As a result, design-for-recycling checklists have become mandatory in every new mold approval. The regulatory drumbeat is steering even export packs toward rPET and rHDPE, reshaping resin demand across the GCC.
Expansion of GCC Bottled-Water and Beverage Industries
Per-capita renewable freshwater in the Gulf is below 200 m³, well below the United Nations scarcity threshold, so households and restaurants continue to rely on packaged water despite desalination gains.[3]Economic and Social Commission for Western Asia, “Water Desalination in the GCC 2024,” unescwa.org Tetra Pak has already delivered 12 billion tethered caps that comply with European Union rules, and many of those closures now appear on Gulf export lines, lifting demand for high-density polyethylene and polypropylene components. Pharmacy chains are rolling out functional drinks that require lightweight PET bottles with tamper-evident lids, adding new SKUs to already-busy blow-molding halls. Hotels and tourism sites reopening after pandemic restrictions are further boosting single-serve water sales. These layered trends secure bottled beverages as a volume anchor for GCC rigid plastic packaging over the next five years.
Industry 4.0 Capacity Build-out in Local Converters
Gulf Print & Pack 2025 displayed injection and thermoforming cells fitted with real-time vision systems that trim scrap by up to 12%, and several Saudi and Emirati converters placed orders at the show. Hotpack Global is investing SAR 1 billion to automate scheduling and predictive maintenance across its rigid-container network, which is expected to reduce lead times from 1 week to 2 days. Oman’s Ladayn Polymer Programme installed digital twins that test thinner-gauge sheet recipes virtually before physical trials, speeding market entry for new pack formats. These upgrades help plants absorb resin-price shocks by reducing waste and energy consumption. As efficiency gaps close with European peers, local converters become more attractive partners for multinational food and pharma brands.
Restraints Impact Analysis*
| Restraint | (~) % Impact on CAGR Forecast | Geographic Relevance | Impact Timeline |
|---|---|---|---|
| Feedstock and Resin Price Volatility | -0.7% | Saudi Arabia, United Arab Emirates, Rest of GCC | Short term (≤ 2 years) |
| End-of-Life Waste and Landfill Concerns | -0.5% | United Arab Emirates, Saudi Arabia, Qatar | Medium term (2-4 years) |
| Emerging Extended-Producer-Responsibility Fees | -0.4% | United Arab Emirates, Saudi Arabia | Medium term (2-4 years) |
| Water-Scarcity Policies Capping Petro-expansions | -0.3% | Saudi Arabia, with spillover to Oman, Bahrain | Long term (≥ 4 years) |
| Source: Mordor Intelligence | |||
Feedstock and Resin Price Volatility
Saudi Aramco’s jump in ethane tariffs from USD 1.75 to USD 2.50 per MMBtu narrowed polyethylene producer spreads by roughly USD 150 per ton, a squeeze quickly passed to converters through quarterly contracts. Smaller firms without long-term supply deals now face input price swings of 15-25% every quarter, making it hard for food brands to lock in fixed-price packaging. Many buyers respond by shifting volumes to polypropylene or recycled PET, dampening near-term growth for commodity HDPE bottles. Hedging strategies such as dual sourcing or toll compounding are gaining popularity, but they also add complexity and cost. Until pricing steadies, capital spending on new polyethylene lines is likely to stay cautious.
End-of-Life Waste and Landfill Concerns
GCC cities recycle less than 15% of their municipal solid waste, and only three urban centers operate sorting plants capable of handling rigid plastics at scale. Dubai’s source-segregation fines create a compliance burden for restaurants and retailers, yet material recovery capacity still lags behind collection targets. KAPSARC estimates the region must invest USD 12-25 billion in recycling infrastructure by 2030 to reach 30% plastic circularity, a figure that many municipalities view as daunting. Without fast progress, brand owners risk reputational hits, and some have started switching to paperboard or aluminum for premium SKUs. Landfill concerns, therefore, cap growth prospects for rigid plastics unless recovery rates improve markedly.
*Our forecasts treat driver/restraint impacts as directional, not additive. The impact forecasts reflect baseline growth, mix effects, and variable interactions.
Segment Analysis
By Resin Type: Recycled PET Momentum Builds
Polyethylene commanded 44.32% of 2025 volume, retaining its position in milk jugs, detergent bottles, and pallet wraps. Yet the GCC rigid plastic packaging market for recycled PET is projected to grow fastest, expanding at a 4.04% CAGR through 2031 as eco-modulated fees reward high post-consumer content. Early movers source certified, food-grade rPET flakes even at a 5-10% premium, banking on future fee savings and brand equity gains. Certified circular polypropylene and rHDPE portfolios also expand, but supply still lags PET due to limited mechanical recovery streams.
Converters continue to re-engineer PET bottles for lighter neck finishes, shaving gram weight to offset fee outlays. High-density polyethylene remains indispensable for chemical and 20-liter water coolers thanks to impact resistance, and polypropylene attracts cost-sensitive buyers after the ethane hike. Expanded polystyrene loses share amid single-use bans, while PLA enters export-oriented tray niches ahead of the 2028 commissioning of UAE PLA capacity. With every reformulation, recyclability scoring now shapes specification sign-off in the GCC rigid plastic packaging market.


By Product Type: Caps and Closures Outpace Bottles
Bottles and jars accounted for 39.32% of 2025 sales and still anchor the beverage, edible oil, and pharma niches. The coming period, however, sees caps and closures growing at 4.23% CAGR as tethered-cap mandates reach Gulf exporters. Lightweight designs cut resin by up to 25% per unit, and rHDPE versions qualify for fee rebates, amplifying savings. A single upgrade cycle can swap 30 mm water-bottle caps for 26 mm versions, taking 1.5 g of polymer out of every unit, a compelling lever inside the GCC rigid plastic packaging market.
Modified-atmosphere packaging for meats drives the rising demand for trays and containers. These trays benefit from thermoforming advances, allowing them to maintain puncture resistance even at thinner gauges. Meanwhile, intermediate bulk containers and drums carve out their industrial niche by adhering to UN performance codes. Reusable crates and pallets, though modest contributors, are gaining traction with logistics sustainability teams.
By End-User Industry: Beauty and Wellness Surge
Food accounted for 53.98% of 2025 tonnage, covering confectionery, dairy, and chilled meat lines that rely on tight oxygen barriers to extend shelf-life. Cosmetics and personal care, though smaller, grow at a 4.41% CAGR, driven by pharmacy chains adding private-label lines. Airless pumps, double-wall jars, and premium finishes generate margin uplift, encouraging converters to run small-lot, multi-cavity injection programs. The GCC rigid plastic packaging market share tied to beverages also grows with functional drinks, while healthcare expands in step with chronic-disease drug volumes.
Coatings manufacturers are transitioning to in-mold-label designs, which is resulting in a consistent and stable demand for building-construction buckets. At the same time, industrial chemicals are increasingly relying on high-density polyethylene intermediate bulk containers to ensure the safe handling and storage of aggressive contents. Furthermore, the agriculture and consumer durables sectors are making notable contributions to the market. The agriculture sector is driving demand through the use of seed bags, while the consumer durables sector is adding incremental volume with appliance housings, collectively enhancing the diversification of the customer base.
By Manufacturing Process: Thermoforming Pushes Lightweight Frontier
Blow molding retained 47.32% of 2025 throughput as the default for commodity bottles, but thermoforming is on track for the strongest 4.98% CAGR. Material-reduction algorithms have significantly improved the control of sheet thickness, enabling a substantial reduction in PET thickness for Modified Atmosphere Packaging (MAP) trays from 600 µm to 450 µm. This reduction has been achieved while ensuring that no stacking failures occur, thereby maintaining the structural integrity of the trays.
The GCC rigid plastic packaging market, linked to thermoformed trays, therefore expands faster, buoyed by poultry and seafood processors. Injection molding keeps pace in closures and custom jars, while extrusion supplies sheet to in-house form-fill-seal lines. Compression molding remains niche in thick-walled chemical drums, but digital twins are beginning to reduce tooling cycles and may broaden its future role.
Geography Analysis
Saudi Arabia, with 61.12% of the 2025 volume, benefits from population scale, Vision 2030 incentives, and a pharmacy-retail boom that lifts demand for healthcare and beauty packaging. Yet higher ethane tariffs compress polyethylene economics and nudge converters toward polypropylene and recycled PET blends. SABIC’s 2026 pivot toward circular feedstocks and Takween’s 170 ktpa footprint reinforce local supply resilience, even as producer responsibility fees loom.
The United Arab Emirates, with a forecast 3.63% CAGR, positions itself as a circular-economy hub. ADNOC’s USD 817 million supplier program, upcoming 160 ktpa PLA output, and a live extended producer responsibility framework all encourage recycled-content adoption. New corrugated and rigid-container plants in Ras Al Khaimah and Kezad shorten lead times for e-commerce and food exporters, sharpening the UAE’s regional logistics advantage inside the GCC rigid plastic packaging market.
The rest of GCC members, Qatar, Oman, Kuwait, and Bahrain, deploy industrialization blueprints to capture import-substitution gains. Qatar’s 1.7 Mtpa HDPE complex supplies resin at competitive prices, Oman’s nine-plant Ladayn initiative adds 435 jobs and flexible-rigid capacity, and Bahrain expands cap volume with Tamkeen support. Kuwait and Bahrain focus on pharmaceutical and specialty containers where quick runs and proximity outweigh scale, avoiding direct clashes with Saudi and Emirati majors.
Competitive Landscape
The GCC rigid plastic packaging market is characterized by moderate concentration, with the five largest players accounting for 35-40% of installed capacity. SABIC’s January 2026 USD 950 million divestment of non-core assets frees capital for certified circular feedstock, giving the company a first-mover advantage with European importers constrained by carbon tariffs. Takween maintains a 170 ktpa network across 10 factories, even after capital restructuring, serving cross-border food and industrial chemical accounts that prize on-time delivery over eco labels.
Hybrid strategies emerge. Commodity-volume leaders chase feedstock cost leadership through long-term ethane contracts, while specialty converters exploit fee rebates via recycled content and tethered-cap innovation. Greif’s reconditioned IBC rollout slices 30-40% off customer packaging budgets, and Hotpack’s Industry 4.0 retrofit shifts the service level frontier by syncing plant output with retailer stock dashboards. Mergers such as Schoeller Allibert-IPL in 2025 show that reusable packaging scale matters, signaling a consolidation wave that could elevate the GCC rigid plastic packaging industry’s capital intensity.
Bio-based resin trays, mass-balance-certified closures, and mechanical-recycling toll services present new opportunities, though smaller converters find them challenging. Newcomers, such as Emirates Biotech with its PLA complex, target export-focused beauty and ready-meal brands, enticing them with a 10-15% premium for a commitment to low-carbon initiatives. Thus, the industry landscape equally weighs cost leadership against sustainability differentiation.
GCC Rigid Plastic Packaging Industry Leaders
Zamil Plastic Industries Co.
Al Bayader International
Mauser Packaging Solutions
Saudi Plastic Factory Company
KANR for Plastic Industries
- *Disclaimer: Major Players sorted in no particular order

Recent Industry Developments
- January 2026: SABIC divested USD 950 million in non-core assets to finance expansion of certified-circular feedstocks for tethered caps and ocean-bound polypropylene.
- January 2026: United Caps confirmed PPWR compliance readiness, shifting to green power while chain-of-custody standards mature in the region.
- October 2025: SABIC and Coveris launched a closed-loop medical-packaging pilot that returns healthcare plastics to food-grade HDPE.
- September 2025: Blue Ocean Closures unveiled fiber-based caps capable of cutting plastic content by 95%, pending humidity trials in Gulf conditions.


GCC Rigid Plastic Packaging Market Report Scope
The GCC Rigid Plastic Packaging Market Report is Segmented by Resin Type (Polyethylene, Polyethylene Terephthalate, Polypropylene, Polystyrene and EPS, Other Resin Types), Product Type (Bottles and Jars, Trays and Containers, Caps and Closures, Intermediate Bulk Containers (IBCs), Drums, Other Product Types), End-user Industry (Food, Beverage, Healthcare and Pharmaceuticals, Cosmetics and Personal Care, Industrial Chemicals, Building and Construction, Other End-user Industries), Manufacturing Process (Injection Moulding, Blow Moulding, Thermoforming, Compression Moulding, Extrusion), and Geography (Saudi Arabia, United Arab Emirates, Rest of GCC). The Market Forecasts are Provided in Terms of Volume.
By Resin Type
| Polyethylene | High-Density Polyethylene (HDPE) |
| Low-Density Polyethylene (LDPE) | |
| Linear Low-Density Polyethylene (LLDPE) | |
| Polyethylene Terephthalate | |
| Polypropylene | |
| Polystyrene and EPS | |
| Other Resin Types |
By Product Type
| Bottles and Jars |
| Trays and Containers |
| Caps and Closures |
| Intermediate Bulk Containers (IBCs) |
| Drums |
| Other Product Types |
By End-user Industry
| Food | Candy and Confectionery |
| Dairy and Frozen | |
| Meat, Poultry and Seafood | |
| Other Food Types | |
| Beverage | |
| Healthcare and Pharmaceuticals | |
| Cosmetics and Personal Care | |
| Industrial Chemicals | |
| Building and Construction | |
| Other End-user Industries |
By Manufacturing Process
| Injection Moulding |
| Blow Moulding |
| Thermoforming |
| Compression Moulding |
| Extrusion |
By Country
| Saudi Arabia |
| United Arab Emirates |
| Rest of GCC |
| By Resin Type | Polyethylene | High-Density Polyethylene (HDPE) |
| Low-Density Polyethylene (LDPE) | ||
| Linear Low-Density Polyethylene (LLDPE) | ||
| Polyethylene Terephthalate | ||
| Polypropylene | ||
| Polystyrene and EPS | ||
| Other Resin Types | ||
| By Product Type | Bottles and Jars | |
| Trays and Containers | ||
| Caps and Closures | ||
| Intermediate Bulk Containers (IBCs) | ||
| Drums | ||
| Other Product Types | ||
| By End-user Industry | Food | Candy and Confectionery |
| Dairy and Frozen | ||
| Meat, Poultry and Seafood | ||
| Other Food Types | ||
| Beverage | ||
| Healthcare and Pharmaceuticals | ||
| Cosmetics and Personal Care | ||
| Industrial Chemicals | ||
| Building and Construction | ||
| Other End-user Industries | ||
| By Manufacturing Process | Injection Moulding | |
| Blow Moulding | ||
| Thermoforming | ||
| Compression Moulding | ||
| Extrusion | ||
| By Country | Saudi Arabia | |
| United Arab Emirates | ||
| Rest of GCC | ||


Key Questions Answered in the Report
How large is the GCC rigid plastic packaging market in 2026?
It is valued at USD 4.51 billion tons, on track to reach USD 5.25 billion tons by 2031.
Which resin grows fastest through 2031?
Recycled PET leads, expanding at a 4.04% CAGR as extended producer responsibility fees favor high post-consumer content.
What segment holds the biggest GCC rigid plastic packaging market share today?
Bottles and jars remain the largest product type, representing 39.32% of 2025 volume.
Why are caps and closures attracting new investment?
EU tethered-cap rules and local lightweight programs lift demand, driving a 4.23% CAGR through 2031.
Which country offers the highest growth outlook?
The United Arab Emirates posts the fastest 3.63% CAGR, buoyed by circular-economy policies and new PLA capacity.
How concentrated is supplier power?
Moderate, with the five leading converters holding about 35-40% of capacity, reflected in a concentration score of 3.
Page last updated on:


