Market Overview
| Study Period | 2021 - 2031 |
|---|---|
| Forecast Data Period | 2026 - 2031 |
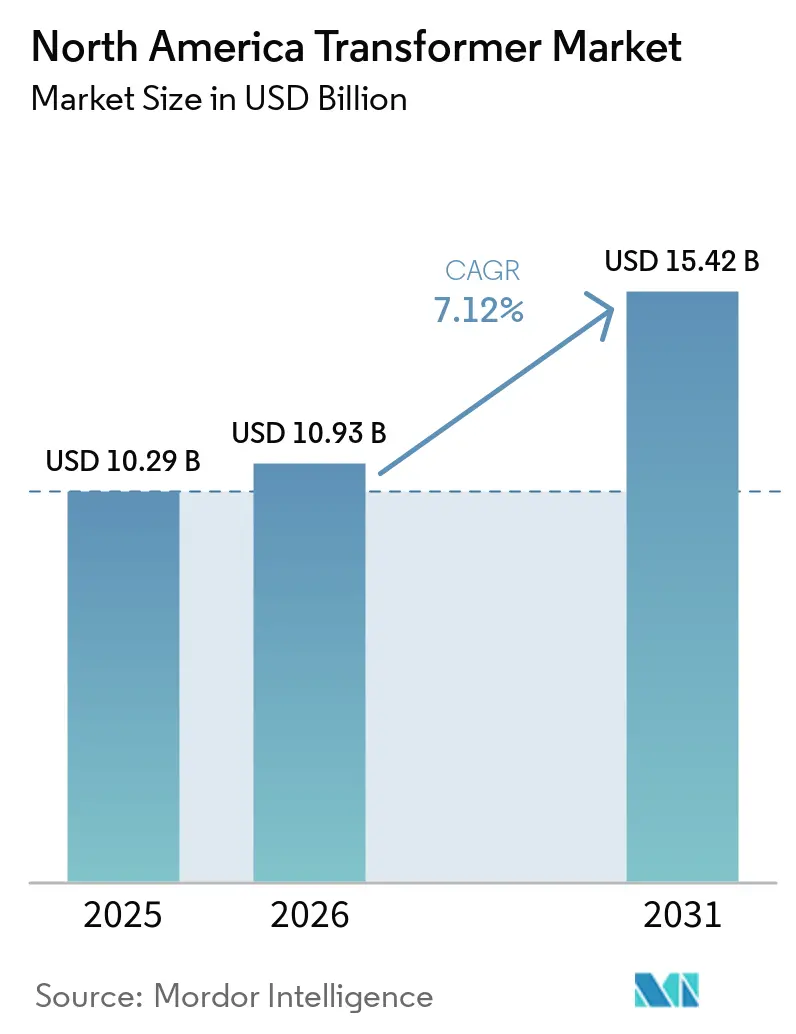
| Base Year Market Size (2025) | USD 10.29 Billion |
| Market Size (2026) | USD 10.93 Billion |
| Market Size (2031) | USD 15.42 Billion |
| Growth Rate (2026 - 2031) | 7.12% CAGR |
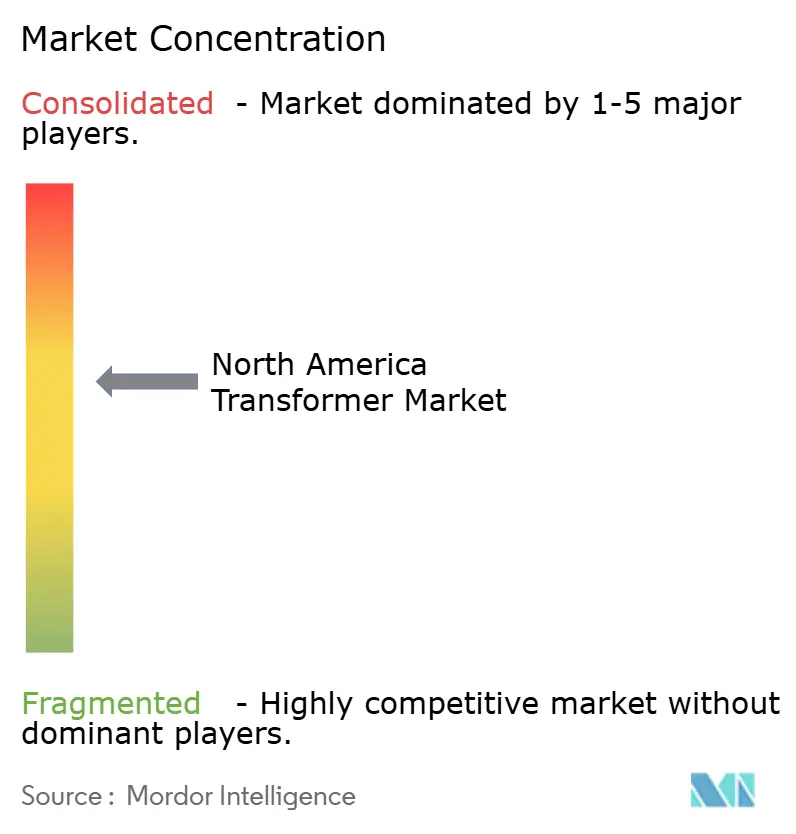
| Market Concentration | Medium |
Major Players *Disclaimer: Major Players sorted in no particular order Image © Mordor Intelligence. Reuse requires attribution under CC BY 4.0. | |
North America Transformer Market Analysis by Mordor Intelligence
The North America Transformer Market size was valued at USD 10.29 billion in 2025 and is estimated to grow from USD 10.93 billion in 2026 to reach USD 15.42 billion by 2031, at a CAGR of 7.12% during the forecast period (2026-2031).
A record wave of grid-modernization mandates, steep renewable-integration targets, and the swelling electrical appetite of hyperscale data centers are converging to reshape utility spending priorities. Transmission owners are accelerating the retirement of legacy assets that average more than 40 years in service, while federal and provincial funding programs under the Infrastructure Investment and Jobs Act and Canada’s Green Infrastructure Plan are underwriting a new class of long-haul and offshore-wind interconnections.[1]Natural Resources Canada, “Clean Electricity Infrastructure,” nrcan.gc.ca At the same time, chronic transformer lead-time inflation, now 20-28 months for units above 100 MVA, has prompted utilities and renewable developers to preorder equipment even before siting approvals, effectively front-loading the North America Transformer market’s order book. Supplies of copper and grain-oriented electrical steel remain tight, but vertical-integration moves by leading OEMs such as Siemens Energy and GE Vernova are partly insulating margins and stabilizing contract prices.[2]National Fire Protection Association, “NFPA 850 Standard 2025,” nfpa.org
Key Report Takeaways
- By power rating, small transformers captured 48.1% of the North America Transformer market share in 2025, while large units above 100 MVA are projected to post the fastest 8.1% CAGR through 2031.
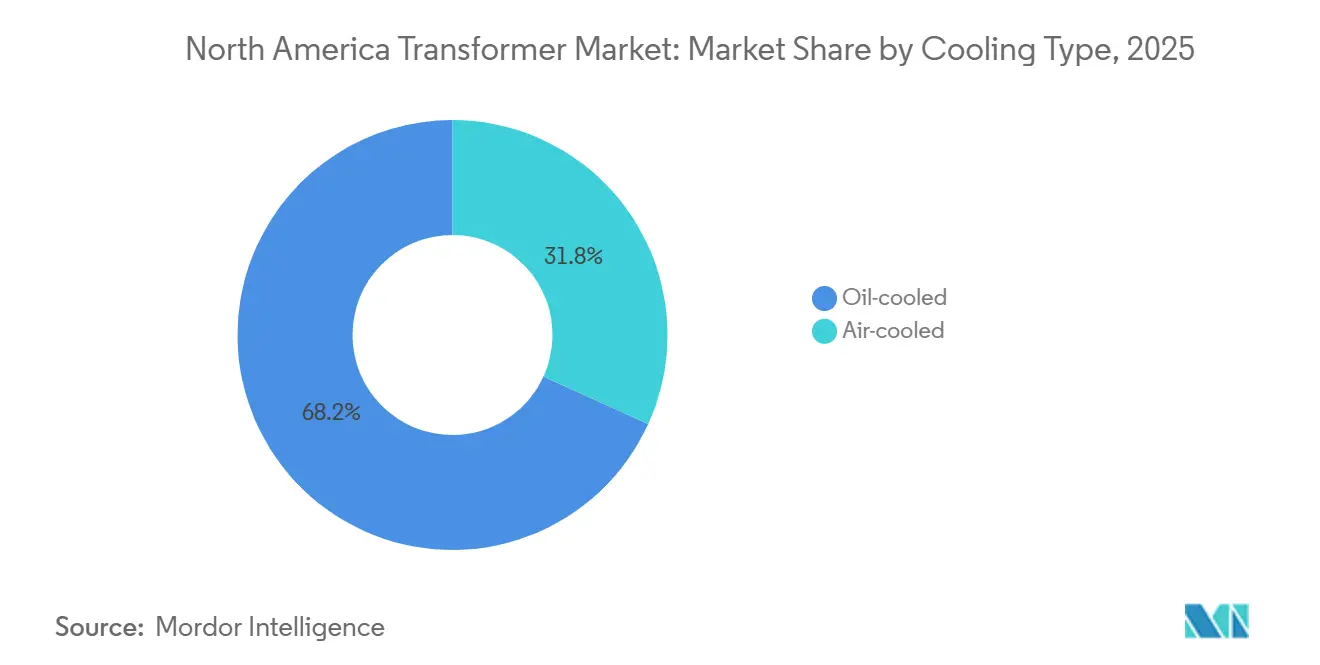
- By cooling type, oil-cooled designs led with 68.2% share in 2025; air-cooled units are expected to grow at a 7.9% CAGR on the back of stricter urban fire codes.
- By phase, three-phase configurations accounted for a 69.7% share in 2025 and are expected to grow at a rate of 7.5%, driven by interstate transmission projects.
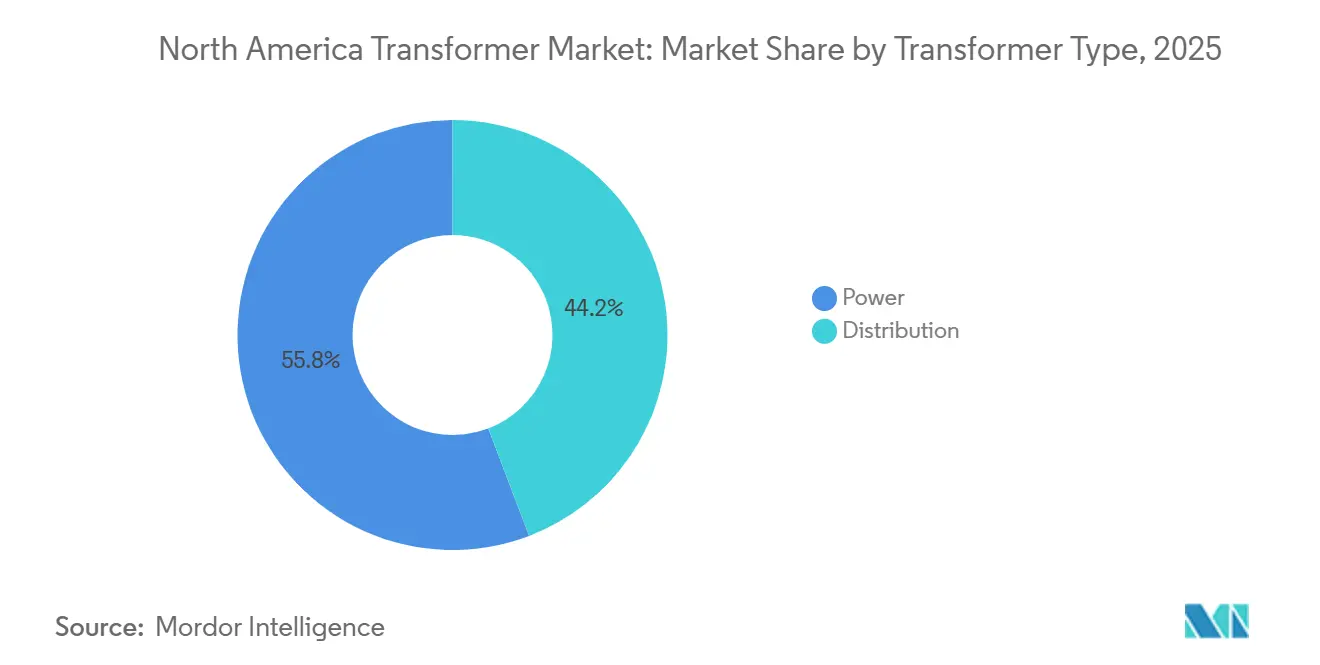
- By transformer type, power transformers accounted for 55.8% of the North America Transformer market size in 2025 and are expected to advance at a 7.7% CAGR to 2031.
- By end user, power utilities held 63.5% revenue in 2025, yet industrial facilities are expected to advance at 8.3% CAGR owing to near-shoring and semiconductor-fab construction.
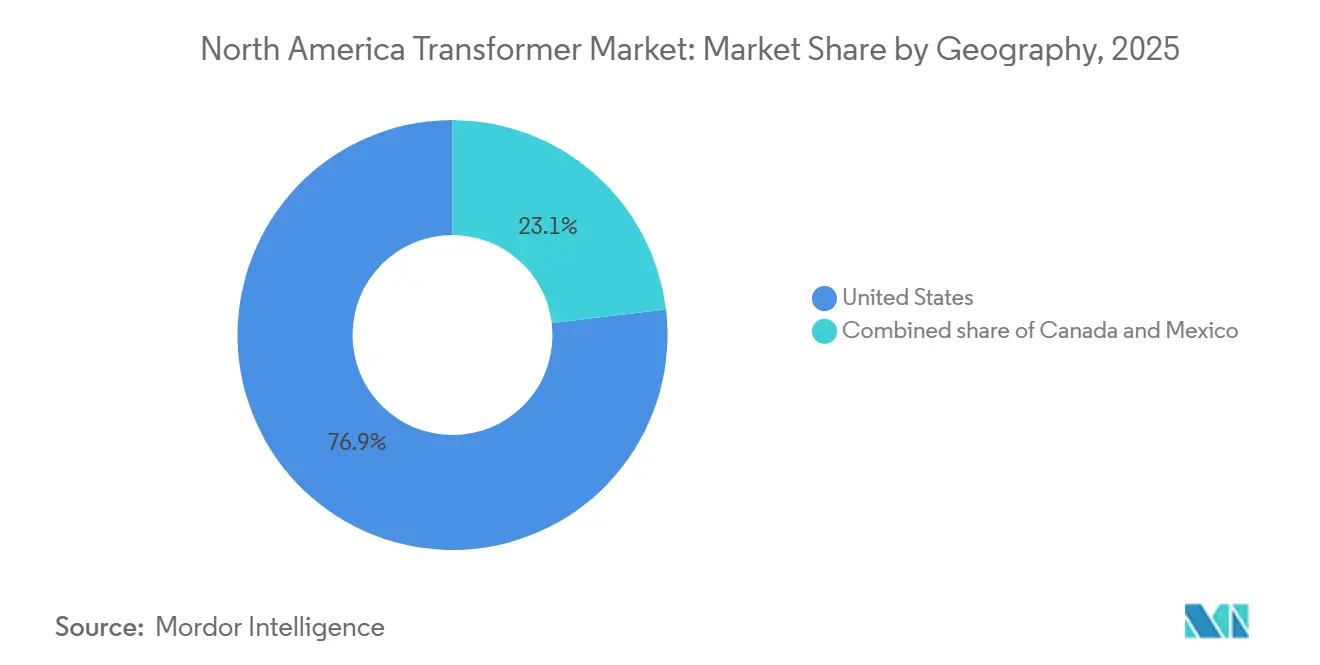
- By geography, the United States led with 76.9% share in 2025 and is expected to advance at 7.6% CAGR leadership through 2031.
Note: Market size and forecast figures in this report are generated using Mordor Intelligence’s proprietary estimation framework, updated with the latest available data and insights as of 2026.
North America Transformer Market Trends and Insights
Drivers Impact Analysis*
| Driver | (~) % Impact on CAGR Forecast | Geographic Relevance | Impact Timeline |
|---|---|---|---|
| Grid modernization programs across US & Canada | 1.8% | United States (ERCOT, PJM, CAISO), Canada (BC, Quebec, Ontario) | Medium term (2-4 years) |
| Renewable build-out requiring step-up transformers | 1.5% | United States (Texas, California, Midwest wind belt), Canada (Alberta, Saskatchewan) | Long term (≥ 4 years) |
| Replacement of aging transmission infrastructure | 1.2% | United States (Northeast, Midwest legacy grids), Canada (Ontario, Quebec) | Long term (≥ 4 years) |
| Federal funding via IIJA & Canadian Green Infrastructure | 1.0% | United States (DOE Grid Deployment Office priority corridors), Canada (interprovincial links) | Short term (≤ 2 years) |
| HVDC converter transformers for offshore wind links | 0.7% | United States (Atlantic Coast, Great Lakes), Canada (Maritime provinces) | Medium term (2-4 years) |
| Data-center electrification of on-site substations | 0.9% | United States (Virginia, Texas, Oregon), Canada (Quebec hydro zones), Mexico (Querétaro) | Short term (≤ 2 years) |
| Source: Mordor Intelligence | |||


Grid Modernization Programs Across US & Canada
North American utilities are tackling an aging fleet of transmission transformers whose average 42-year age already exceeds the original design life. The Federal Energy Regulatory Commission finalized Order 1920 in 2024, compelling regional operators to plan multistate projects that require transformers rated 230 kV and higher, thereby locking in large-unit demand for the rest of the decade.[3]Federal Energy Regulatory Commission, “Order 1920 Transmission Planning,” ferc.gov PJM alone budgeted USD 5.2 billion for transmission upgrades in 2025-2027, with transformer procurement constituting nearly one-third of that outlay.[4]PJM Interconnection, “Transmission Expansion Planning,” pjm.com On the Canadian side, Hydro-Québec is extending asset life via dissolved-gas monitoring and thermal imaging, deferring replacements by up to seven years and creating an eventual bulge of orders in the late 2020s. This two-speed dynamic positions the United States as the near-term engine of the North America Transformer market, while Canada provides a predictable medium-term pipeline.
Renewable Build-Out Requiring Step-Up Transformers
Every new solar or wind project enters the grid through step-up transformers that elevate generator voltages from below 5 kV to at least 115 kV. The United States added 32 GW of solar capacity in 2025, translating into roughly 600 pad-mounted units rated 2.5-5 MVA each. Offshore wind compounds the opportunity: Vineyard Wind and South Fork Wind utilize 66 kV subsea arrays feeding 300-500 MVA onshore converter transformers, with each transformer costing USD 8-12 million and requiring 24-30 months to build. Alberta and Saskatchewan are mirroring this trend, each 250 MW wind farm demanding four collector transformers plus one substation unit above 100 MVA. Lead-time mismatch against fast-tracked renewable schedules is forcing developers to pre-order equipment, pulling forward demand into the current planning horizon.
Federal Funding via IIJA & Canadian Green Infrastructure
The Infrastructure Investment and Jobs Act carved out USD 65 billion for grid upgrades, of which USD 10.5 billion flows directly to transmission hardware that relies on large power transformers. Corridors such as TransWest Express and Plains & Eastern Clean Line alone will consume more than 40 units rated above 300 MVA by 2030. Canada’s CAD 30 billion (USD 22 billion) Green Infrastructure Plan is channeling resources into the 1,200 km Atlantic Loop, expected to require 18-22 power transformers between 150 MVA and 300 MVA. Funding schemes cover up to 60% of cap-ex, accelerating utility commitment while Buy-America provisions push foreign OEMs to localize coil and core production, elongating ramp-up schedules by three-to-five months.
HVDC Converter Transformers for Offshore Wind Links
Converter transformers sit at the heart of long-distance subsea HVDC systems that ferry offshore wind power to coastal load centers. The Bureau of Ocean Energy Management leased eight Atlantic zones with a combined 25 GW potential, each gigawatt requiring two to three 300-500 MVA converter transformers. New York’s 9 GW offshore roadmap calls for five onshore stations, collectively demanding at least ten converters, a pipeline that Siemens Energy and Hitachi Energy have targeted by expanding factory footprints in North Carolina and Virginia. The Great Lakes pilot at Icebreaker Wind validated freshwater sites where corrosion risk is lower, trimming maintenance costs by 15-20% and opening new inland demand nodes.
Restraints Impact Analysis*
| Restraint | (~) % Impact on CAGR Forecast | Geographic Relevance | Impact Timeline |
|---|---|---|---|
| Rising distributed energy resources (DER) penetration | -0.8% | United States (California, Hawaii, Northeast), Canada (Ontario net-metering zones) | Medium term (2-4 years) |
| Volatility in copper & grain-oriented steel prices | -0.6% | North America-wide, with acute impact on long-cycle projects | Short term (≤ 2 years) |
| Emergence of solid-state transformers | -0.3% | United States (urban microgrids, military bases), Canada (remote communities) | Long term (≥ 4 years) |
| Long lead-times delaying cap-ex decisions | -0.5% | United States (investor-owned utilities), Canada (provincial Crown corporations) | Short term (≤ 2 years) |
| Source: Mordor Intelligence | |||
Rising Distributed Energy Resources (DER) Penetration
Behind-the-meter solar, storage, and microturbines together accounted for 22% of new capacity in California and 18% in New York during 2025, trimming utility peak loads and deferring substation upgrades that would otherwise include distribution transformers. Hawaii reached a 47% DER share, allowing the utility to postpone transformer replacements as mid-day curtailment eroded throughput needs. Ontario’s net-metering program offset 180 MW of distribution demand in 2025, translating into 8-10 fewer transformer orders for Hydro One. The financial ripple extends to stranded-asset risk: regulators may disallow full cost recovery on transformers whose revenue-earning life shortens, prompting utilities to delay new purchases despite asset-health warnings. Although DER growth remains largely distribution-level, a tipping point could arrive as vehicle-to-grid schemes mature, further cannibalizing centralized transformer utilization.
Volatility in Copper & Grain-Oriented Steel Prices
Copper and grain-oriented electrical steel together represent roughly 60% of a large transformer’s material cost. Copper climbed from USD 9,200 /t in early 2024 to USD 10,800 /t mid-2025 on Latin-American mine disruptions, before retreating to USD 9,600 /t in late 2025, a 17% swing captured in London Metal Exchange settlements. GOES tracked higher to USD 2,850 /t as Chinese export quotas tightened and U.S. mills focused on lower-carbon grades. These gyrations prompted utilities to slice tenders into smaller lots, fragmenting demand and delaying revenue conversion for OEMs. Eaton and Schneider Electric reported order backlogs up 20% year-over-year, but deliveries slipped as customers invoked force-majeure clauses to ride out the pricing storm. While vertical integration into electrical-steel mills offers some insulation, most manufacturers continue to index frame contracts to commodity benchmarks, leaving the North America Transformer market exposed to raw-material turbulence.
*Our forecasts treat driver/restraint impacts as directional, not additive. The impact forecasts reflect baseline growth, mix effects, and variable interactions.
Segment Analysis
By Power Rating: Transmission-Class Units Accelerate
Large transformers above 100 MVA accounted for a modest slice of 2025 shipments but are forecast to clock an 8.1% CAGR through 2031, a pace that will lift their North America Transformer market share to near 30% by the end of the period. This growth stems from 230-500 kV backbone projects and offshore-wind converter stations, where one transformer unlocks 200-500 MW of transfer capacity. Medium-power units between 10 MVA and 100 MVA remain the workhorses of industrial parks and data-center campuses, expanding at a steady 7.0%. Small transformers up to 10 MVA captured 48.1% of 2025 revenue and continue to underpin rural network resilience. Yet the capital allocation pendulum is swinging: GE Vernova saw orders for >150 MVA units double in 2025, versus 4% growth in sub-10 MVA bookings, a signpost that utilities are prioritizing bulk power over last-mile redundancy.
Second-order impacts cascade throughout the supply chain. Core-steel slitting lines must accommodate 20- to 30-ton laminations, while tank fabricators are investing in heavier cranes to maneuver 400-MVA shells. Logistics bottlenecks are also emerging; only a handful of rail corridors can handle 500-kV class loads without special clearances, adding weeks to delivery windows. Nonetheless, the margin profile of large units, often twice that of distribution-class equipment, entices OEMs to reallocate factory bays, tightening supply for smaller ratings and inadvertently inflating prices for rural cooperatives.
By Cooling Type: Oil Dominance Faces Air-Cooled Challenge
Oil-filled transformers retained a 68.2% hold on the North America Transformer market size in 2025, thanks to proven thermal headroom and low initial cost, yet urban fire codes and environmental liabilities are chipping away at their dominance. NFPA 850’s 2025 update mandates secondary containment and automatic suppression for indoor oil-filled units, adding up to USD 150,000 in site costs for a mid-sized installation. Dry-type air-cooled transformers circumvent these expenses, explaining their forecast 7.9% CAGR through 2031. The migration is most acute in hyperscale data centers, hospitals, and mass-transit hubs, where downtime economics dwarf the 15-20% acquisition premium.
Biodegradable ester fluids, led by Cargill’s Envirotemp FR3, blur the binary between liquid and dry types, offering fire points above 300 °C and simplified spill remediation. Utilities in California wildfire zones and New York watershed districts have already standardized ester fills for new 69 kV-class units. Yet ester adoption in high-voltage tiers remains nascent due to fluid viscosity limits, leaving air-cooled equipment the preferred route for 10-35 kV indoor substations. OEMs are responding with vacuum-pressure impregnated (VPI) coils and advanced epoxy resins that dissipate heat more efficiently, narrowing the efficiency gap to mineral-oil units.


By Phase: Three-Phase Systems Dominate, But Rural Holdouts Persist
Three-phase transformers held 69.7% of 2025 shipments and will climb in lockstep with interstate transmission expansion at a 7.5% clip, reinforcing their position as the backbone of bulk-power exchange. Cost efficiency compounds the appeal: a 25 MVA three-phase unit typically costs 30-40% less on a per-MVA basis than a trio of equivalent single-phase units, once civil works and switchgear footprints are tallied. Industrial facilities gravitate to the balanced loads and simplified protection schemes inherent in three-phase operation, making them the default for semiconductor fabs and EV-battery plants.
Single-phase units remain entrenched in sparsely populated corridors where feeder density is under ten customers per mile. Rural cooperatives rely on their lighter weight and lower pole-top installation complexity. Nevertheless, rising adoption of bidirectional power flows from rooftop solar and electric-vehicle chargers is forcing even these utilities to consider three-phase upgrades to mitigate voltage imbalance. Mitsubishi Electric’s 2025 hybrid single-phase design with integrated voltage regulation targets this pain point, yet early pilots suggest utilities prefer a wholesale conversion as feeder rebuilds coincide with fiber-optic broadband rollouts.
By Transformer Type: Power Units Extend Their Lead
Power transformers secured 55.8% of the North America Transformer market size in 2025 and are tracking toward a 7.7% CAGR through 2031, buoyed by FERC Order 1920’s mandate for expanded interregional transfer capacity. Distribution transformers will grow at a healthy 6.5%, mainly on the strength of data-center and industrial campus substations. However, their relative share is set to erode as utilities see greater throughput bang-for-buck in 230-345 kV upgrades versus blanket pole-top replacements. Lead-time asymmetry amplifies the pivot: Hitachi Energy’s power-transformer backlog stretched to 28 months in late 2025, double that of distribution-class lines, steering production resources toward higher-margin, high-voltage equipment.
Digitization is another axis of competition. ABB’s Ability-enabled power transformers incorporate fiber-optic temperature probes, dissolved-gas sensors, and vibration analytics that feed digital twins, reducing unplanned outages by up to 40% and justifying a 10-15% price premium. Distribution-class products are starting to follow suit, but face cost-sensitivity barriers among rural utilities that still purchase on the lowest bid.
By End User: Industrial Demand Beats Utility Growth
Power utilities remained the primary customer group at 63.5% of 2025 revenue, yet their CAGR outlook of 7.0% trails the industrial user segment’s 8.3%. Semiconductor fabs, EV battery gigafactories, and advanced auto plants are springing up across Mexico’s Bajío corridor and the U.S. Midwest, each requiring on-site 15-50 MVA substations to skirt congested utility feeders. Industrial buyers favor short, predictable lead times over rock-bottom prices, a sweet spot for mid-tier manufacturers such as Northern Transformer and ERMCO that promise deliveries within 14-16 months, compared with 20-24 months from global OEMs.
Commercial facilities, chiefly data centers, will expand at a 7.8% CAGR as AI workloads push campus power densities beyond 100 MW. Dominion Energy has already green-lit five 230 kV extensions in Northern Virginia to cater to these loads, each necessitating multiple 40 MVA transformers. Residential demand lags at 6.2% CAGR, constrained by slowing single-family housing starts and the rising penetration of rooftop solar that shaves net-load growth.
Geography Analysis
The United States generated 76.9% of regional transformer revenue in 2025 and is on course for a 7.6% CAGR through 2031 as ERCOT, CAISO, and PJM simultaneously pursue capacity expansions. Texas alone added 12 GW of renewable energy in 2025, translating into demand for roughly 200 step-up units and reinforcing the North America Transformer market’s reliance on the Lone Star State. California’s offshore wind plans shift specification toward 300-500 MVA HVDC converters, while the Northeast grapples with rights-of-way constraints that tilt spend toward distribution-class replacements.
Canada contributes a smaller but strategically pivotal slice of demand. British Columbia’s Site C dam energized six 500 kV transformers in late 2024, and Hydro-Québec’s trio of planned HVDC links will call for at least a dozen 300 MVA converters by 2029. Provincial Crown corporations purchase on decade-long planning cycles, giving OEMs a clear line-of-sight on volume but limiting year-to-year upside.
Mexico’s market is pivoting on near-shoring winds. Foreign direct investment hit USD 36 billion in 2025, compelling the Comisión Federal de Electricidad to earmark MXN 85 billion (USD 5 billion) for new substations, 22% of which will be transformer spend. Execution risks persist, bureaucratic tenders and limited domestic manufacturing capacity mean many ≥ 100 MVA units will still be imported from the United States, extending delivery pipelines. Yet demand will crest in 2027-2029 as manufacturing campuses ramp to full load, offering a buffer should U.S. utility orders soften.
Competitive Landscape
North America’s transformer supply base is moderately concentrated: Hitachi Energy, Siemens Energy, GE Vernova, ABB, and Schneider Electric together accounted for 55% of 2025 revenue, but none exceeded a 15% individual share, supporting healthy bid competition. Above 100 MVA, the market tightens into an oligopoly of seven manufacturers, limited by the capital required for 500 kV test bays and high-voltage bushings. In contrast, the < 10 MVA distribution segment comprises more than 20 regional players that differentiate on service radius and 12-14-month lead-time commitments.
Strategic plays center on domestic capacity. Hitachi Energy is investing USD 200 million to double large-power output at its Virginia plant by 2027, directly targeting offshore-wind projects along the Atlantic. Siemens Energy secured electrical-steel self-supply by acquiring 40% of AK Steel’s GOES division in 2025, shaving up to 12% off core material costs and dampening exposure to volatile imports. SPX Transformer Solutions opened a Wisconsin facility dedicated to 10-100 MVA units, exploiting the service-turnaround niche coveted by industrial buyers.
Technology is the other battleground. ABB’s sensor-rich Ability platform and GE Vernova’s digital-twin suite promise predictive-maintenance savings that resonate with utilities under pressure to curb outage durations. Solid-state transformer startups secured USD 180 million in ARPA-E grants and venture funding during 2024-2025, but cost premiums of 3-4× keep them in pilot status. Amorphous-core products aimed at no-load loss reductions below 50 kV are picking up in California and New York, yet brittle core handling still limits volume production.
North America Transformer Industry Leaders
General Electric Company
Schneider Electric SE
Emerson Electric Co.
Eaton Corporation PLC
Siemens Energy AG
- *Disclaimer: Major Players sorted in no particular order

Recent Industry Developments
- January 2026: CG Power and Industrial Solutions Limited secured its largest export contract, valued at INR 900 crore (USD 99.2 million), from Tallgrass Integrated Logistics Solutions LLC, United States. The contract involves supplying high-reliability power transformers for a hyperscale data center project. The transformers will be designed, manufactured, and tested in India, showcasing the company's engineering and manufacturing capabilities. Deliveries are scheduled over 12 to 20 months under FAS Mumbai Port (Incoterms 2020).
- September 2025: Waaree Energies announced strategic acquisitions to expand its transformer and renewable energy portfolio. The acquisition of Kotsons enhances its transformer business and creates export opportunities, including UL-certified transformers for the U.S. market. However, this development emphasizes global transformer supply chain integration rather than direct growth in U.S. manufacturing.
- March 2025: ABB invested in DG Matrix, based in North Carolina, to commercialize solid-state transformer solutions. These solutions aim to improve power electronics for AI data centers and microgrids, supporting the development of next-generation transformer-like systems in the U.S. and advancing efficient, compact grid infrastructure technologies.
- March 2025: ABB expanded its U.S. transformer manufacturing capabilities with an investment of approximately USD 120 million. This funding increases production capacity at facilities in Tennessee and Mississippi, supporting the growth of transformers and essential distribution equipment for utilities, data centers, and industrial users across North America.


North America Transformer Market Report Scope
The transformer market encompasses the global industry engaged in the design, manufacturing, testing, installation, and maintenance of electrical transformers. These transformers are used to adjust voltage levels, either stepping up or stepping down, to ensure safe and efficient power transmission and distribution. They play a vital role in power generation, transmission, distribution, and end-use applications.
The North America transformer market report is segmented by power rating (large (above 100 MVA), medium (10 to 100 MVA), and small (up to 10 MVA)), cooling type (air-cooled and oil-cooled), phase (single-phase and three-phase), transformer type (power and distribution), end-user (power utilities, industrial, commercial, and residential), and Geography (United States, Canada, and Mexico). The market sizes and forecasts are provided in terms of value (USD).
By Power Rating
| Large (Above 100 MVA) |
| Medium (10 to 100 MVA) |
| Small (Up to 10 MVA) |
By Cooling Type
| Air-cooled |
| Oil-cooled |
By Phase
| Single-Phase |
| Three-Phase |
By Transformer Type
| Power |
| Distribution |
By End-User
| Power Utilities (includes, Renewables, Non-renewables, and T&D) |
| Industrial |
| Commercial |
| Residential |
By Geography
| United States |
| Canada |
| Mexico |
| By Power Rating | Large (Above 100 MVA) |
| Medium (10 to 100 MVA) | |
| Small (Up to 10 MVA) | |
| By Cooling Type | Air-cooled |
| Oil-cooled | |
| By Phase | Single-Phase |
| Three-Phase | |
| By Transformer Type | Power |
| Distribution | |
| By End-User | Power Utilities (includes, Renewables, Non-renewables, and T&D) |
| Industrial | |
| Commercial | |
| Residential | |
| By Geography | United States |
| Canada | |
| Mexico |


Key Questions Answered in the Report
How fast is the North America Transformer market expected to grow to 2031?
It is forecast to rise from USD 10.93 billion in 2026 to USD 15.42 billion by 2031 at a 7.12% CAGR.
Which power-rating segment is expanding the quickest?
Transformers above 100 MVA lead with an expected 8.1% CAGR as utilities reinforce 230-500 kV backbones.
Why are air-cooled transformers gaining share?
Updated NFPA 850 fire-safety rules and urban environmental constraints favor dry-type units despite a 15-20% price premium.
What external factor most threatens transformer project economics?
Volatile copper and grain-oriented steel prices can swing material costs by more than 15%, prompting order deferrals.
Which country drives most regional revenue?
The United States contributed 76.9% in 2025 and should retain leadership thanks to ERCOT, CAISO, and PJM grid programs.
How concentrated is supplier competition?
The top five manufacturers hold about 55% share, indicating moderate concentration that still allows regional specialists to thrive.
Page last updated on:


