
GCC Paper Cup Market Size and Share
Market Overview
| Study Period | 2020 - 2031 |
|---|---|
| Forecast Data Period | 2026 - 2031 |
| Base Year Market Size (2025) | USD 376.21 Million |
| Market Size (2026) | USD 389.16 Million |
| Market Size (2031) | USD 469.72 Million |
| Growth Rate (2026 - 2031) | 3.83 % |
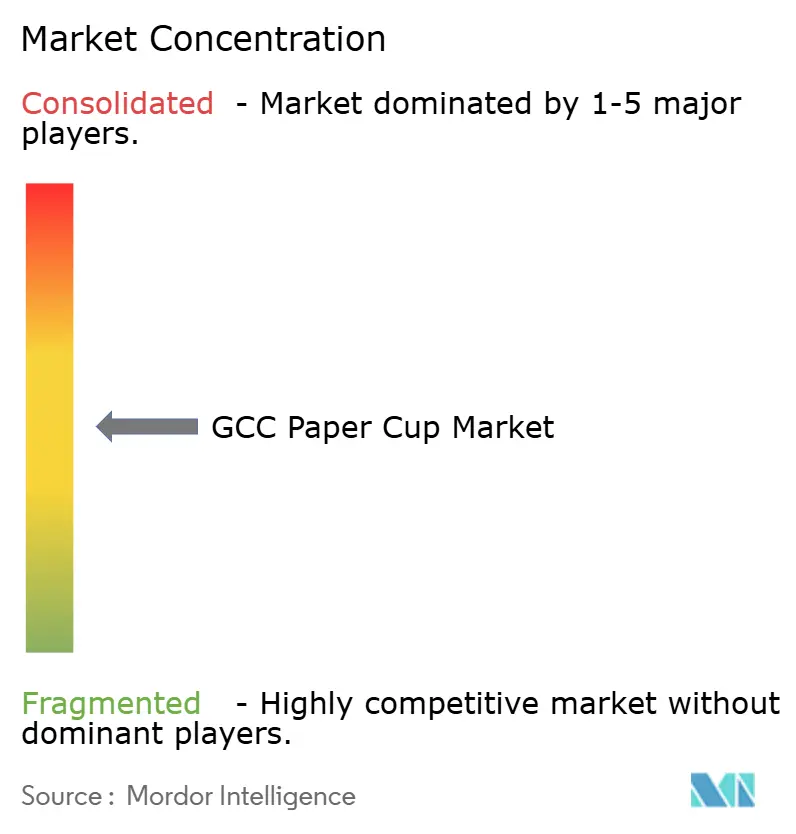
| Market Concentration | Medium |
Major Players *Disclaimer: Major Players sorted in no particular order Image © Mordor Intelligence. Reuse requires attribution under CC BY 4.0. | |
GCC Paper Cup Market Analysis by Mordor Intelligence
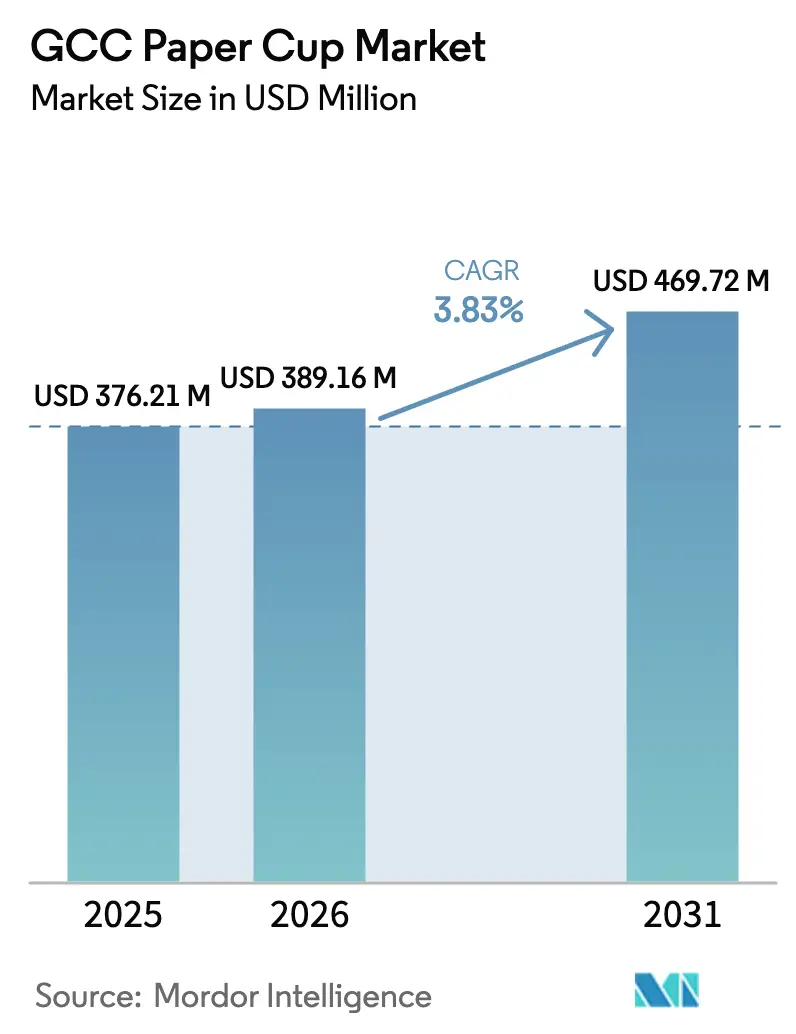
The GCC paper cup market size is projected to expand from USD 376.21 million in 2025 and USD 389.16 million in 2026 to USD 469.72 million by 2031, registering a CAGR of 3.83% between 2026 to 2031. Mandatory single-use plastic bans, especially the UAE’s January 2026 prohibition on plastic beverage cups and lids, are accelerating substitution toward paper formats despite unit-cost premiums of 15-25% for polyethylene-coated (PE) cups. Quick-service restaurant (QSR) expansion, led by Starbucks’ plan to add 500 new stores in the Middle East and Saudi Arabia’s 18.5% annual growth in branded coffee outlets, is amplifying baseline demand as takeaway beverages dominate traffic mixes. Converters are reacting by locking in lightweight containerboard supply from new lines such as Middle East Paper Company’s PM5, yet near-term capacity gaps are pushing import volumes higher and lengthening order lead times. At the same time, pulp-price swings from a Producer Price Index peak of 187 in April 2025 to 119 in August 2025 are squeezing converter margins even as buyers leverage spot-market declines to demand price relief.
Key Report Takeaways
- By application, QSRs led with 49.53% of the GCC paper cup market share in 2025, while vending machines posted the fastest 5.34% CAGR through 2031.
- By cup type, hot formats dominated the GCC paper cup market with 57.43% share in 2025, whereas cold cups are growing at a 4.32% CAGR through 2031.
- By coating type, PE variants accounted for 64.23% of market share in 2025, while PLA-coated cups posted a 4.89% CAGR through 2031.
- By wall type, single-wall designs maintained 61.32% of the GCC paper cup market share in 2025; double-wall versions are advancing at 4.66% CAGR.
- By capacity, 8-12 oz cups captured 46.66% of market share in 2025, and cups above 20 oz are the fastest-growing segment at a 5.12% CAGR.
- By sales channel, direct B2B controlled 53.43% of market share in 2025, yet distributor and wholesaler routes are expanding at 4.98% CAGR.
- By country, Saudi Arabia held 35.53% of 2025 revenue and Qatar is projected to expand at a 5.02% CAGR to 2031.
Note: Market size and forecast figures in this report are generated using Mordor Intelligence’s proprietary estimation framework, updated with the latest available data and insights as of January 2026.
Market Trends and Insights
Drivers Impact Analysis of GCC Paper Cup Market*
| Driver | (~) % Impact on CAGR Forecast | Geographic Relevance | Impact Timeline |
|---|---|---|---|
| Rising Demand for On-the-Go Beverage Consumption | +0.9% | Saudi Arabia, UAE, Qatar | Medium term (2-4 years) |
| Growth of Quick Service Restaurant Chains | +1.1% | Saudi Arabia, UAE, Kuwait | Medium term (2-4 years) |
| Mandatory Single-Use Plastics Regulations in GCC | +1.3% | UAE (immediate), Saudi Arabia, Qatar | Short term (≤ 2 years) |
| Event-Driven Tourism Boosting Foodservice Volumes | +0.6% | Qatar, UAE, Saudi Arabia | Medium term (2-4 years) |
| Emerging Demand for Home-Compostable Barrier Coatings | +0.4% | UAE, Saudi Arabia | Long term (≥ 4 years) |
| Localization Incentives for Sustainable Packaging Manufacturing | +0.7% | Saudi Arabia, UAE | Long term (≥ 4 years) |
| Source: Mordor Intelligence | |||
Growth of Quick Service Restaurant Chains
Saudi Arabia hosted 3,550-plus branded coffee outlets in 2025 and continues to add stores nationwide, while Starbucks intends to open 500 additional Middle East units, creating a powerful volume engine for single-use cups. Dunkin’ already operates more than 600 Saudi stores, and franchisee Alamar Foods reported 64% digital revenue in 2024, indicating that take-away beverages are integral to omnichannel growth. Density is surging in Riyadh, Jeddah, and Dubai, yet smaller cities such as Dammam and Sharjah are also attracting chains, broadening the served addressable market. This footprint expansion drives absolute cup demand and pushes chains toward premium double-wall or large-capacity formats to differentiate guest experience. Combined, these dynamics lift baseline consumption and underpin a structural leg of growth for the GCC paper cup market.
Mandatory Single-Use Plastics Regulations in GCC
Federal Decree-Law 18-2024 in the UAE bans plastic beverage cups and lids effective January 2026, with fines up to AED 200,000 for non-compliance, forcing immediate material substitution. Dubai Municipality mirrors the federal rule, and Saudi Arabia’s Green Initiative similarly targets landfill diversion, prompting foodservice operators to accelerate paper adoption. Qatar’s phased restrictions will culminate in a 2027 ban, aligning the bloc on paper as the de facto alternative. These mandates compress decision cycles, inflating spot pricing for compliant inventory by 20-30% when short supply collides with last-minute procurement. Uneven timelines also create regional arbitrage, as surplus PE-coated stock flows into Bahrain and Kuwait, where enforcement lags.
Event-Driven Tourism Boosting Foodservice Volumes
Dubai welcomed 17.2 million visitors in 2023, and the GCC hotel pipeline adds 392,000 rooms by 2030, 320,000 in Saudi Arabia alone, to serve mega-projects such as NEOM and the Red Sea corridor. Qatar’s World Cup legacy sustains 40,000-plus hotel rooms, keeping occupancy above 70% through 2025. Event calendars featuring Formula 1, shopping festivals, and global trade fairs create peak demand spikes that require hotels and caterers to double safety stock levels, resulting in higher paper cup call-offs. Large-capacity cold cups above 20 oz, needed for premium iced beverages, are consequently the fastest-growing size segment. Tourism-linked beverage programs, therefore, reinforce both volume and mix upgrades across the GCC paper cup market.
Emerging Demand for Home-Compostable Barrier Coatings
Multinational QSRs with net-zero pledges are piloting PLA-coated or bio-based linings that meet EN 13432 standards, such as BASF’s ecovio PS 1606, even though these variants carry 25-35% price premiums.[1]BASF Product Team, “ecovio® Compostable Plastics,” basf.com Academic studies show that boric-acid-crosslinked polyvinyl alcohol achieves oxygen transmission rates rivaling those of PE, pointing to future fossil-free pathways. PLA resin supply is tightening, lead times are 90-120 days versus 30-45 days for PE, yet converters with multinational clients accept the logistics burden to secure long-term share. While industrial composting is scarce, corporate sustainability departments increasingly specify compostable linings in anticipation of future collection infrastructure, giving early movers a strategic edge.
Restraints Impact Analysis of GCC Paper Cup Market*
| Restraint | (~) % Impact on CAGR Forecast | Geographic Relevance | Impact Timeline |
|---|---|---|---|
| Volatile Pulp Prices Squeezing Margins | -0.8% | GCC-wide | Short term (≤ 2 years) |
| Limited Regional Recycling Infrastructure | -0.5% | Saudi Arabia, UAE, Kuwait | Medium term (2-4 years) |
| Consumer Perception of Paper as “Not Fully Green” | -0.3% | UAE, Qatar | Long term (≥ 4 years) |
| High Initial Capex for Barrier-Coated Cup Lines | -0.4% | GCC converter base | Medium term (2-4 years) |
| Source: Mordor Intelligence | |||
Volatile Pulp Prices Squeezing Margins
The pulp Producer Price Index fell 36% in four months during 2025, leaving converters that hedged at the peak unable to pass through costs, while others without hedges faced earlier liquidity strain.[2]Board of Governors, “Producer Price Index—Pulp,” fred.stlouisfed.org GCC converters import 80-90% of virgin pulp, so currency swings and freight spikes amplify margin risks. Middle East Paper Company leverages recovered-fiber inputs, thereby gaining cost insulation, advantaging integrated players over converters dependent on spot pulp. Rapid price moves also deter capital expenditure, as lenders tighten credit lines when working-capital volatility rises. The net effect is a drag on near-term profitability, limiting funds available for technology upgrades across the GCC paper cup market.
Limited Regional Recycling Infrastructure
Only one UAE facility processes 10,000 tonnes of beverage carton and PE-lined paper waste annually, accounting for less than 2% of national paper and board disposal. Saudi Arabia and Qatar lack specialized cup-sorting lines, meaning most used cups end up in landfills, undermining environmental claims and raising reputational risk for brands. Draft extended-producer-responsibility rules in the UAE could shift collection costs onto converters, adding 5-10% to landed prices once enacted.[3]UAE Ministry of Climate Change and Environment, “Federal Law on Waste Management,” moccae.gov.ae Absence of composting networks renders PLA-lined cups effectively non-recyclable, further complicating sustainability narratives. This infrastructure gap tempers demand growth, especially among environmentally conscious consumers in the UAE and Qatar.
*Our forecasts treat driver/restraint impacts as directional, not additive. The impact forecasts reflect baseline growth, mix effects, and variable interactions.
GCC Paper Cup Market Segment Analysis
By Cup Type:
Accelerating Shift Toward Cold FormatsHot cups captured 57.43% of the GCC paper cup market share in 2025, tied to espresso-centric beverage menus, while cold cups are growing at a faster 4.32% CAGR as iced coffee and bubble tea appeal to the region’s under-35 population. Cold applications demand enhanced condensation resistance, prompting converters to invest in dual-coating assets capable of handling both PE and PLA runs. The GCC paper cup market for hot cups is expected to expand steadily, but its growth rate lags the cold-cup surge, which adds incremental high-margin volume.
Double-digit store openings by chains such as Starbucks, which integrates seasonal cold drinks, reinforce cold-cup momentum, while hot-cup demand benefits from institutional vending and morning commuter traffic. Cost sensitivity keeps PE variants dominant across both segments, though multinational QSRs are increasingly piloting PLA coatings for flagship outlets in Dubai and Doha. The interplay of premiumization and regulation, therefore, drives product-mix complexity inside the GCC paper cup market.



By Wall Type:
Premiumization Fuels Double-Wall AdoptionSingle-wall formats retained a 61.32% share in 2025, serving espresso shots, small vending sizes, and cost-focused institutional buyers. However, double-wall cups posted a robust 4.66% CAGR forecast, driven by QSR delivery models that require sustained beverage temperature during 15-30-minute transit times. The GCC paper cup market size is tied to double-wall cups, so it rises faster than overall demand, aided by chains substituting sleeves with integrated insulation to cut material costs.
Capital intensity of USD 1.5-2 million for sealing lines limits new entrants, concentrating value growth among larger converters. Municipal waste-volume fees under consideration in Dubai and Riyadh could temper double-wall uptake, yet brand-experience benefits still outweigh cost trade-offs for premium operators. As lightweight containerboard from PM5 becomes available, converters aim to shave 10-15% of fiber weight, protecting margins while meeting insulation specs, a critical lever inside the evolving GCC paper cup market.
By Capacity:
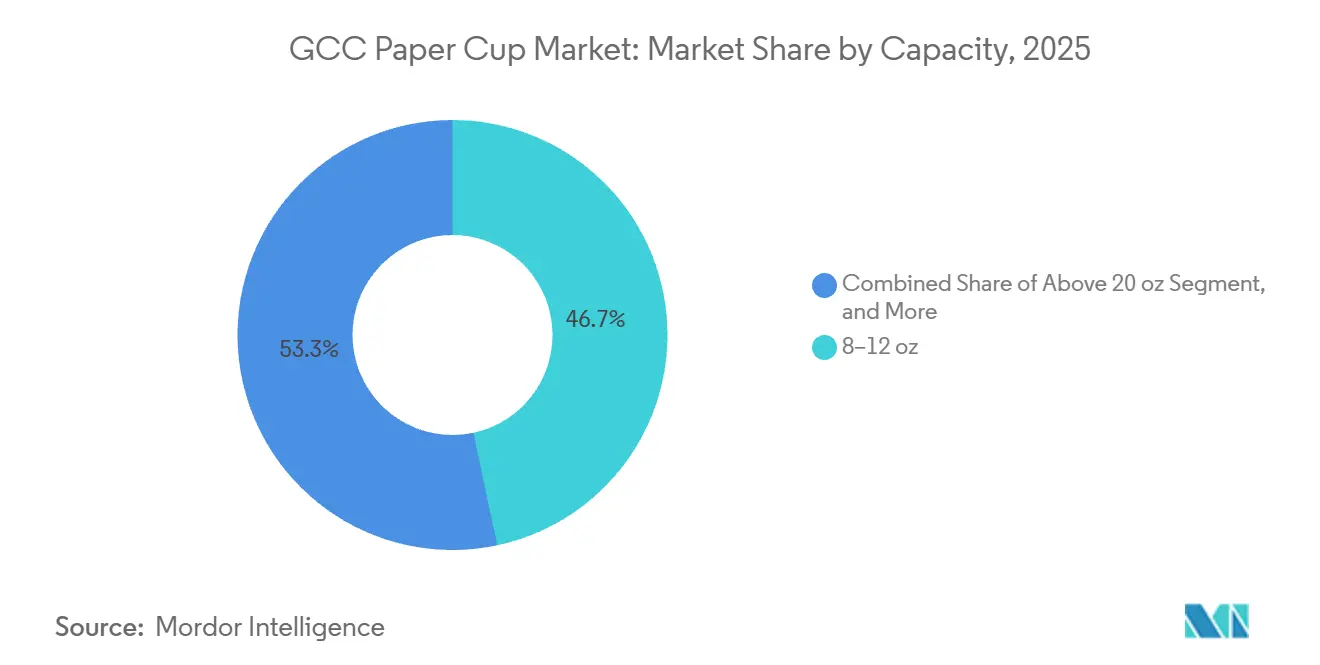
Large Formats OutperformCups of 8-12 oz commanded 46.66% share in 2025, reflecting standard latte and cappuccino portion sizes. Formats above 20 oz are accelerating at 5.12% CAGR, driven by specialty cold beverages in hotels and resort corridors where guest spend is highest. As a result, the GCC paper cup market for jumbo capacities is growing from a low base and delivers outsized revenue per thousand units.
Technical hurdles such as stiffer boards and ribbed walls raise unit costs by 25-35%, but consumers accept the premium pricing attached to large iced drinks. Mid-range 13-20 oz sizes benefit from meal-deal upsells at QSRs, while sub-7 oz shots hold niche roles in espresso service. Collectively, these shifts illustrate how beverage-program innovation is reshaping capacity demand inside the GCC paper cup market.

By Coating Type:
PE Dominates, PLA Gains TractionPE linings secured 64.23% of market share in 2025, buoyed by 20-30% cost advantages and shorter resin lead times of 30-45 days. PLA-coated cups, though with just a mid-teen share today, are expanding at a 4.89% CAGR, in line with corporate net-zero roadmaps. GCC paper cup market share for PLA is therefore widening fastest within upscale QSR and hospitality accounts.
Dubai’s definition of “plastic content” exemptions initially allowed PE-lined paper, but updated guidance tightens thresholds, favouring compostable alternatives. Water-based barriers remain below 5% volume, hindered by USD 2–3 million capex per coating head and slower drying cycles, yet R&D breakthroughs continue. Converters thus manage a three-tier portfolio, cost-led PE, sustainability-led PLA, and pilot water-based offerings to serve divergent buyer priorities inside the GCC paper cup market.
By Application:
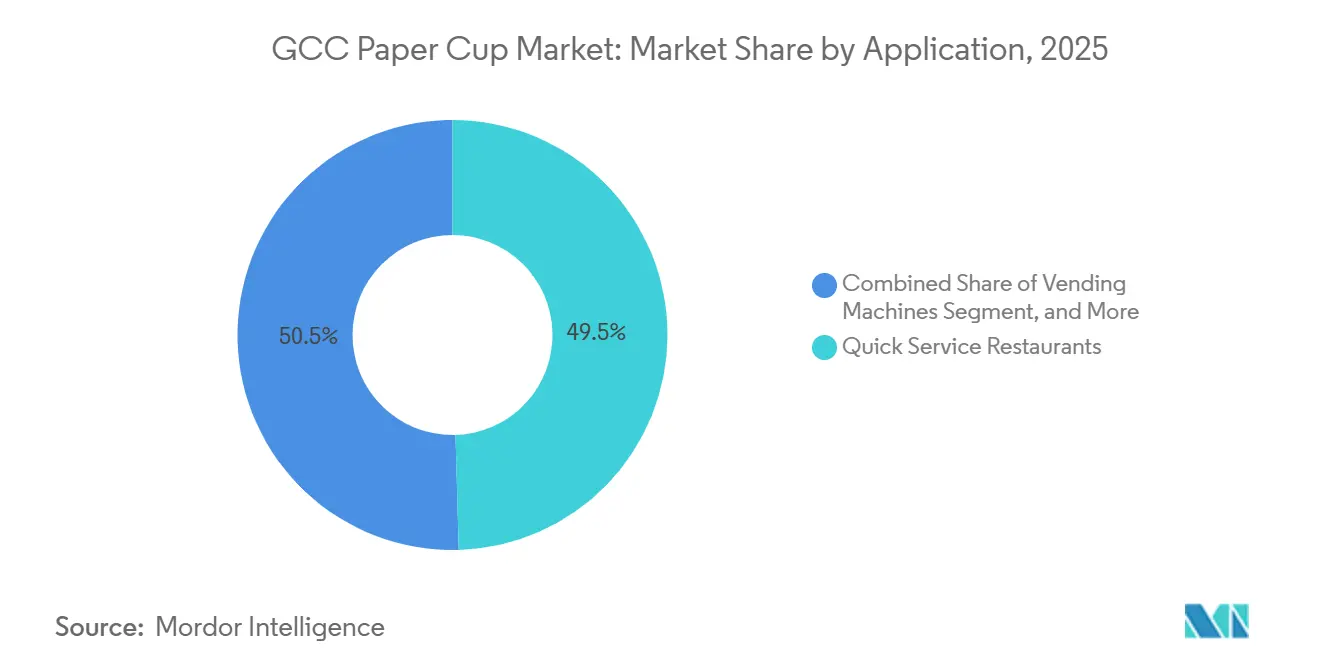
QSR Rules, Vending Machines SurgeQSRs controlled 49.53% of 2025 revenue as omnichannel ordering drove single-use cup volumes beyond dine-in traffic levels. Vending machines, growing at 5.34% CAGR, add complementary volume in metro stations and workplaces where smart kiosks now dispense customized beverages. Consequently, the GCC paper cup market size tied to the vending segment rises faster than overall growth.
Institutional catering absorbs mid-teens share and gravitates toward cost-efficient single-wall PE cups, while convenience stores implement self-serve coffee bars requiring 8-12 oz hot and 12-16 oz cold formats. Chain buyers increasingly request dual SKUs, one PE and one PLA, to align with varying ESG policies across corporate clients, complicating converter production planning across the GCC paper cup market.
By Sales Channel:
Distributors Gain MomentumDirect B2B shipments held 53.43% of 2025 revenue, reflecting large-account contracts with QSRs and hotel groups. Distributors and wholesalers clock a 4.98% CAGR by aggregating orders from independent cafés and smaller franchisees that need just-in-time delivery. The GCC paper cup market size accessed via distributor channels thus grows faster than direct sales, even though margins per carton are lower.
Converters such as Hotpack Global are building integrated distribution centers in Saudi Arabia to balance 60-90 day payment terms from major accounts against the liquidity benefits of 30-day distributor receivables. Inventory management, sustainability consulting, and regulatory advisory services are emerging differentiators for distributors, reinforcing channel relevance and fostering competitive variety inside the GCC paper cup market.
Geography Analysis
Saudi Arabia Paper Cup Market
Saudi Arabia generated 35.53% of GCC paper cup market share in 2025, supported by 3,550 branded coffee outlets, a USD 29–30 billion hotel-restaurant-institutional sector in 2023, and mega-projects that extend foodservice demand into greenfield zones. The PM5 containerboard line, doubling national capacity to 875,000 tonnes by Q4 2027, positions the kingdom to pivot from importer to exporter of cup-grade substrate. Localization incentives embedded in Vision 2030 further anchor domestic manufacturing, as converters seek in-kingdom status for government contracts.
Qatar and United Arab Emirates Paper Cup Market
Qatar, forecast to post a 5.02% CAGR through 2031, benefits from enduring World Cup infrastructure, a 40,000-room hotel base, and phased plastic restrictions that culminate in 2027. Centralized procurement amplifies direct B2B volumes, although the absence of local paperboard mills means converters rely on shipments from Saudi Arabia, the UAE, or Asia, which lengthens supply lines. The UAE blends high visitor counts, 17.2 million in 2023, with the region’s strictest plastic ban, steering buyers toward double-wall and PLA-coated products that attract premium pricing.
GCC Paper Cup Market
Kuwait, Bahrain, and Oman contribute smaller slices yet leverage QSR replication and tourism niches such as Bahrain’s Formula 1 circuit and Oman’s eco-resorts. Kuwait’s lagging enforcement schedule enables price-arbitrage plays where distributors offload PE-lined surplus from stricter markets, giving budget operators temporary cost relief. Bahrain and Oman, while volume-light, show disproportionate interest in compostable coatings aligned with eco-tourism positioning, indicating diversified opportunity sets across the GCC paper cup market.
Regulatory Landscape
Single-use plastics restrictions are a primary policy lever shaping paper cup demand across the GCC, with the UAE leading. UAE Federal Decree-Law 18-2024 bans plastic beverage cups and lids effective January 2026, with penalties that can reach AED 200,000, pushing foodservice operators to substitute into paper formats and to tighten supplier qualification for compliant inventories.
Beyond bans, market access is also influenced by food-contact and environmental compliance regimes. In Saudi Arabia, the Saudi Food and Drug Authority (SFDA) enforces food-contact material requirements, and import pathways often reference conformity frameworks such as SASO Green Label for eligible products. Across the region, buyers and border authorities increasingly request documentation such as conformity certificates, material declarations, and PFAS-free statements, while compostability claims for PLA and other bio-based linings are commonly tied to standards such as EN 13432 and ASTM D6400, which are also cited in municipal event-use guidelines (including Dubai Municipality requirements for licensed outdoor events).
Value Chain Analysis
The GCC paper cup value chain starts with pulp and paperboard (both virgin and recovered fiber), moves into coating and barrier materials (commonly PE, and increasingly PLA and other alternatives), and then into converting (printing, die cutting, cup forming, and rim or seam sealing), before secondary packaging and distribution into foodservice and institutional channels. The region continues to rely on imports for key inputs, including virgin fiber and specialized cupstock such as PE-coated paper rolls and ivory board, which keeps lead times and price pass-through sensitive to global pulp cycles and freight conditions.
Within the GCC, converting capacity is concentrated among regional packaging players such as ENPI Group (Dubai), Gulf East Paper and Plastic Industries (Dubai), Golden Paper Cups Manufacturing Co. LLC (Ajman), and Maimoon Papers Industry LLC (Umm Al Quwain). Logistics and trade facilitation through hubs such as Jebel Ali support aggregation, re-export, and replenishment to QSR and hospitality customers. Procurement is shifting toward bundled contracts that require end-to-end compliance packs, including PFAS-free test reports and compostability certificates where applicable, and these documentation and traceability needs are increasingly part of supplier selection alongside price and service levels.
Competitive Landscape
The GCC paper cup market is moderately fragmented, with regional converters Hotpack Global, Gulf East Paper and Plastic Industries, and Golden Paper Cups competing against global packaging majors Huhtamäki, Dart Container, and International Paper. Hotpack’s SAR 1 billion Saudi mega plant underscores a capacity land-grab that complements integrated mills such as Middle East Paper Company’s PM5, creating value-chain synergies from pulp to finished cups. Huhtamäki’s 2024 consolidation of UAE operations reflects pressure from pulp volatility and Asian imports, illustrating the margin squeeze facing scale players.
White space lies in home-compostable coatings and large-format cold cups, where entrants like Graphic Packaging secured USD 54 million innovation sales in 2024 by tackling condensation and rigidity challenges. Integrated producers with access to recovered fiber enjoy cost cushions, making Middle East Paper Company’s vertical expansion a potential disruptor if it forward-integrates into cup conversion. Mid-tier firms lacking either economies of scale or proprietary technology risk margin erosion, driving ongoing consolidation inside the GCC paper cup market.
Public capital is also reshaping the field. Saudi Arabia’s Public Investment Fund acquired a 23.08% stake in Middle East Paper Company for SAR 629.9 million in 2024, signaling sovereign-level commitment to domestic packaging capacity and giving MEPCO financing headroom to accelerate downstream ventures. Costa Coffee UAE’s shift to 95% wood-fiber cups, achieved through a multi-year supply agreement with local converters, illustrates how brand-owner procurement can lock in competitive advantage for sustainability-ready suppliers. Meanwhile, distributors such as Al Shirawi Packaging are layering inventory-management software and next-day delivery guarantees onto traditional wholesale models, creating service moats that smaller converters struggle to replicate.
GCC Paper Cup Industry Leaders
ENPI Group
Huhtamaki OYJ
Gulf East Paper & Plastic Industries LLC
Golden Paper Cups Manufacturing LLC
Maimoon Papers Industry LLC
- *Disclaimer: Major Players sorted in no particular order
GCC Paper Cup Market Companies Covered in this Report
- ENPI Group
- Huhtamäki Oyj
- Gulf East Paper & Plastic Industries LLC
- Hotpack Global LLC
- Golden Paper Cups Manufacturing LLC
- Maimoon Papers Industry LLC
- SAQR Pack
- Arkan Manufacturing Paper Cup Company
- Saham Group
- Ultracare LLC
- Falcon Pack
- Detpak (Detmold Group)
- Ecoware Solutions FZ-LLC
- Seda International Packaging Group SpA
- Dart Container Corporation
- Graphic Packaging International LLC
- International Paper Company
- Smurfit Westrock

Market Opportunities and Future Outlook
Regulatory-driven substitution and tighter compliance documentation are creating room for suppliers that can operationalize certified claims at scale. The UAE plastic beverage cup and lid ban effective January 2026 is already a concrete trigger for faster conversion of beverage programs toward paper, while Saudi Arabia compliance oversight (SFDA) and import conformity frameworks, including SASO-related requirements for many products, raise the value of suppliers that can provide complete technical files, traceability, and PFAS-free documentation as standard deliverables.
Shifts in product and channel mix also open more premium and specialization lanes. QSRs accounted for 49.53% of GCC paper cup revenue in 2025, and branded coffee outlet expansion in Saudi Arabia (3,550-plus outlets in 2025, alongside large international chain rollouts) sustains high-throughput takeaway use-cases that reward operational reliability and differentiated SKUs, including double-wall formats for delivery and larger cold cups with better condensation performance. At the same time, limited cup-recycling infrastructure and uneven enforcement timelines across GCC countries keep opportunities anchored in practical compliance, fit-for-purpose barriers (PE, PLA, and emerging water-based), and localized supply resilience, supported by closer-to-market inventory positioning through distributors and free-zone logistics.
Recent Industry Developments in GCC Paper Cup Market
- May 2026: Huhtamaki Egypt completed a cooling system upgrade at its Cairo flexible packaging site, transitioning to a water-cooled chiller to reduce energy consumption. The upgrade strengthens the regional manufacturing footprint and sustainability profile in Egypt, supporting regional demand for molded fiber and paper cup solutions.
- May 2025: Huhtamaki Egypt secured the Egyptian Cabinet Golden License to establish a 22,000 square meter molded fiber packaging plant in Sadat City, Menoufiya, with an investment of EGP 1.47bn. This regulatory-enabled expansion localizes production to support regional cup carriers and fiber packaging demand, reducing import dependency.
- January 2025: Huhtamaki Egypt received approval from the Egyptian Cabinet for a project to produce molded fiber packaging, including paper fruit trays and cup carriers. It provides a government-backed framework for expanding sustainable packaging capacity in the region.


GCC Paper Cup Market Report Scope and Research Methodology
Market Definition and Coverage
This market covers the value of paper cups sold for beverage and food service use across GCC countries, counted at the point where cups are supplied into local channels for commercial and institutional consumption.
Scope exclusions: We exclude plastic cups, reusable cups, and paper cup related equipment such as forming machines and printing systems.
Segments Covered in This Report
- By Cup Type
- Hot Paper Cup
- Cold Paper Cup
- By Wall Type
- Single Wall
- Double Wall
- By Capacity
- Up to 7 oz
- 8-12 oz
- 13-20 oz
- Above 20 oz
- By Coating Type
- PE-Coated
- PLA-Coated
- Water-Based Barrier
- By Application
- Quick Service Restaurants
- Institutional
- Convenience Stores and Kiosks
- Vending Machines
- Other Applications
- By Sales Channel
- Direct B2B
- Distributors and Wholesalers
- By Country
- Saudi Arabia
- United Arab Emirates
- Qatar
- Kuwait
- Rest of GCC
Data Sources, Market Sizing, and Validation
Desk Research
Desk research was used to set the basic demand and supply story for paper cups in the GCC and to avoid building the model from assumptions only. We reviewed public statistics and policy updates that drive substitution away from plastic, then checked trade flows to understand how much demand is met through imports versus local converting.
Sources referenced include, for example, GCC and country customs portals and UN Comtrade for HS-coded paper and paperboard articles, central bank and national statistics releases for macro indicators, food service and hospitality updates from official tourism bodies, and standards or regulatory notices from municipal and environmental authorities. We also used company annual reports, investor presentations, and reputed press to map capacity additions and pricing commentary, and we supported this with paid subscriptions focused on company financials and shipment-level import export tracking. The desk sources mentioned here are illustrative and not exhaustive, and other references were used to collect data, validate assumptions, and resolve open questions during analysis.
Primary Interviews and Surveys
Primary work focused on converting the desk view into a usable sizing model, especially where public data does not split out paper cups cleanly. We spoke with paper cup converters, packaging distributors, foodservice buyers, and recycling and compliance stakeholders across the GCC so volume splits, average pricing, and material pass-through assumptions could be cross-checked.
Inputs from these discussions helped us validate demand seasonality tied to events and tourism peaks, the pace of plastic restriction enforcement, and the typical mix between hot and cold cups that drives material intensity and pricing. Where trade indicators and channel feedback did not align, we retested the assumptions with follow-up outreach before finalizing the totals.
Distribution of primary research fieldwork respondents
| Company type | Respondent position |
|---|---|
| Top tier: 37% | CXOs: 17% |
| Mid tier: 42% | Functional/Unit leaders: 33% |
| Smaller Players: 21% | Managers: 50% |
Market-Sizing & Forecasting
Sizing starts from a top-down build where foodservice beverage occasions and away-from-home consumption are translated into cup demand, which is then converted into value using GCC price bands for key cup formats. To keep the model grounded, results are corroborated using selective bottom-up checks such as converter capacity and utilization discussions, distributor channel checks, and sampled average selling price times estimated volumes for common sizes.
The model uses a small set of practical inputs that move the market in visible ways, including QSR and coffee shop outlet additions, tourism and major-event seasonality that lifts takeaway demand, paperboard and coating material cost direction that feeds into pricing, the rate of plastic cup restrictions by country, and the share shift between hot and cold cups that changes unit economics. Where bottom-up visibility is weak for smaller channels, we use conservative penetration assumptions and then adjust them based on distributor feedback.
For forecasting, scenario analysis is used to reflect different enforcement and substitution paths across GCC markets, and these scenarios are anchored to expectations collected from industry participants. The final forecast is then smoothed to avoid unrealistic year-to-year jumps that are not supported by macro signals or channel checks.
Data Validation & Update Cycle
Validation is done in multiple passes so the final numbers do not rely on a single data stream. We compare model outputs against independent signals such as import trends for cup and paperboard categories, capacity announcements, and buyer procurement feedback, and then investigate large variances before sign-off.
Outliers are reviewed by a second analyst, followed by a final consistency check across assumptions like price progression, volume growth, and country splits. Reports are refreshed annually, and interim updates are made when material events occur such as major policy shifts, capacity changes, or sharp raw material price swings. Before delivery, an analyst performs a fresh pass so clients receive the latest updated view.
Mordor Intelligence's Gcc Paper Cup Market Sizing Compared With Other Published Estimates
Different published estimates for GCC paper cups can vary a lot because the market can be counted at different points in the chain and with different included items. Common differences come from whether numbers reflect cup consumption, manufacturing shipments, or broader disposable packaging mixes, and from how pricing is averaged across formats.
The main gap comes from whether adjacent items like lids and paper food containers are included, where Mordor Intelligence counts only paper cups and builds value using GCC format mix and channel-checked price bands rather than blended disposables averages.
Benchmark comparison
| Source | Market Size | Gaps in Research Methodology |
|---|---|---|
| Mordor Intelligence | USD 376.21 M (2025) | |
| Regional Consultancy A | USD 520.00 M (2025) | Often expands scope to include lids and other paper foodservice disposables, and then applies a blended price, which can lift totals when higher-priced items are mixed in. |
| Trade Journal B | USD 310.00 M (2024) | Frequently relies on trade-only visibility and a conservative conversion to local use, which can miss domestically produced cups and distributor stocking patterns across GCC markets. |
The spread in the table is mainly explained by scope choices and the way value is constructed from volume and pricing. By keeping counted items limited to paper cups and pressure-testing value through channel pricing plus trade and capacity signals, we can provide a transparent total that is easier to update consistently year after year.


Key Questions Answered in the Report
How large is the GCC paper cup market in 2026?
The GCC paper cup market size is USD 389.16 million in 2026 and is projected to reach USD 469.72 million by 2031.
Which country generates the most demand for paper cups in the Gulf?
Saudi Arabia leads with 35.53% of market share in 2025 thanks to its expansive QSR network and hotel growth.
What segment is growing fastest within the market?
Paper cups for vending machines post the highest 5.34% CAGR through 2031, reflecting deployment of smart kiosks.
How will single-use plastics bans affect cup coatings?
Regulations are pushing buyers from PE-coated cups toward PLA-coated and other compostable linings, especially in the UAE and Qatar.
Are double-wall cups gaining popularity?
Yes, double-wall cups show a 4.66% CAGR as delivery and takeaway channels prioritize heat retention without sleeves.
What is the key challenge for converters in the GCC?
Volatile pulp prices and limited recycling infrastructure squeeze margins and complicate sustainability commitments.
Page last updated on:





