Cups And Lids Market Size and Share
Market Overview
| Study Period | 2020 - 2031 |
|---|---|
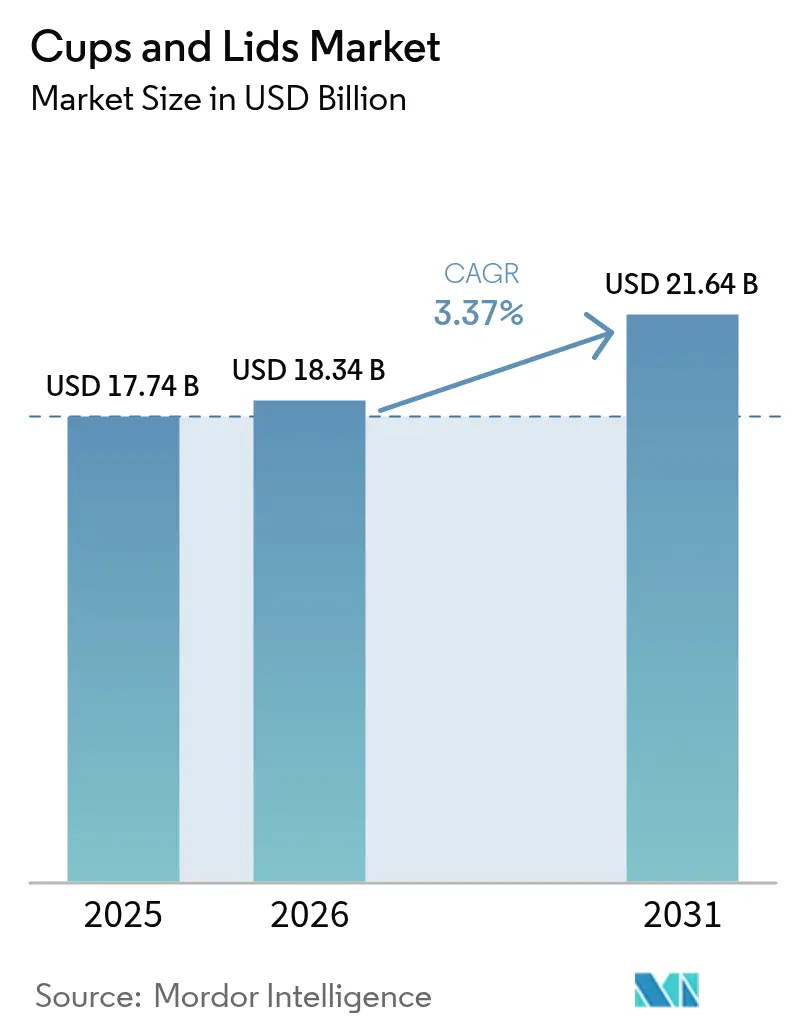
| Market Size (2026) | USD 18.34 Billion |
| Market Size (2031) | USD 21.64 Billion |
| Growth Rate (2026 - 2031) | 3.37% CAGR |
| Fastest Growing Market | Asia Pacific |
| Largest Market | North America |
| Market Concentration | Low |
Major Players *Disclaimer: Major Players sorted in no particular order Image © Mordor Intelligence. Reuse requires attribution under CC BY 4.0. | |
Cups And Lids Market Analysis by Mordor Intelligence
The cups and lids market size in 2026 is estimated at USD 18.34 billion, growing from 2025 value of USD 17.74 billion with 2031 projections showing USD 21.64 billion, growing at 3.37% CAGR over 2026-2031. Moderate yet steady growth reflects post-pandemic foodservice recovery, rising e-commerce volumes, and the spread of on-the-go consumption habits that rely on single-use beverage packaging. Material trends show plastics retaining a 61.35% share in 2024, while paper and paperboard post the fastest 4.63% CAGR, helped by sustainability mandates and molded-fiber innovations. Drinking cups command 52.21% of global revenue, though lids register the quickest 4.49% CAGR as spill-proof and tamper-evident formats gain traction. Foodservice stays the largest end-user at 49.65% share, yet retail and e-commerce outlets expand at 4.86% CAGR as private-label beverages and meal-kit operators raise demand for branded take-home containers. Regionally, North America leads with 39.42% share, but Asia-Pacific delivers the highest 4.51% CAGR, powered by expanding QSR chains and urban coffee culture in China and India..
Key Report Takeaways
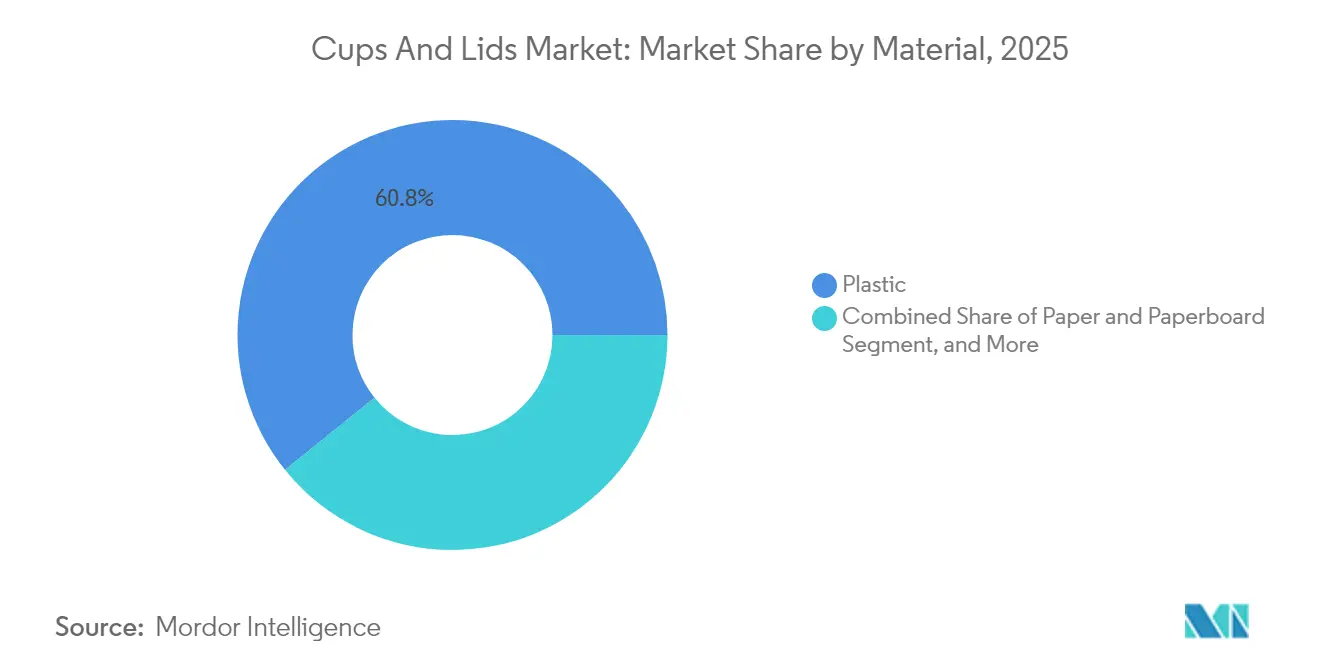
- By material, plastics held a 60.78% of the cups and lids market share in 2025.
- By product type, the cups and lids market for lids is projected to grow at a 4.41% CAGR between 2026-2031.
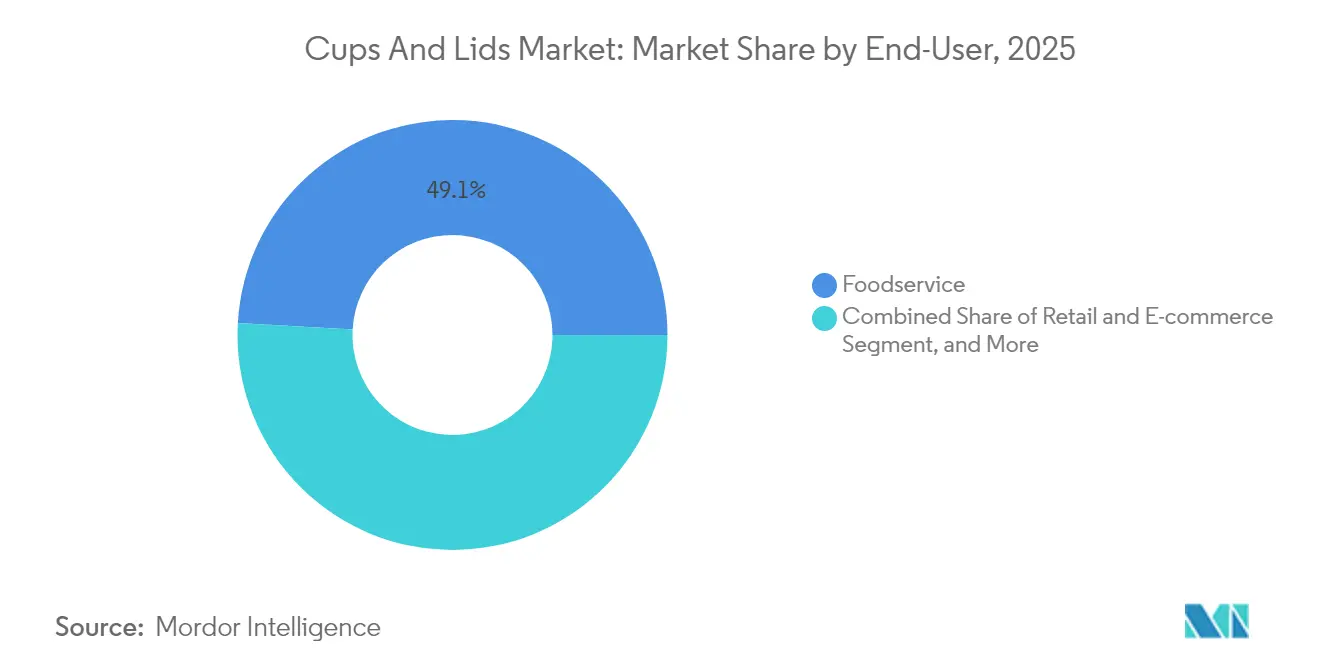
- By end-user, foodservice accounted for a 49.12% share of the cups and lids market size in 2025.
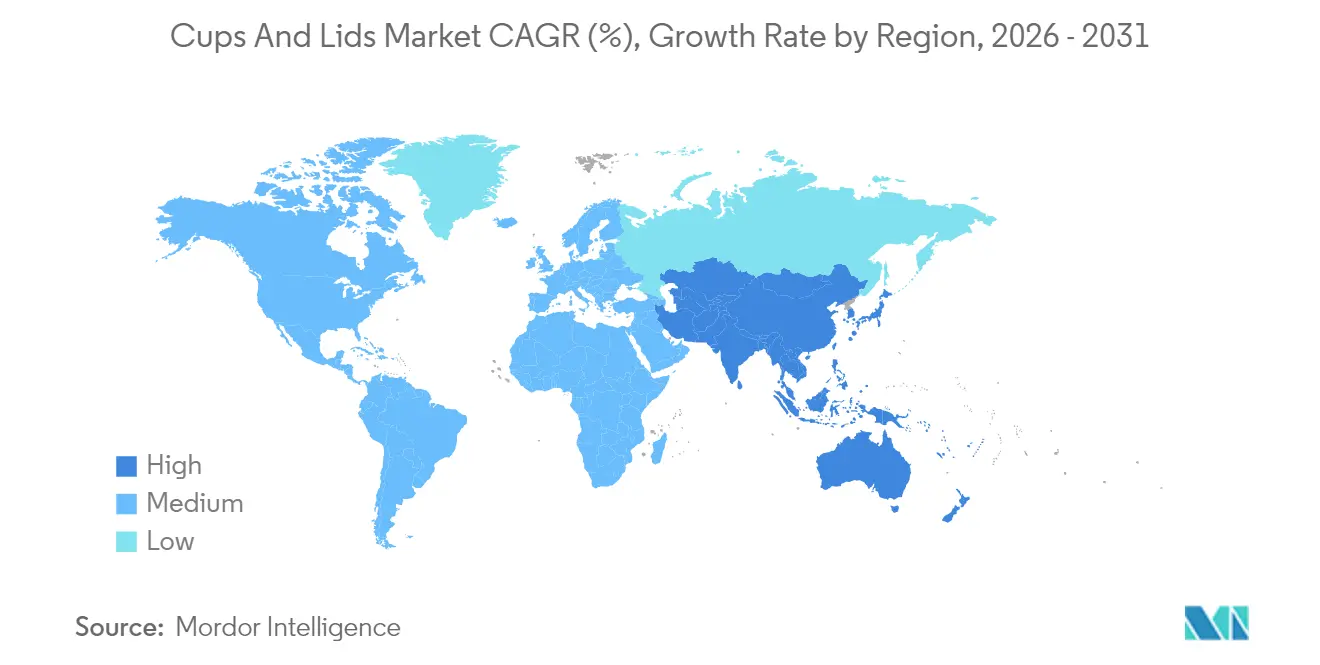
- By geography, the cups and lids market in the Asia-Pacific region is projected to grow at a 4.44% CAGR between 2026-2031.
Note: Market size and forecast figures in this report are generated using Mordor Intelligence’s proprietary estimation framework, updated with the latest available data and insights as of 2026.
Global Cups And Lids Market Trends and Insights
Drivers Impact Analysis*
| Driver | (~) % Impact on CAGR Forecast | Geographic Relevance | Impact Timeline |
|---|---|---|---|
| QSR and Food-delivery Boom | +0.8% | Global, with strongest impact in Asia-Pacific and North America | Medium term (2-4 years) |
| Growth in On-the-go Drinks | +0.6% | Global, particularly urban centers in developed markets | Short term (≤ 2 years) |
| Shift from Glass to Plastic | +0.4% | North America and Europe, spill-over to APAC | Long term (≥ 4 years) |
| Rise of Private-label SKUs | +0.5% | North America and Europe core, expanding to emerging markets | Medium term (2-4 years) |
| Dry-molded-fiber Technology | +0.3% | Europe and North America early adoption, global expansion | Long term (≥ 4 years) |
| AI-optimised Inventory | +0.2% | Developed markets initially, gradual emerging market penetration | Medium term (2-4 years) |
| Source: Mordor Intelligence | |||
QSR and Food-delivery Boom
Rapid expansion of quick-service restaurants and double-digit growth in delivery orders heighten the need for single-serve packaging. McDonald’s opened over 1,100 new outlets in 2024, while DoorDash posted an 18% year-over-year rise in gross order value to USD 18.7 billion in Q1 2025.[1]McDonald’s Corporation, “Fourth Quarter and Full Year 2024 Results,” corporate.mcdonalds.com Each delivery meal typically contains multiple beverages, requiring leak-proof cups and tamper-evident lids that protect food safety during transit. The surge encourages converters to add integrated venting, QR code tracking, and multi-compartment formats. Asian markets gain strongly because QSR penetration remains below Western levels yet grows in double digits, creating incremental demand for disposables.
Growth in On-the-go Drinks
Global coffee shop visits increased by 12% in 2024 as urban commuters sought takeaway beverages. The trend extends to cold brews, protein shakes, and fresh juices, each requiring distinct barrier properties and temperature resilience. Starbucks removed plastic straws by converting to sipper lids across 30,000 locations, eliminating 1 billion straws annually and illustrating how consumer behavior drives lid redesign. Manufacturers respond with polypropylene-free lids and paper-based vents that pass hot-fill tests, leveraging ESG messaging to capture premium shelf space.
Rise of Private-label SKUs
Store brands increased their retail sales share to 20.2% in 2024, up 110 basis points year-over-year. Retailers want cost-effective packaging that still signals quality, prompting suppliers to standardize cup dimensions and lid thread sizes. Regional converters with shorter lead times and flexible print runs gain orders from supermarket chains launching exclusive beverage lines. Walmart sourced more than 500 million cups for its Great Value drinks in 2024, illustrating scale benefits for agile suppliers. The shift promotes bulk procurement contracts that stabilize converter capacity utilization.
Dry-molded-fiber Technology
PulPac’s dry-molded-fiber process removes water from the forming stage, cutting energy use and reducing unit costs by 30% compared to wet molding. Dart Container invested alongside PulPac in 2025 to commercialize fiber-based cups that target cost parity with plastic in the takeaway coffee market. The technology supports deeper draw profiles and embossed logos, allowing brand owners to swap resin without losing functionality. Huhtamäki’s USD 27.3 million expansion in Germany will raise molded-fiber output by 40% and signals accelerating scale-up across Europe.
Restraints Impact Analysis*
| Restraint | (~) % Impact on CAGR Forecast | Geographic Relevance | Impact Timeline |
|---|---|---|---|
| Plastics Regulations | -0.7% | Europe and select US states leading, global expansion | Short term (≤ 2 years) |
| Volatile Resin Prices | -0.5% | Global, with highest impact in cost-sensitive segments | Short term (≤ 2 years) |
| Growing Reusable Culture | -0.4% | Developed markets initially, gradual global adoption | Long term (≥ 4 years) |
| PFAS Barrier Bans | -0.3% | North America and Europe core, regulatory expansion expected | Medium term (2-4 years) |
| Source: Mordor Intelligence | |||
Plastics Regulations
The European Single-Use Plastics Directive and California’s SB 54 mandate require producers to pay new fees of EUR 0.05-0.15 per cup and mandate a 25% reduction in plastic use by 2032. Compliance adds capital costs for material conversion and encourages region-specific product portfolios. Smaller converters face disproportionate burdens and may exit the cups and lids market, leading to higher consolidation.
Volatile Resin Prices
Polyethylene prices swung 35% during 2024, and polystyrene jumped 28% in Q1 2025 before sliding 15% in Q2, squeezing converter margins. Frequent price resets strain restaurant chains on fixed menu pricing and create inventory risks for just-in-time operations. Converters adopt hedging and increased recycled-content use, yet smaller players without access to financial derivatives remain exposed to sharp cost spikes.
*Our forecasts treat driver/restraint impacts as directional, not additive. The impact forecasts reflect baseline growth, mix effects, and variable interactions.
Segment Analysis
By Material: Paper Gains Ground as Sustainability Push Deepens
Paper and paperboard recorded a 4.55% CAGR through 2031, outpacing plastics, even though the latter still held a 60.78% market share in cups and lids in 2025. The cups and lids market size for fiber-based formats is projected to expand steadily as coffee chains trial molded-fiber lids that pass hot-fill requirements. Foam polystyrene continues to decline as municipal bans expand, while bioplastics remain a niche market due to high feedstock costs.
Converters must dual-source to serve mixed regulatory regimes, so capital allocation pivots toward flexible lines that switch between PET, rPET, and coated paperboard. Dart Container’s USD 180 million paper cup line enables rapid order changes, highlighting how leading producers diversify material risk while pursuing eco-label demand. Brands demand chemical-free barrier coatings to avoid PFAS restrictions, prompting investment in water-based dispersions that still withstand temperatures of 100 °C for beverages.


By Product Type: Lids Lead Innovation Curve
Lids posted the highest 4.41% CAGR and now attract R&D funding for sipper geometry, tamper bands, and smart QR seals. Drinking cups still generate 51.62% of revenue, but customers order matched cup-lid kits to simplify recycling streams, so suppliers integrate design and sales. Portion cups serve fast-growing meal-kit firms that require leak-proof formats for sauces and condiments during their two-day shipping process.
Starbucks' adoption of the strawless lid shows how a single retailer can reset design norms and spur broader adoption. E-commerce grocers prefer stackable cup profiles that reduce voxel height in shipping cartons, thereby saving on freight costs. Leading converters file multiple patents around hinge-free vents and lid stock with post-consumer recycled content, locking in switching costs for buyers.
By End-User: Retail and E-commerce Outpace Foodservice
Foodservice keeps 49.12% global revenue share, yet retail and e-commerce channels enjoy a 4.79% CAGR as supermarket chains and direct-to-consumer brands proliferate. The cups and lids market size associated with online grocery shipments is expected to double by 2030 as fresh juice, smoothie kits, and ready-to-drink coffees scale.
Omnichannel brands require packaging that travels well yet opens cleanly during social media-driven unboxing moments. Amazon cut packaging weight by 38% in 2024, requiring suppliers to validate stress performance under automated test regimes. Converters that can ship MOQ-flexible orders and offer co-packed multipacks gain share with emerging food startups.
Geography Analysis
North America retained a 38.96% market share of cups and lids in 2025, supported by a well-established drive-thru culture and consumers willing to pay for sustainable packaging upgrades. Canada’s single-use plastic ban in 2024 fueled migration to coated paperboard, while Mexico’s growing QSR footprint supplied volume growth for low-cost PET cups. FDA food-contact regulations raise barriers for new entrants yet protect incumbents with strong compliance teams.
Asia-Pacific delivered the highest 4.44% CAGR and remains the focal point for capacity expansions. China experienced a 20% increase in coffee consumption in 2024, which heightened demand for specialty lids that preserve the crema texture during takeaway service. India’s USD 70 billion organized retail sector now specifies standardized volume markers on cups, supporting large production runs and thin-wall designs that cut resin use. Regional wage advantages also attract multinational converters, who are building export hubs that ship to buyers in the Middle East.
Europe grew modestly yet remains the innovation leader, largely due to stringent Extended Producer Responsibility fees that favor recyclable mono-material systems. Germany’s 70% recycling rate target for 2025 encourages brand owners to adopt clear PET cups with matching PET lids, thereby enhancing single-stream collection. The European Commission’s Circular Economy Action Plan layers deposit schemes that add EUR 0.05-0.15 per unit, creating demand for lightweight formats that defend total cost. Suppliers with traceable recycled content certification receive procurement preference from large beverage chains.

Competitive Landscape
Global competition is moderately fragmented. The top five players held approximately a 35% revenue share in 2024, with Amcor, Dart Container, and Huhtamäki leading the way. Consolidation rose when Amcor acquired Berry Global’s consumer packaging arm for USD 8.43 billion in 2025 and Novolex purchased Pactiv Evergreen for USD 2.3 billion, creating entities with broader portfolios and better raw material bargaining power.[3]Amcor plc, “Completes Berry Global Acquisition,” amcor.com
Strategy increasingly hinges on sustainability. Huhtamäki allocates 65% of capex to molded-fiber projects that qualify for EU green financing. Dart Container installs AI inventory tools that reduce finished-goods stocks by 18%, freeing up cash to fund next-generation coating lines. Regional challengers leverage proximity and lower freight costs to secure private-label contracts, though they risk margin erosion when resin prices spike.
Technology adoption is rapid. PulPac’s dry-molded-fiber partnership with Dart aims for commercial output by 2026, targeting hot beverages currently served in PE-lined paper cups. Novolex integrates predictive maintenance sensors that reduce unplanned downtime by 12%. Intellectual property related to plant-based coatings and vent geometry becomes a tradable currency in joint-development deals with beverage brands seeking exclusive drinking experiences.
Cups And Lids Industry Leaders
Huhtamäki Oyj
Amcor plc
Mondi plc
Graphic Packaging Holding Company
International Paper Company
- *Disclaimer: Major Players sorted in no particular order

Recent Industry Developments
- September 2025: Huhtamäki confirmed a EUR 25 million (USD 27.3 million) expansion of its molded-fiber capacity in Germany, which will increase capacity by 40% and add 85 jobs.
- August 2025: Dart Container completed a USD 120 million Michigan paper cup plant that uses PFAS-free barrier coatings.
- July 2025: Amcor finalized its USD 8.43 billion takeover of Berry Global’s consumer packaging division, boosting scale in rigid foodservice items.
- June 2025: Novolex closed its USD 2.3 billion merger with Pactiv Evergreen, targeting USD 150 million in annual.


Global Cups And Lids Market Report Scope
Cups and lids are tableware and disposable packaging used in the food and beverage, and food service industries. They prevent spillage and maintain the temperature of the product. The products are offered in various materials and multiple sizes.
The cups and lids market is segmented by material (plastic, paper, and foam), by product (drinking cups, packaging cups, and other cups (portion cups, and food cups) and lids), by end-user (food and beverage, food service, and retail), and by geography (North America (United States, Canada), Europe (United Kingdom, Germany, France, Rest of Europe), Asia-Pacific (China, Japan, India, Rest of Asia Pacific), Latin America (Brazil, Mexico, Rest of Latin America), the Middle East and Africa (United Arab Emirates, Saudi Arabia, South Africa, Rest of Middle East & Africa). The market sizes and forecasts are provided in terms of value USD for all the above segments.
| Plastic |
| Paper and Paperboard |
| Foam (EPS) |
| Molded-fiber / Bagasse |
| Other Material Types |
| Drinking Cups |
| Portion and Packaging Cups |
| Lids |
| Food and Beverage |
| Foodservice |
| Retail and E-commerce |
| Other End-User |
| North America | United States | |
| Canada | ||
| Mexico | ||
| South America | Brazil | |
| Argentina | ||
| Chile | ||
| Rest of South America | ||
| Europe | United Kingdom | |
| Germany | ||
| France | ||
| Italy | ||
| Spain | ||
| Russia | ||
| Rest of Europe | ||
| Asia-Pacific | China | |
| India | ||
| Japan | ||
| South Korea | ||
| Australia | ||
| Rest of Asia-Pacific | ||
| Middle East and Africa | Middle East | Saudi Arabia |
| United Arab Emirates | ||
| Turkey | ||
| Rest of Middle East | ||
| Africa | South Africa | |
| Nigeria | ||
| Rest of Africa | ||
| By Material | Plastic | ||
| Paper and Paperboard | |||
| Foam (EPS) | |||
| Molded-fiber / Bagasse | |||
| Other Material Types | |||
| By Product Type | Drinking Cups | ||
| Portion and Packaging Cups | |||
| Lids | |||
| By End-User | Food and Beverage | ||
| Foodservice | |||
| Retail and E-commerce | |||
| Other End-User | |||
| By Geography | North America | United States | |
| Canada | |||
| Mexico | |||
| South America | Brazil | ||
| Argentina | |||
| Chile | |||
| Rest of South America | |||
| Europe | United Kingdom | ||
| Germany | |||
| France | |||
| Italy | |||
| Spain | |||
| Russia | |||
| Rest of Europe | |||
| Asia-Pacific | China | ||
| India | |||
| Japan | |||
| South Korea | |||
| Australia | |||
| Rest of Asia-Pacific | |||
| Middle East and Africa | Middle East | Saudi Arabia | |
| United Arab Emirates | |||
| Turkey | |||
| Rest of Middle East | |||
| Africa | South Africa | ||
| Nigeria | |||
| Rest of Africa | |||


Key Questions Answered in the Report
How large is the cups and lids market in 2026?
The cups and lids market size stood at USD 18.34 billion in 2026 with a 3.37% CAGR outlook to 2031.
Which material is growing fastest?
Paper and paperboard post a 4.55% CAGR due to sustainability regulations and molded-fiber innovations.
Why are lids growing faster than cups?
Spill-proof and tamper-evident designs needed for delivery and strawless formats push lids to a 4.41% CAGR.
Which region offers the best growth prospects?
Asia-Pacific leads with a 4.44% CAGR as QSR chains and coffee culture expand in China and India.
How are regulations affecting plastic cups?
EU and U.S. state bans introduce per-unit fees and reduction targets that lift costs and accelerate material shifts to fiber or recycled PET.
Page last updated on:


