Paper Straw Market Size and Share
Market Overview
| Study Period | 2020 - 2031 |
|---|---|
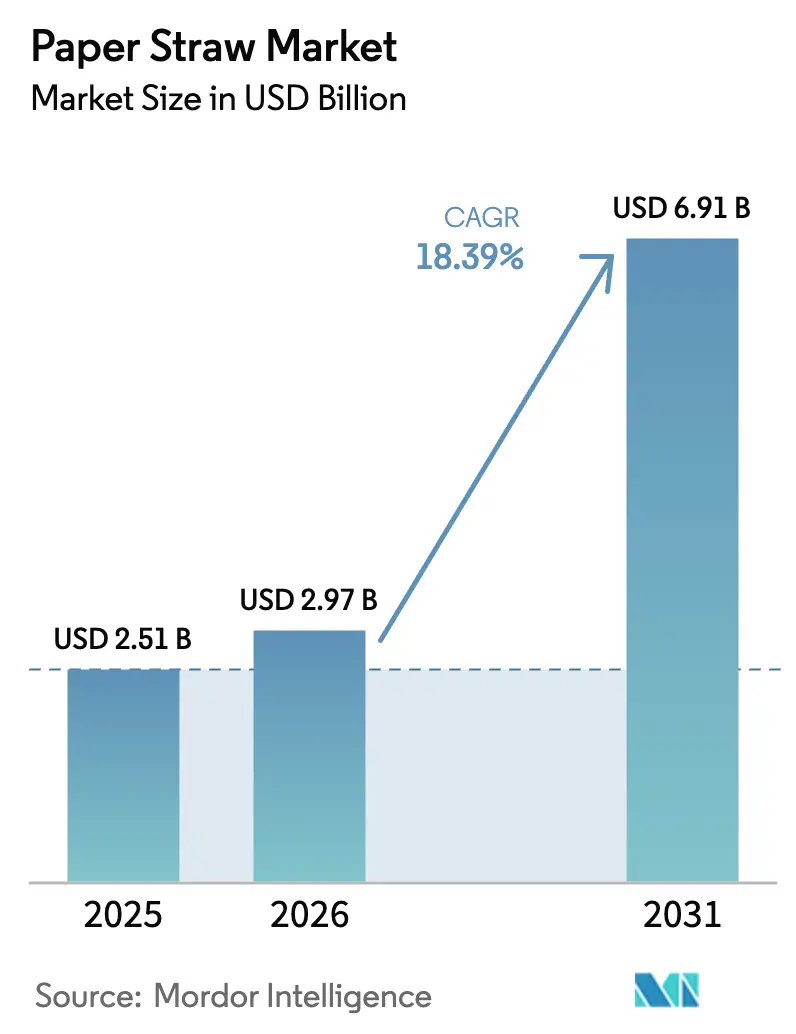
| Market Size (2026) | USD 2.97 Billion |
| Market Size (2031) | USD 6.91 Billion |
| Growth Rate (2026 - 2031) | 18.39% CAGR |
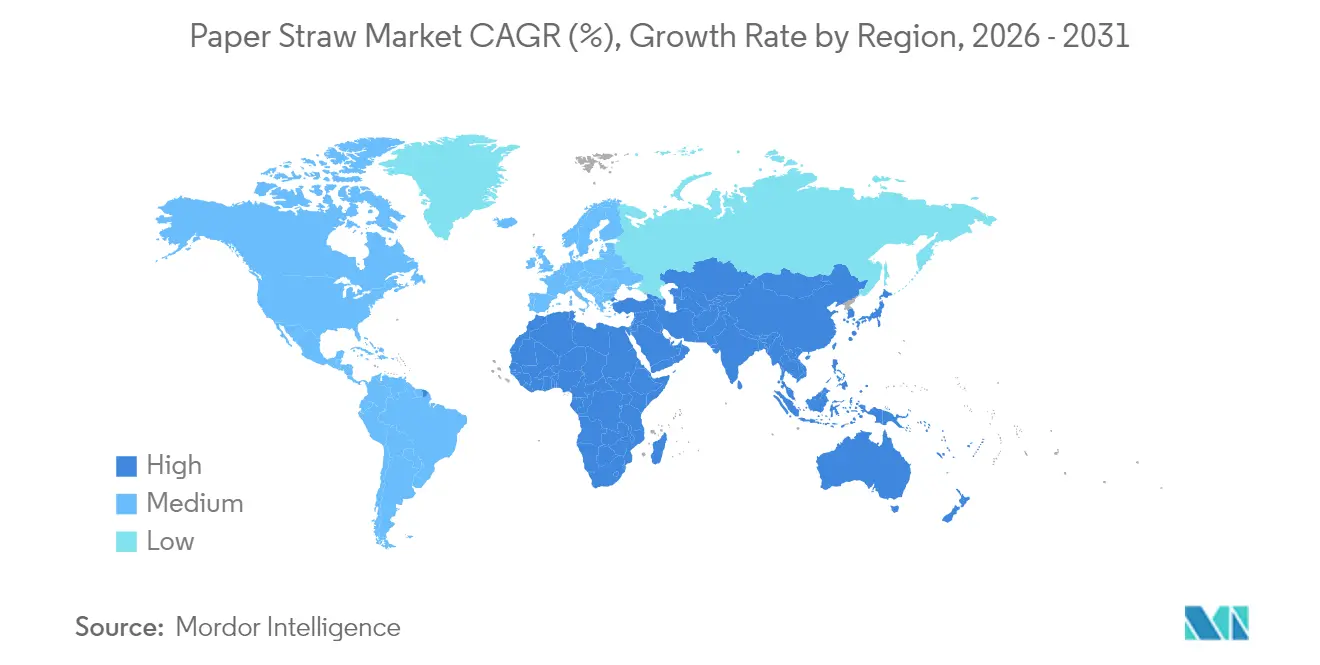
| Fastest Growing Market | Asia Pacific |
| Largest Market | Europe |
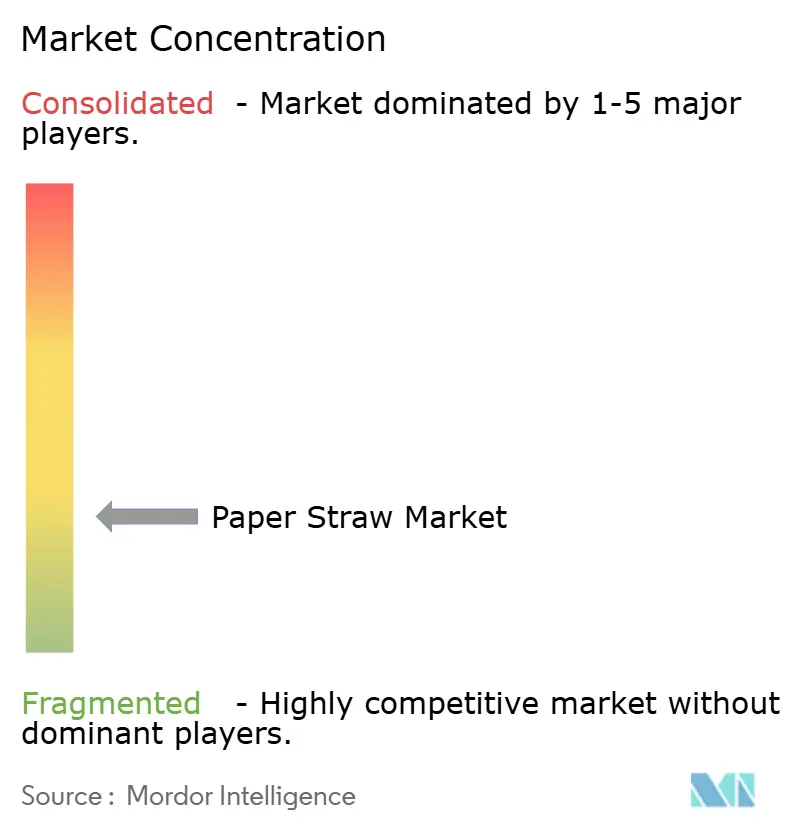
| Market Concentration | Low |
Major Players *Disclaimer: Major Players sorted in no particular order Image © Mordor Intelligence. Reuse requires attribution under CC BY 4.0. | |
Paper Straw Market Analysis by Mordor Intelligence
Paper straw market size in 2026 is estimated at USD 2.97 billion, growing from 2025 value of USD 2.51 billion with 2031 projections showing USD 6.91 billion, growing at 18.39% CAGR over 2026-2031. Heightened regulation, rapid advances in hydrophobic coatings, and large-scale procurement commitments from foodservice chains have moved sustainable drinking straws from a niche substitute to a mainstream packaging component. Global bans on single-use plastics now carry financial penalties rather than voluntary targets, enabling manufacturers to plan multi-year capacity expansions with greater certainty. Institutional buyers are standardizing forest-certified materials, which rewards vertically integrated suppliers that can guarantee traceability and end-of-life compliance. At the same time, mergers between packaging majors are consolidating scale advantages and unlocking larger R&D budgets that accelerate coating and forming breakthroughs. These shifts increase switching costs for plastic incumbents and create a durable growth runway for the paper straw market.
Key Report Takeaways
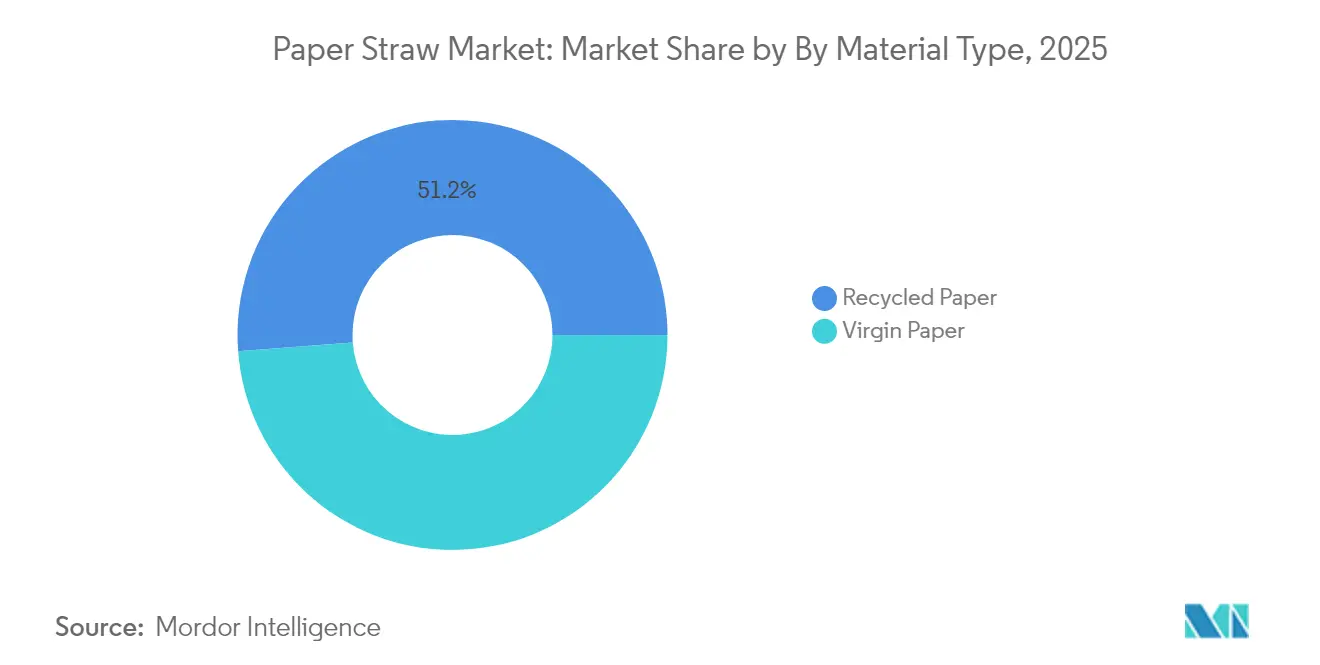
- By material type, recycled paper held 51.20% of paper straw market share in 2025, while virgin paper lagged; recycled grades are expanding at a 22.96% CAGR to 2031.
- By straw product type, non-printed variants captured 56.12% revenue share in 2025, yet printed/branded straws are advancing at a 24.12% CAGR through 2031.
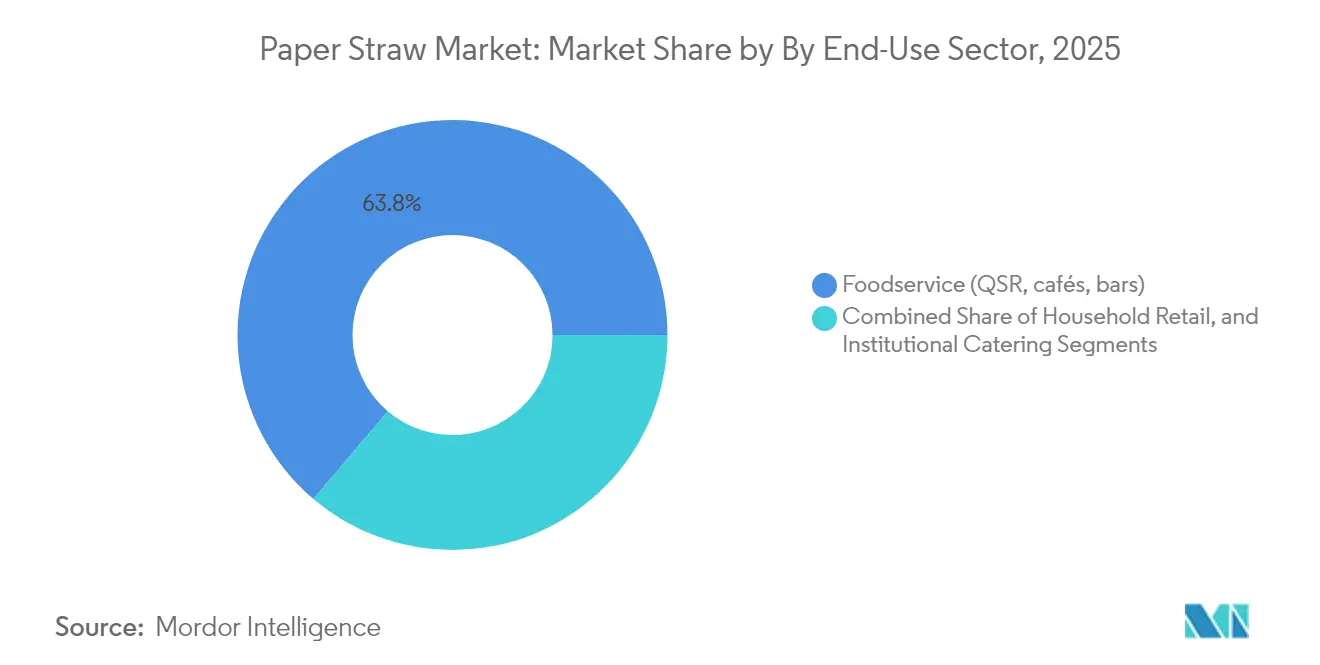
- By end-use sector, foodservice dominated with 63.80% of the paper straw market size in 2025; household retail is forecast to expand at a 21.63% CAGR.
- By diameter, standard 6-7 mm straws represented 47.10% of paper straw market size in 2025, while wide/bubble-tea versions are registering a 25.68% CAGR.
- By sales channel, offline B2B distribution accounted for 67.10% share of the paper straw market in 2025, and the e-commerce channel is growing at 27.92% CAGR.
- By geography, Europe led with 30.40% share of the paper straw market in 2025; Asia-Pacific is projected to post the fastest 20.58% CAGR to 2031.
Note: Market size and forecast figures in this report are generated using Mordor Intelligence’s proprietary estimation framework, updated with the latest available data and insights as of 2026.
Global Paper Straw Market Trends and Insights
Drivers Impact Analysis*
| DRIVER | (~) % IMPACT ON CAGR FORECAST | GEOGRAPHIC RELEVANCE | IMPACT TIMELINE |
|---|---|---|---|
| Global bans on single-use plastics | +4.2% | Global, with early adoption in EU, China, Hong Kong | Medium term (2-4 years) |
| Growing consumer preference for eco-friendly products | +3.1% | North America & EU, expanding to APAC | Long term (≥ 4 years) |
| Fast-food & QSR sustainability pledges | +2.8% | Global, led by McDonald's, Starbucks deployment | Short term (≤ 2 years) |
| Extended Producer Responsibility (EPR) mandates | +2.3% | EU core, expanding to North America | Medium term (2-4 years) |
| Breakthrough hydrophobic paper-coating technologies | +1.9% | Global, with R&D concentration in EU, Japan | Long term (≥ 4 years) |
| Retail private-label "green branding" initiatives | +1.4% | North America & EU, selective APAC markets | Medium term (2-4 years) |
| Source: Mordor Intelligence | |||
Global bans on single-use plastics drive market transformation
Coordinated restrictions now cover major economies, obligating retailers and food outlets to remove non-degradable plastic straws from service. China’s Plastic Pollution Control Action Plan and Hong Kong’s 2024 prohibition have tightened compliance windows, while the EU Single-Use Plastics Directive supplies the enforcement template used by emerging markets. These statutes impose measurable waste-reduction targets, giving converters the confidence to finance new paper machines and coating lines. Regulatory visibility also reassures investors that long-term volumes in the paper straw market will rise even in low-margin quick-service segments.[1]G20 Marine Plastic Litter Partnership, “Annual Progress Update 2024,” g20mpl.org
Growing consumer preference for eco-friendly products reshapes procurement
Generation Z demands packaging that blends environmental credibility with functional rigor. Surveys show that this cohort rejects soggy or taste-altering straws, so converters are developing cellulose-nanocrystal and bio-polyester coatings to meet higher performance thresholds. Catering giants such as Compass Group integrate these specifications into contract bids, forcing suppliers across the paper straw industry to raise barrier standards. As QSR chains publicize renewable-content milestones, the consumer expectation loop tightens, accelerating innovation and uptake.
Fast-food and QSR sustainability pledges create demand anchors
Chains including McDonald’s and Starbucks have replaced plastic in more than 50 national markets, generating predictable order flows that justify new regional production hubs. The resulting volume guarantees help small and mid-size converters secure financing, while distribution groups like Sysco launch proprietary biodegradable lines to capture incremental restaurant sales. These influential buyers now specify FSC certification and compostability, raising the baseline entry criteria for the paper straw market.
Extended Producer Responsibility mandates accelerate supply chain integration
Under EU law, brand owners must fund post-consumer recycling for drinking-straw packaging, converting sustainability goals into ledger costs. Similar frameworks under debate in the United States would levy differentiated fees based on recyclability scores, making paper straws less expensive to steward than plastic. Suppliers that combine substrate production, converting, and recovery analytics gain an advantage because their integrated reporting reduces compliance friction for multinational retailers.
Restraints Impact Analysis*
| RESTRAINTS | (~) % IMPACT ON CAGR FORECAST | GEOGRAPHIC RELEVANCE | IMPACT TIMELINE |
|---|---|---|---|
| Higher unit cost than plastic straws | -2.7% | Global, with acute impact in price-sensitive markets | Short term (≤ 2 years) |
| Functional performance (sogginess, taste) | -1.8% | Global, particularly in premium beverage segments | Medium term (2-4 years) |
| PFAS contamination scrutiny | -1.3% | EU, North America, expanding to APAC | Medium term (2-4 years) |
| Sustainable fiber supply bottlenecks | -1.1% | Global, with concentration in virgin fiber regions | Long term (≥ 4 years) |
| Source: Mordor Intelligence | |||
Higher unit cost than plastic straws constrains penetration
Plastic machines benefit from higher production speeds and cheaper feedstocks, keeping unit economics in their favor. When inflation lifts input costs for foodservice operators, procurement teams still scrutinize cents-per-serving, especially in emerging markets. The closure of a Fort Wayne paper straw plant underscores how tight margins can trigger capacity cuts. However, landfill levies and reputational risks tied to plastic are narrowing the gap, while new raw-material pathways such as reed-based substrates promise further cost relief.[2] 21Alive News, “Paper straw plant closure impacts Fort Wayne jobs,” 21alivenews.com
Functional performance limitations drive technology innovation
Extended immersion can weaken fiber walls, causing premium drink makers to doubt product suitability. Coatings based on poly(butylene succinate) and seaweed-derived polymers now improve rigidity without compromising compostability. As patent filings increase for barrier-coated paper straws, producers are capturing intellectual-property positions that differentiate them in bids for airline and specialty café contracts. Bio-indicator pigments that change color with beverage acidity hint at the next wave of functional enhancements waiting to reach mass scale.
*Our forecasts treat driver/restraint impacts as directional, not additive. The impact forecasts reflect baseline growth, mix effects, and variable interactions.
Segment Analysis
By Material Type: recycled paper outpaces virgin grades
Recycled paper generated 51.20% of paper straw market size in 2025 and is forecast to climb faster than any other substrate, posting a 22.96% CAGR through 2031. Cost advantages arise from maturing collection networks that now divert higher-quality recovered fiber into food-grade applications. EPR surcharges for virgin packaging further tilt procurement toward recycled input. Virgin paper retains relevance for premium aesthetics and complicated print colors, yet new soot-removal processes are closing that gap and making high-grade recycled pulp fit for upscale brand channels.
Conversion investments reflect this momentum. Stora Enso allocated EUR 1 billion to retrofit its Oulu mill for folding box board and coated kraft, supplies that can also feed food-contact straw laminations. As line speeds rise, throughput for recycled rolls is matching virgin lines, easing concerns on output differentials. Manufacturer alliances with municipal waste authorities secure stable fiber inflows, insulating plants from spot price volatility. Such integration raises entry barriers for late entrants and reinforces the advantage held by early recyclers in the paper straw market.


By Straw Product Type: printed variants create brand real estate
Unprinted straws kept 56.12% of market revenue in 2025 because quick-service restaurants prioritize unit cost. Printed designs, however, are growing at 24.12% CAGR as retailers treat straws as miniature billboards. Digital presses that handle water-based inks now allow sub-10,000-piece runs while retaining food-contact compliance, opening the customization field to boutique cafés. Mass chains use recurring campaigns tied to movie releases or sporting events to create collectable straw sets, a tactic that increases beverage attachment rates and captures premium pricing.
Printed-straw converters invest in seven-color flexo modules and automated plate-mounting to satisfy these briefs without excessive setup waste. The transition from petroleum-based inks to vegetable formulations also advances environmental credentials, harmonizing messaging across straw graphics and sustainability branding. As printing economics improve, market analysts expect printed options to narrow the price delta with plain white counterparts, amplifying their share of the paper straw market over the decade.
By End-Use Sector: household retail gains ground
Foodservice commanded 63.80% of the paper straw market in 2025, anchored by binding sustainability policies at global QSR chains. Household retail is projected to expand at a 21.63% CAGR as e-commerce removes shelf-space bottlenecks. Subscription packs ship mixed-diameter assortments direct to consumers, reducing per-unit costs and building brand loyalty. Private-label launches on major grocery platforms further democratize access, pushing paper straw market size for home use toward parity with traditional catering channels.
Institutional catering—schools, hospitals, airlines—presents steady growth because administrators face public scrutiny over waste statistics. Distributor catalogs now feature FSC-certified paper straws alongside compostable cutlery, simplifying compliance for procurement officers. As medical facilities mandate latex-free environments, paper straws with hypoallergenic coatings offer an added benefit that plastic cannot match, carving out another niche within the broader paper straw industry.
By Straw Diameter/Size: bubble-tea demand reshapes profiles
Standard 6-7 mm straws retained 47.10% of paper straw market size in 2025, but wider 8-12 mm formats are advancing at 25.68% CAGR. The global diffusion of bubble tea requires diameters large enough to pass tapioca pearls without clogging. Asian café chains entering Europe and North America specify high burst strength and beveled tips, prompting converters to develop multilayer wraps that hold shape for the duration of a 500 ml serving. Specialty straws above 12 mm, though niche, command premium pricing for smoothie bowls and frozen coffee drinks.
Material scientists focus on wide-diameter rigidity because larger bore magnifies bending stress. Reinforced helically-wound constructions and hybrid paper-PLA composite layers emerge as leading approaches. These advances reduce wall thickness, saving fiber, and keeping costs controlled even as performance rises. Success in this segment signals the market’s ability to diversify beyond soda and water channels.
Geography Analysis
Europe led with a 30.40% paper straw market share in 2025 thanks to an enforcement-heavy policy environment and mature recycling logistics. Germany, France, and the United Kingdom anchor demand as public institutions align procurement with the EU Single-Use Plastics Directive. Mill upgrades at Oulu, Finland, and dry-forming investments in Skene, Sweden, demonstrate European producers’ confidence in long-term domestic consumption. Retailers favor regionally supplied straws to avoid carbon emissions from transcontinental shipping, reinforcing intra-European sourcing.
Asia-Pacific is growing at 20.58% CAGR to 2031, propelled by synchronized regulatory acts in China, Hong Kong, and Japan. Combined with the runaway popularity of bubble tea, these measures lock in multi-year demand for wide-diameter products. Lower conversion costs due to abundant fiber and labor pools allow Asian plants to compete on export tenders, positioning the region to surpass Europe in absolute volume during the forecast. Manufacturers are rapidly integrating automated inspection to meet Western food-contact standards, accelerating acceptance in premium markets.
North America delivers steady expansion as state-level bans spread from coastal regions toward the Midwest. McDonald’s and Sysco’s commitments guarantee baseline volume even where regulation remains patchwork. Large integrated producers like Packaging Corporation of America reported record 2025 revenue of USD 2.1 billion, spotlighting sustained end-market health. Venture funding targets niche materials such as seaweed or reed, underlining a diverse innovation scene that complements scaled paper assets.

Competitive Landscape
Competition remains moderate in concentration but high in technological differentiation. The Smurfit WestRock merger valued at USD 11.2 billion created a top-tier player with global reach and robust R&D, while the USD 6.7 billion Novolex-Pactiv Evergreen tie-up added a portfolio exceeding 250 brands. These unions raise the hurdle rate for mid-size firms yet also establish toll-manufacturing opportunities for specialty innovators lacking distribution muscle.
Innovation revolves around hydrophobic coatings and multilayer constructions. Huhtamaki’s blueloop platform, paired with a EUR 100 million cost-savings plan, shows that incumbents seek both sustainability credentials and leaner cost structures. Patent race dynamics are shifting as cellulose-nanocellulose hybrids mature, prompting cross-licensing talks that may prevent litigation stalemates. Emerging firms like Reedest enter with distinct raw-material angles such as reed pulp, broadening the fiber basket and supplying regional authenticity narratives that resonate with conscious consumers.
White-space persists in high-function segments. Airlines want straws that sustain carbonation integrity for several hours, while premium cocktail bars look for color-stable options under acidic conditions. Start-ups working on pH-responsive pigments or thermally embossed branding tackle these needs and could become acquisition targets as conglomerates pursue niche growth pools within the paper straw market. Strategic investments that blend minority stakes with supply agreements are increasingly common because they hedge technology bets without immediate full acquisitions.
Paper Straw Industry Leaders
Aardvark Straws LLC (Hoffmaster Group Inc.)
Huhtamaki Oyj
Transcend Packaging Ltd
Tetra Pak International SA
Fuling Global Inc.
- *Disclaimer: Major Players sorted in no particular order

Recent Industry Developments
- March 2025: Stora Enso commenced operations of its new consumer packaging board line at the Oulu site in Finland, representing a EUR 1 billion investment with annual capacity of 750,000 tonnes and expected annual sales of EUR 800 million by 2027. The facility will produce folding box board and coated unbleached kraft for food and beverage packaging applications, strengthening Stora Enso's position in the renewable packaging market.
- January 2025: Kimberly-Clark announced a USD 2 billion investment over 5 years to expand North American manufacturing operations, including a new facility in Warren, Ohio, and expansion of its Beech Island, South Carolina site. The investment aims to enhance manufacturing capacity and create over 900 skilled jobs, with construction beginning in May 2025.
- April 2025: Novolex completed its merger with Pactiv Evergreen, creating a leading manufacturer in food, beverage, and specialty packaging valued at approximately USD 6.7 billion. The combined entity operates with over 250 brands and 39,000 SKUs, positioning it as a significant player in sustainable packaging solutions.
- January 2024: Reedest raised EUR 3 million to develop drinking straws from Estonian reed, targeting production capacity of 1 million straws daily by May 2024. The initiative addresses paper straw durability issues while providing 100% natural, biodegradable alternatives without additives.


Global Paper Straw Market Report Scope
Paper straws are becoming more prevalent in the current environment due to the expanding government restrictions on plastic straws and rising ecological consciousness. Paper straws are increasingly used instead of plastic since they are more environmentally friendly. Also, paper straws are typically seen as a healthier alternative to plastic straws because they do not contain potentially dangerous chemicals like BPA and phthalates. The market size reflects the revenue generated by paper straw manufacturers across end users, including foodservice, households, institutions, and others.
The paper straw market is segmented by material type (virgin paper and recycled paper), application (foodservice, households, institutions, and other applications), and geography (North America, Europe, Asia-Pacific, Latin America, and Middle East and Africa). The market sizes and forecasts are provided in terms of value (USD) for all the above segments.
| Virgin Paper |
| Recycled Paper |
| Non-printed |
| Printed / Branded |
| Foodservice (QSR, cafes, bars) |
| Household Retail |
| Institutional Catering (schools, hospitals, airlines) |
| Standard (6-7 mm) |
| Wide / Bubble-tea (8-12 mm) |
| Specialty (greater than 12 mm) |
| Offline B2B Distribution |
| Online / E-commerce |
| North America | United States |
| Canada | |
| Mexico | |
| Europe | United Kingdom |
| Germany | |
| France | |
| Italy | |
| Rest of Europe | |
| Asia-Pacific | China |
| Japan | |
| India | |
| South Korea | |
| Rest of Asia-Pacific | |
| Middle East | Israel |
| Saudi Arabia | |
| United Arab Emirates | |
| Turkey | |
| Rest of Middle East | |
| Africa | South Africa |
| Egypt | |
| Rest of Africa | |
| South America | Brazil |
| Argentina | |
| Rest of South America |
| By Material Type | Virgin Paper | |
| Recycled Paper | ||
| By Straw Product Type | Non-printed | |
| Printed / Branded | ||
| By End-Use Sector | Foodservice (QSR, cafes, bars) | |
| Household Retail | ||
| Institutional Catering (schools, hospitals, airlines) | ||
| By Straw Diameter / Size | Standard (6-7 mm) | |
| Wide / Bubble-tea (8-12 mm) | ||
| Specialty (greater than 12 mm) | ||
| By Sales Channel | Offline B2B Distribution | |
| Online / E-commerce | ||
| By Geography | North America | United States |
| Canada | ||
| Mexico | ||
| Europe | United Kingdom | |
| Germany | ||
| France | ||
| Italy | ||
| Rest of Europe | ||
| Asia-Pacific | China | |
| Japan | ||
| India | ||
| South Korea | ||
| Rest of Asia-Pacific | ||
| Middle East | Israel | |
| Saudi Arabia | ||
| United Arab Emirates | ||
| Turkey | ||
| Rest of Middle East | ||
| Africa | South Africa | |
| Egypt | ||
| Rest of Africa | ||
| South America | Brazil | |
| Argentina | ||
| Rest of South America | ||


Key Questions Answered in the Report
What is the current size of the paper straw market?
The global paper straw market generated USD 2.97 billion in 2026.
How fast is the paper straw market expected to grow?
The market is projected to advance at an 18.39% CAGR, reaching USD 6.91 billion by 2031.
Which region is growing the fastest?
Asia-Pacific is forecast to post the highest 20.58% CAGR, driven by regulatory convergence and bubble tea expansion.
What segment holds the largest paper straw market share?
Foodservice applications led with 63.80% revenue share in 2025.
Why are recycled paper straws gaining popularity?
Recycled content satisfies Extended Producer Responsibility rules and offers cost advantages as collection infrastructure matures.
What are the main challenges facing the market?
Higher unit costs versus plastic and performance concerns like sogginess continue to restrain adoption, though coating innovations are narrowing both gaps.
Page last updated on:


